Article Text

Abstract
Background: Prostaglandin D2 (PGD2) is a major cyclooxygenase product generated by activated mast cells during an allergic response. Assessment of PGD2 and its metabolites in patients with asthma has mostly been performed in urine, bronchoalveolar lavage fluid and induced sputum, whereas human plasma determinations have been performed only sporadically.
Methods: In 32 patients with allergic asthma and 50 healthy non-allergic controls, baseline plasma and urinary levels of 9α,11β-PGF2, a primary PGD2 metabolite, were assessed by gas chromatography/mass spectrometry. Serum tryptase levels were measured by fluoroenzyme immunoassay and urinary leukotriene E4 (LTE4) by ELISA. In a subgroup of 10 asthmatics (randomly selected from the 32 study patients) in whom bronchial allergen challenges with specific allergens (Dermatophagoides pteronyssinus, n = 4, mixed grass pollens, n = 6) were carried out, measurements were taken both before and after provocation.
Results: At baseline no significant differences between mean plasma and urinary levels of the PGD2 metabolite and serum tryptase levels were found in asthmatics or controls. Asthmatic patients had significantly higher urinary LTE4 levels. Allergen challenge resulted in a significant early increase in the mean plasma 9α,11β-PGF2 level and only a borderline but significant increase in the urinary 9α,11β-PGF2 level within 2 hours after provocation. The challenge did not produce statistically significant changes in serum tryptase levels. Urinary LTE4 levels remained significantly increased 4 hours after provocation.
Conclusions: PGD2 is actively involved in the early asthmatic response to allergens. Measurement of 9α,11β-PGF2 release into plasma rather than urine following allergen challenge is a sensitive marker of enhanced PGD2 synthesis, most probably due to mast cell activation.
- asthma
- prostaglandin D2
- plasma 9α,11β-PGF2
- leukotriene E4
- EAR, early asthmatic response
- FEV1, forced expiratory volume in 1 second
- LAR, late asthmatic response
- LTE4, leukotriene E4
- PGD2, prostaglandin D2
Statistics from Altmetric.com
- EAR, early asthmatic response
- FEV1, forced expiratory volume in 1 second
- LAR, late asthmatic response
- LTE4, leukotriene E4
- PGD2, prostaglandin D2
In patients with allergic asthma, inhalation of a specific allergen may cause a bronchospastic reaction within minutes. In some cases this early asthmatic response (EAR) is followed by a late asthmatic response (LAR) within a few hours. In EAR the central role is played by IgE mediated activation of mast cells and a subsequent release of mediators and cytokines. The mechanism of LAR is less clear and is probably related to the influx of eosinophils and other inflammatory cells to the site of the allergic reaction.
Prostaglandin D2 (PGD2) is a major cyclooxygenase metabolite almost entirely generated by activated mast cells. Other possible cellular sources capable of synthesising small amounts of PGD2 include platelets,1 alveolar macrophages,2 and lymphocytes Th2.3 PGD2 is a potent bronchoconstrictor in humans, 10.2 times more potent than histamine and 3.5 times more potent than PGF2α.4 Apart from this direct spasmogenic effect, PGD2 increases vascular permeability and causes vasodilatation.5 It also possesses chemoattractive properties for eosinophils, basophils, and lymphocytes Th2.6 PGD2 elicits its biological activity through two pharmacologically distinct G protein coupled receptors: prostaglandin D receptor (DP) and a novel chemoattractant receptor homologous molecule (CRTH2).7
PGD2 is rapidly metabolised and eliminated mainly through the kidneys. 75% of radiolabelled PGD2 infused into a healthy man was recovered in the urine within 6 hours.8 Active metabolites of prolonged activity, rather than the parent compound, were therefore measured in body fluids. 9α,11β-PGF2 is the primary PGD2 metabolite which shares biological activity with its parent compound.9 Assessment of PGD2 and its metabolites in patients with asthma has mostly been performed in urine,10 bronchoaveloar lavage fluid,11 and recently in induced sputum.12 There are few data on the levels in human plasma.
In the present study we measured plasma and urinary levels of 9α,11β-PGF2 in patients with allergic asthma and in healthy non-allergic controls. The kinetics of PGD2 release to plasma and urine after allergen challenge were also assessed.
METHODS
Subjects
Two groups of subjects were studied. The first comprised 32 patients with allergic asthma who gave a history of dyspnoea after exposure to specific aeroallergens and had positive skin prick tests to them. They were in a stable condition and none had suffered an asthma exacerbation or respiratory tract infection within the preceding 6 weeks. Their clinical characteristics are shown in table 1.
Characteristics of all subjects studied
Bronchial provocation tests with specific allergens (Dermatophagoides pteronyssinus, n = 4; mixed grass pollens, n = 6) were carried out in 10 subjects randomly selected from the group. The specific allergen used for the provocation was the one to which an individual gave an allergic history, had a positive skin test, and evidence of specific IgE antibodies in class ⩾2. The subjects had mild asthma and had demonstrated bronchial hyperresponsiveness to histamine during the 2 weeks before the study. At the time, four were on inhaled corticosteroids (doses ⩽400 μg budesonide). The clinical characteristics of these 10 subjects are shown in table 2. The pollen challenges were performed out of season.
Clinical characteristics of patients with asthma subjected to allergen challenge (n = 10)
The control group comprised 50 healthy non-allergic subjects with no history of asthma or allergy. Both skin prick tests to common aeroallergens and a qualitative in vitro assay for determination of specific IgE antibodies were negative (table 1).
Before entering the study each subject gave written informed consent and the protocol was approved by the local ethics committee.
Inhalation test with allergen
Allergen solutions (Aquagen SQ, ALK, Hørsholm, Denmark) were prepared from stock solutions (100 000 SQ-U/ml) of D pteronyssinus and mixed grass pollens by diluting in ALK diluent. A range of 10-fold incrementally increasing concentrations of the allergen from 1 SQ-U/ml to 100 000 SQ-U/ml were prepared immediately before the provocation. They were administered by abcPneumo 2000 RS (abcMED, Cracow, Poland) computerised system combined with the Bronchial Control Treatment System (abcMED, Cracow, Poland) adjusted to controlled delivery of aerosolised substances during inhalation.
Forced expiratory volume in 1 second (FEV1) was measured before the challenge and subjects were excluded from further study if FEV1 was <80% of the predicted value. The provocation was commenced with the inhalation of 1 ml ALK diluent delivered during 10 quiet breaths. FEV1 was measured immediately after the completion of diluent inhalation and 5 and 10 minutes later. If FEV1 fell >15%, the test was terminated because of bronchial instability. Alternatively, the mean FEV1 was calculated from three measurements after diluent inhalation and regarded as the baseline value.
Inhalation of 1 ml of allergen extracts began with the lowest concentration (1 SQ-U/ml). FEV1 was recorded immediately, 5, and 10 minutes after termination of each inhalation of the incrementally increasing concentrations of allergen. The test was continued until the concentration of allergen provoking a fall of at least 20% in the mean post-diluent (baseline) FEV1 was reached (PC20). The challenge was concluded and EAR was recognised. When the highest allergen concentration (100 000 SQ-U/ml) was reached and no positive reaction occurred within 30 minutes, the test was regarded as negative. After completing the provocation test, FEV1 was measured every hour for the following 12 hours to record a possible LAR. This occurred if a second decrease in FEV1 of at least 15% was observed.
Bronchial provocation tests always started between 08.00 and 08.30 hours. Short acting antihistamines and cromones were withheld for at least 5 days before the test and long acting β2 agonists and theophylline were withheld for 24 hours. Short acting β2 agonists were not administered at least 8 hours before the challenge.
Blood collection
In all subjects blood samples were taken at baseline for measurement of 9α,11β-PGF2 and tryptase. In a subgroup of asthmatic subjects subjected to allergen challenge, blood samples were also collected at 5, 30, 60, 120 minutes after completion of the challenge (fall in FEV1 ⩾20%).
For measurement of 9α,11β-PGF2, blood samples were immediately centrifuged at 3500 rpm for 10 minutes and 500 pg deuterium labelled prostaglandin F2α ([2H4]PGF2α) as an internal standard was added to 1 ml plasma. For tryptase measurements blood samples were allowed to clot and serum was removed after centrifugation. Samples were immediately processed or stored at −80°C until assayed (up to 1 month).
Urine collection
Urine samples for 9α,11β-PGF2 and leukotriene E4 (LTE4) measurement were collected from all subjects at baseline (after a 2 hour accumulation of urine in the bladder (that is, 06.00–08.00 hours). In addition, urine samples were also collected from 10 asthmatic subjects undergoing allergen challenge at 2 hour intervals (2, 4, 6, and 8 hours) after completion of the challenge.
Assessment of 9α,11β-PGF2, tryptase, and LTE4
9α,11β-PGF2 was measured in plasma and urine by gas chromatography-negative ion chemical ionisation-mass spectrometry (GC-NICI-MS) following the extraction step using C18 Sep-Pak cartridge, derivatisation to pentafluorobenzyl ester, TLC purification, and derivatisation to trimethylsilyl ether (Hewlett Packard, Palo Alto, CA, USA). Deuterium labelled PGF2α ([2H4]PGF2α) was used as an internal standard in a manner identical to gas chromatography-electron impact mass spectrometry as reported by Obata et al.13 Tryptase was measured in serum by a fluoroenzyme immunoassay method using UniCAP100 Tryptase System (Pharmacia & Upjohn, Uppsala, Sweden). LTE4 excretion was analysed in non-purified urine samples by an enzyme linked immunosorbent assay (ELISA, Cayman Chemicals, Ann Arbor, MI, USA) according to the method of Kumlin et al.14
Skin tests
Both the asthmatic and control subjects underwent skin prick tests with 12 common aeroallergens (Soluprick, ALK, Hørsholm, Denmark). The positive control was histamine hydrochloride (1 mg/ml) and the diluent for the allergens tested was used as a negative control. A positive skin prick test was defined as a mean wheal diameter of 3 mm larger than that of the negative control.
Measurements of specific IgE
In 10 asthmatics subjected to allergen challenge the concentrations of allergen specific antibodies were determined by a fluoroenzyme immunoassay method using the PharmaciaCAP system specific IgE FEIA (Pharmacia & Upjohn Diagnostics). Values of ⩾0.35 kU/l represented positive results which were expressed in classes 0–6.
In all controls in vitro qualitative screening assay for differential determination of specific IgE to common aeroallergens was carried out by fluoroenzyme immunoassay method using the PharmaciaCAP System Phadiatop (Pharmacia & Upjohn Diagnostics). The cut off point for positive and negative results was 0.35 kU/l.
Statistical analysis
Comparisons between the two groups studied under baseline conditions were made with the Student’s t test when data were found to be normally distributed, otherwise the Mann-Whitney U test was used. The relations between the pre- and post-challenge levels in 10 asthmatics were analysed using the Friedman’s ANOVA repeated measure analysis of variance for dependent variables followed by Wilcoxon’s signed rank test. Correlation between variables was assessed using the Pearson’s correlation coefficient. Data were expressed as mean (SD) values for clinical characteristics and as mean (SE) with confidence intervals of mean differences for the between group and pre- and post-challenge comparisons. p values of <0.05 were considered statistically significant. Statistical evaluation was made using STATISTICA for Windows version 6.0 (StatSoft Inc, Tulsa, OK, USA).
RESULTS
Clinical observations
In all 10 asthmatics, inhalation of allergen triggered EAR manifested by dyspnoea and a fall in FEV1 of ⩾20% (from 20.8% to 50.4%; mean (SD) 31.1 (10.0)%) between 5 and 10 minutes after completion of the challenge. The individual PC20 values are shown in table 2. In five of the 10 patients EAR was followed by LAR within 6–8 hours of the challenge, characterised by a fall in FEV1 of 16.0–24.5% (mean (SD) 19.6 (3.5)%) compared with baseline. All reactions were well controlled and therapeutically reversed.
Eicosanoids and tryptase baseline values
No significant differences were found between the mean baseline plasma and urinary levels of 9α,11β-PGF2 measured in asthmatic subjects and controls (table 3). Patients with asthma had significantly higher urinary LTE4 levels than controls (table 3). The baseline tryptase levels determined in asthmatics were similar to those in controls (table 3).
Mean (SE) baseline values of eicosanoids and tryptase in study groups
Plasma 9α,11β-PGF2 following allergen challenge
Allergen inhalation resulted in a significant early mean fivefold increase in plasma 9α,11β-PGF2 levels (16.98 (5.62) pg/ml) compared with the mean baseline level (3.38 (0.46) pg/ml; mean difference 13.6 (95% CI 0.73 to 26.5), p<0.01, fig 1A). This value gradually declined but was still significantly higher when measured 30 minutes after the challenge (8.87 (2.37) pg/ml, mean difference 5.49 (95% CI 0.01 to 11.0), p<0.05). It tended to be higher 60 minutes after the challenge (5.99 (0.92) pg/ml, mean difference 2.61 (95% CI 0.53 to 4.7), p>0.05) and had returned to the baseline level by 120 minutes after the challenge (4.07 (0.59) pg/ml, mean difference 0.69 (95% CI −0.66 to 2.0), p>0.05).
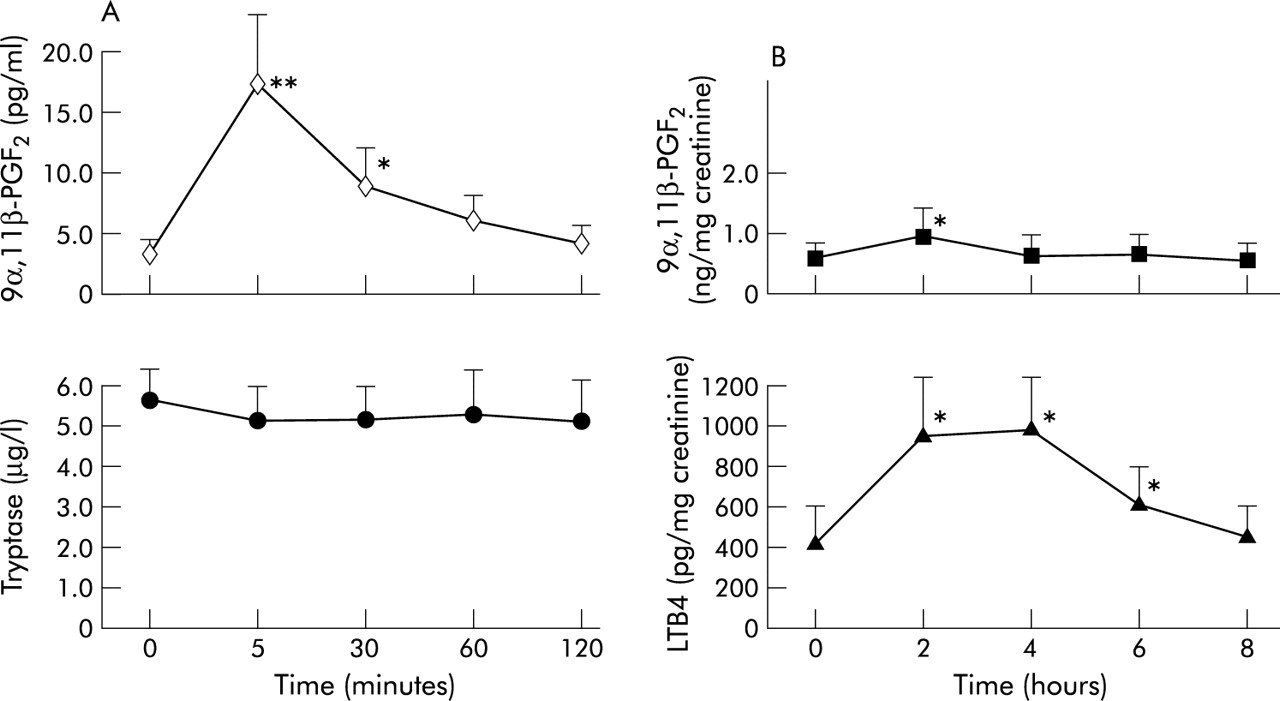
Mean (SE) levels of (A) 9α,11β-PGF2 (◊) and tryptase (•) in blood and (B) 9α,11β-PGF2 (▪) and LTE4 (▴) in urine before and after allergen provocation in 10 asthmatics. *p<0.05, **p<0.01.
The kinetics of the response were almost homogenous in all 10 asthmatics (fig 2A).

Individual excretion of (A) plasma 9α,11β-PGF2, (B) serum tryptase, (C) urinary 9α,11β-PGF2, and (D) urinary LTE4 in samples collected from 10 asthmatics undergoing bronchial allergen challenge.
Serum tryptase following allergen challenge
Mean serum tryptase levels did not show significant changes when measured 5 minutes (5.11 (0.74) μg/l), 30 minutes (5.24 (0.77) μg/l), 60 minutes (5.33 (0.88) μg/l) and 120 minutes (5.05 (0.82) μg/l) after challenge compared with the mean baseline value (5.59 (0.71) μg/l, p>0.05), with mean differences of −0.48 (95% CI −1.47 to 0.5), −0.34 (95% CI −1.11 to 0.4), −0.25 (95% CI −1.36 to 0.9), and −0.54 (95% CI −1.73 to 0.6), respectively (fig 1A).
In individual subjects the values remained fairly stable, although inter-individual differences were observed (fig 2B).
Urinary 9α,11β-PGF2 following allergen challenge
Allergen inhalation caused only a small but significant 1.5-fold increase in the mean urinary 9α,11β-PGF2 level in samples collected during the first 2 hours after challenge (1.06 (0.14) ng/mg creatinine). Compared with baseline levels (0.72 (0.1) ng/mg creatinine, mean difference 0.34 (95% CI −0.05 to 0.7)), the significance was of borderline significance (p = 0.04, fig 1C). The mean readings obtained from the remaining three 2 hour intervals (0.76 (0.09) ng/mg creatinine, mean difference 0.04 (95% CI −0.09 to 0.2)), (0.73 (0.1) ng/mg creatinine, mean difference 0.01 (95% CI −0.11 to 0.1)), and (0.69 (0.07) ng/mg creatinine, mean difference −0.02 (95% CI −0.12 to 0.1)), respectively, were similar to the baseline value (p>0.05, fig 1B).
There was considerable variability between individuals in the time courses (fig 2C). In five subjects with LAR the mean urinary 9α,11β-PGF2 levels measured within 6–8 hours of the challenge did not vary significantly from the pre-challenge levels (p>0.05).
Urinary LTE4 following allergen challenge
The mean urinary LTE4 level increased 2.5-fold over the baseline (397.8 (131.2) pg/mg creatinine) when measured in samples collected during the first 2 hours after completion of the challenge (956.4 (293.6) pg/mg creatinine, mean difference 558.6 (95% CI 100.8 to 1016.4), p<0.05, fig 1B). It was still significantly higher in urine samples collected 2–4 hours (978.0 (259.9) pg/mg creatinine, mean difference 580.2 (95% CI 123.2 to 1037.2), p<0.05) and 4–6 hours after completing the challenge (607.7 (127.1) pg/mg creatinine, mean difference 209.9 (95% CI −4.27 to 424.1), p<0.05), but returned to the pre-challenge level within 6–8 hours (453.4 (97.3) pg/mg creatinine, mean difference 55.6 (95% CI −132.0 to 243.2), p>0.05).
The allergen challenge led to a rise in urinary LTE4 excretion in all 10 asthmatics (fig 2D). Similar to urinary 9α,11β-PGF2 levels, in the five subjects who developed LAR the mean urinary LTE4 levels measured within 6–8 hours of the challenge were comparable to those measured at baseline (p>0.05).
Analysis of correlations between the variables
At baseline no correlation was found between plasma and urinary levels of 9α,11β-PGF2 (r = 0.35; p>0.05), between plasma 9α,11β-PGF2 and serum tryptase levels (r = 0.16; p>0.05), or between urinary LTE4 and urinary 9α,11β-PGF2 levels (r = 0.23; p>0.05).
DISCUSSION
This study provides conclusive evidence that 9α,11β-PGF2, the primary metabolite of PGD2, increases significantly in plasma during EAR following an allergen challenge. All but one of the asthmatic subjects challenged with an allergen responded with an early fivefold increase in 9α,11β-PGF2. The increased values gradually returned to baseline within 2 hours of the challenge.
There are few data on plasma levels of PGD2 and its metabolites in patients with bronchial asthma. In three children admitted to hospital with an acute asthmatic attack, plasma 9α,11β-PGF2 levels were lower at the time of discharge than on admission.13 In another report two PGD2 metabolites (9α,11β-PGF2 and PGD-M) increased in the plasma of healthy volunteers after ingestion of niacin.15 Baseline plasma levels of both these metabolites were substantially increased in systemic mastocytosis.15 We have recently observed significantly higher baseline plasma levels of 9α,11β-PGF2 in subjects with aspirin induced asthma than in asthmatics who tolerated aspirin.16 Furthermore, aspirin challenge led to a further significant rise in the metabolite in aspirin sensitive subjects.16
In contrast to the plasma levels, only a small (1.5-fold) but significant rise was seen in the urinary 9α,11β-PGF2 level in the first 2 hours following the allergen challenge. The mean values measured at the subsequent time intervals were comparable to the baseline level. In patients who developed LAR, no increase in the urinary 9α,11β-PGF2 level occurred within 6–8 hours of the challenge. These findings are not fully in agreement with those of Sładek et al17 who reported an early 3.8-fold rise in urinary levels of PGD-M, another PGD2 metabolite, within 2 hours of inhalation of a threshold concentration of allergen in eight patients with atopic asthma. The measurement of PGD-M (9α,11β-dihydroxy-15-oxo-2,3,18,19-tetranorprost-5-ene-1,2-diodic acid) rather than 9α,11β-PGF2 may account for the difference. In five subjects with LAR there was no late rise in the urinary levels of this metabolite, in line with our own findings. O’Sullivan et al18 showed that a single threshold dose of allergen inhaled by nine patients with allergic asthma precipitated bronchoconstriction followed by a distinct 3.5-fold increase in the urinary concentration of 9α,11β-PGF2 in samples collected immediately after the reaction. In keeping with our results, they found no difference in baseline levels of this metabolite between asthmatics and healthy controls. In a study by O’Sullivan et al10 a 2.8-fold increase in urinary levels of 9α,11β-PGF2 was observed in 12 patients with mild atopic asthma not only during EAR but also during LAR. However, this late rise was smaller and more protracted. In this study two doses of allergen were inhaled 15 minutes apart. The discrepancies in the results might be due to different allergen challenge protocols, numbers of patients, or different assay methods. In the latter two studies10,18 the enzyme immunoassay (EIA) method was used. This measures the sum of 9α,11β-PGF2 and the two isomers of its dinor metabolite, whereas the GC-NICI-MS which we used is more specific and measures only 9α,11β-PGF2.19 At present the methods based on GC-MS are considered to be the gold standard for reliable routine quantification of eicosanoid formation in vivo in humans.20
LTE4 excretion into urine after allergen induced bronchoconstriction was more intense and protracted than the excretion of 9α,11β-PGF2. The concurrent appearance in the urine of the PGD2 metabolite and LTE4 may suggest mast cell activation during EAR, although it does not rule out participation of other cells. Since eosinophils, basophils, and macrophages also produce leukotrienes, this may explain why the excretion of LTE4 was more abundant than that of 9α,11β-PGF2 which almost entirely originates from mast cells. The role of cysteinyl leukotrienes in the bronchospastic reaction provoked by allergen was documented by Taylor et al21 and confirmed by others.22,23 We did not find an increase in urinary LTE4 levels during LAR, which is consistent with other reports.24
In agreement with other investigators,25 we did not detect any changes in tryptase levels after allergen challenge. Tryptase is considered to be a marker of mast cell activation in systemic anaphylaxis and mastocytosis26 and increases in some subjects with aspirin induced asthma after oral aspirin challenge.16 A significant increase in mean serum tryptase levels was observed only after a positive oral aspirin challenge associated with extrapulmonary symptoms, but not after inhalation of lysine aspirin despite a comparable bronchoconstriction provoked by both challenges.27 Perhaps only massive mast cell degranulation leads to an increase in the serum tryptase concentration. An allergen precipitated rise in tryptase levels was reported in nasal lavage28 and bronchoalveolar lavage fluids29 of allergic subjects after local instillation of an allergen into the nose and bronchi, respectively.
In conclusion, this study shows for the first time that 9α,11β-PGF2 measurements in plasma offer a sensitive way of measuring PGD2 synthesis in the airways in a bronchoprovocation model of asthma. Its early appearance in the plasma immediately after the allergen provoked bronchospastic reaction corroborates the results of previous studies10,17,18 which show that PGD2 is actively involved in EAR. This might in turn, though indirectly, point to mast cell activation. A small but significant increase in urinary levels of 9α,11β-PGF2 may therefore give reasonable grounds to believe that measurement of this metabolite in urine is not as sensitive as in plasma.