Article Text

Abstract
Objective To compare the strengths and limitations of cardiovascular risk scores available for clinicians in assessing the global (absolute) risk of cardiovascular disease.
Design Review of cardiovascular risk scores.
Data sources Medline (1966 to May 2009) using a mixture of MeSH terms and free text for the keywords ‘cardiovascular’, ‘risk prediction’ and ‘cohort studies’.
Eligibility criteria for selecting studies A study was eligible if it fulfilled the following criteria: (1) it was a cohort study of adults in the general population with no prior history of cardiovascular disease and not restricted by a disease condition; (2) the primary objective was the development of a cardiovascular risk score/equation that predicted an individual's absolute cardiovascular risk in 5–10 years; (3) the score could be used by a clinician to calculate the risk for an individual patient.
Results 21 risk scores from 18 papers were identified from 3536 papers. Cohort size ranged from 4372 participants (SHS) to 1591209 records (QRISK2). More than half of the cardiovascular risk scores (11) were from studies with recruitment starting after 1980. Definitions and methods for measuring risk predictors and outcomes varied widely between scores. Fourteen cardiovascular risk scores reported data on prior treatment, but this was mainly limited to antihypertensive treatment. Only two studies reported prior use of lipid-lowering agents. None reported on prior use of platelet inhibitors or data on treatment drop-ins.
Conclusions The use of risk-factor-modifying drugs—for example, statins—and disease-modifying medication—for example, platelet inhibitors—was not accounted for. In addition, none of the risk scores addressed the effect of treatment drop-ins—that is, treatment started during the study period. Ideally, a risk score should be derived from a population free from treatment. The lack of accounting for treatment effect and the wide variation in study characteristics, predictors and outcomes causes difficulties in the use of cardiovascular risk scores for clinical treatment decision.
- Risk stratification
- coronary artery disease (cad)
- general practice
This is an open-access article distributed under the terms of the Creative Commons Attribution Non-commercial License, which permits use, distribution, and reproduction in any medium, provided the original work is properly cited, the use is non commercial and is otherwise in compliance with the license. See: http://creativecommons.org/licenses/by-nc/2.0/ and http://creativecommons.org/licenses/by-nc/2.0/legalcode.
Statistics from Altmetric.com
What is already known on this subject
Guidelines advocate the use of cardiovascular risk scores to calculate global risk instead of focusing on single risk modification.
Healthcare providers in the UK are expected to select a cardiovascular risk score appropriate for their requirements from the many existing risk assessment tools with the recent change in the NICE guidelines.
What this study adds
The existing risk scores vary widely in terms of study characteristics, predictors and outcomes.
These cohort studies have not taken into account the effect of treatment on the study population and will therefore underestimate cardiovascular risk.
Introduction
For many years, the Framingham cardiovascular risk equation has been the preferred method of cardiovascular risk assessment. However, in February 2010, the National Institute for Health and Clinical Excellence (NICE) announced that the Framingham equation should be considered as just one of several acceptable methods.1 The same guideline included a systematic review, which found 110 different cardiovascular risk-scoring methods. Clinicians are now able and expected to select, from these 110 cardiovascular risk scores, one that is appropriate for their patients. How should they decide which one is appropriate?
Despite guidelines advocating the use of cardiovascular risk scores to calculate global risk instead of focusing on single risk modification, adoption of cardiovascular risk scores has been slow.1 2 One survey in three countries showed that only 48% of physicians regularly use cardiovascular risk scores.3 In another survey in six European countries, 85% of respondents recognised the importance of global risk assessment; yet, the majority (62%) used a subjective assessment of cardiovascular risk rather than specific risk calculators in practice.4 Subjective risk assessment often disagrees with assessment by cardiovascular risk scores.3 5 Doctors who use cardiovascular risk scores can rate individual risk factors more accurately6 and are more likely to correctly prescribe treatment in given scenarios than non-users.3
Why don't doctors use cardiovascular risk scores in practice? Many physicians do not trust the validity of the risk scores7 and believe their own estimation to be more accurate.3 Another reason may simply be that there is too much choice. The Framingham risk equations were first published in 1976.8 Since then, many other cohort studies have developed their own equations such as PROCAM,9 SCORE10 and QRISK.11 These cohort studies differ significantly in terms of study population characteristics, risk predictors and outcomes.12
Cardiovascular risk scores measure baseline risk factors to predict future cardiovascular morbidity and mortality, but most do not account for changes in treatment during the years of follow-up. Failure to adjust for such treatment effects will cause cardiovascular risk scores to systematically underestimate predicted risk. This problem is greater for more recent studies with the progressive increase in the use of effective medication for blood pressure and lipids over the past 20–30 years.13 14
We aimed to review the strengths and limitations of current cardiovascular risk scores, to assess how these may impact on the classification of patients' risk of cardiovascular disease, and to identify the scores that may be most appropriate for use in clinical care.
Methods of review
Objectives
The objective of this review is to assess the strengths and limitations of cardiovascular risk scores available to clinicians for the assessment of global or absolute risk of cardiovascular disease. A particular focus was on how the risk scores dealt with the effects of treatment during follow-up.
Search methods for identification of studies
We searched Medline (1966 to May 2009) using a mixture of MeSH terms and free text for the keywords ‘cardiovascular’, ‘risk prediction’ and ‘cohort studies’. To identify other studies that answered our question, we also used our own literature files, previous reviews of cardiovascular scores, and citation tracking.
A study was eligible if it fulfilled the following criteria: (1) it was a cohort study of adults in the general population with no prior history of cardiovascular disease and not restricted by a disease condition; (2) the primary objective was the development of a cardiovascular risk score/equation that predicted an individual's absolute cardiovascular risk in 5–10 years; and (3) the score could be used by a clinician to calculate the risk for an individual patient.
Identifying studies
We screened the titles and abstracts of all retrieved records to identify exclusions. Full copies or reprints of records not excluded were then assessed to determine if they met with the inclusion criteria for the review. Any disagreements were resolved through discussion.
Data extraction
Two reviewers, LSM and JD, appraised and selected the studies, then extracted information from each study for analysis. Information extracted included study demographics, outcomes, predictors and treatment effect.
Results
A total of 3536 papers were retrieved after removal of duplicates from records identified through the Medline search and other sources. Figure 1 shows the PRISMA flow diagram. The PRISMA statement and review protocol are available online as supplemental material.
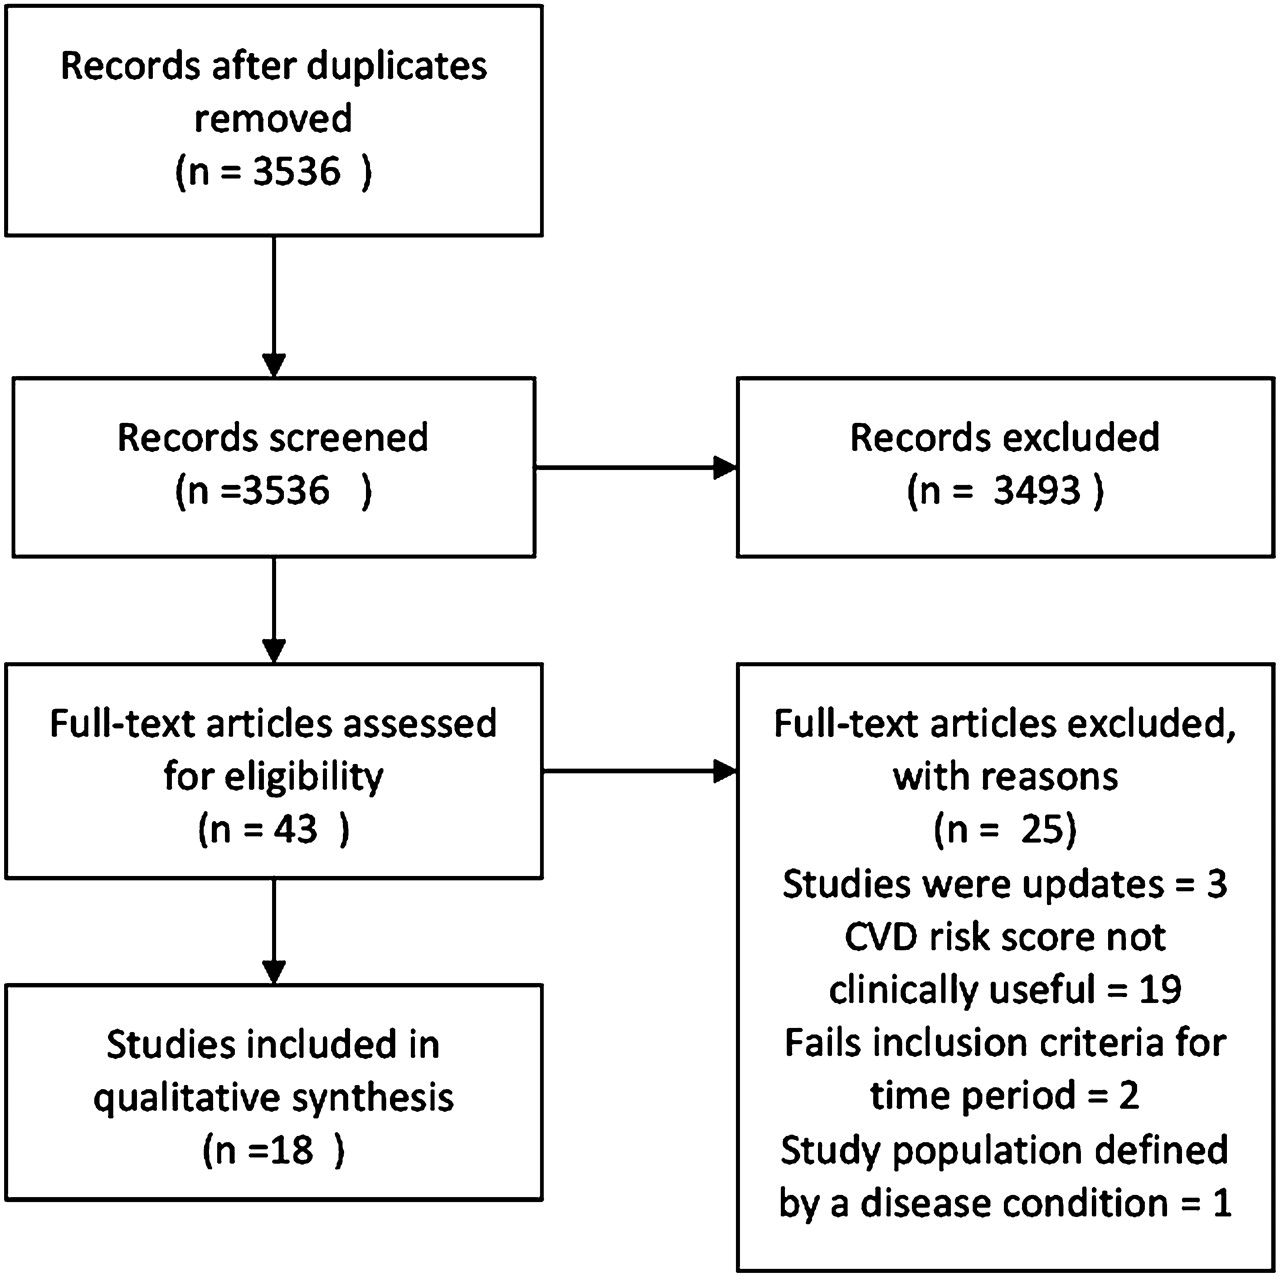
PRISMA flow diagram.
Description of studies
We identified 21 risk scores eligible for the review (table 1) from 18 papers. Five were from Framingham,8 17–19 three from the Munster group (PROCAM)9 20 and ARIC (Atherosclerosis Risk in Communities),21 22 two each from QRISK11 23 and Reynolds,24 25 and one each from the Scottish Heart Health Extended Cohort,26 Strong Heart Study,27 USA-PRC (People's Republic of China Collaborative Study of Cardiovascular Epidemiology)28 and NHEFS (National Health and Nutrition Examination Survey NHANES 1 Epidemiologic Follow-up Study).29 Some risk scores used multiple cohorts: SCORE10 was derived from a pool of 12 European cohorts, and Progetto CUORE30 from a pool of Italian cohorts. Twelve are from North America, eight are European, and one from China.
Description of the studies
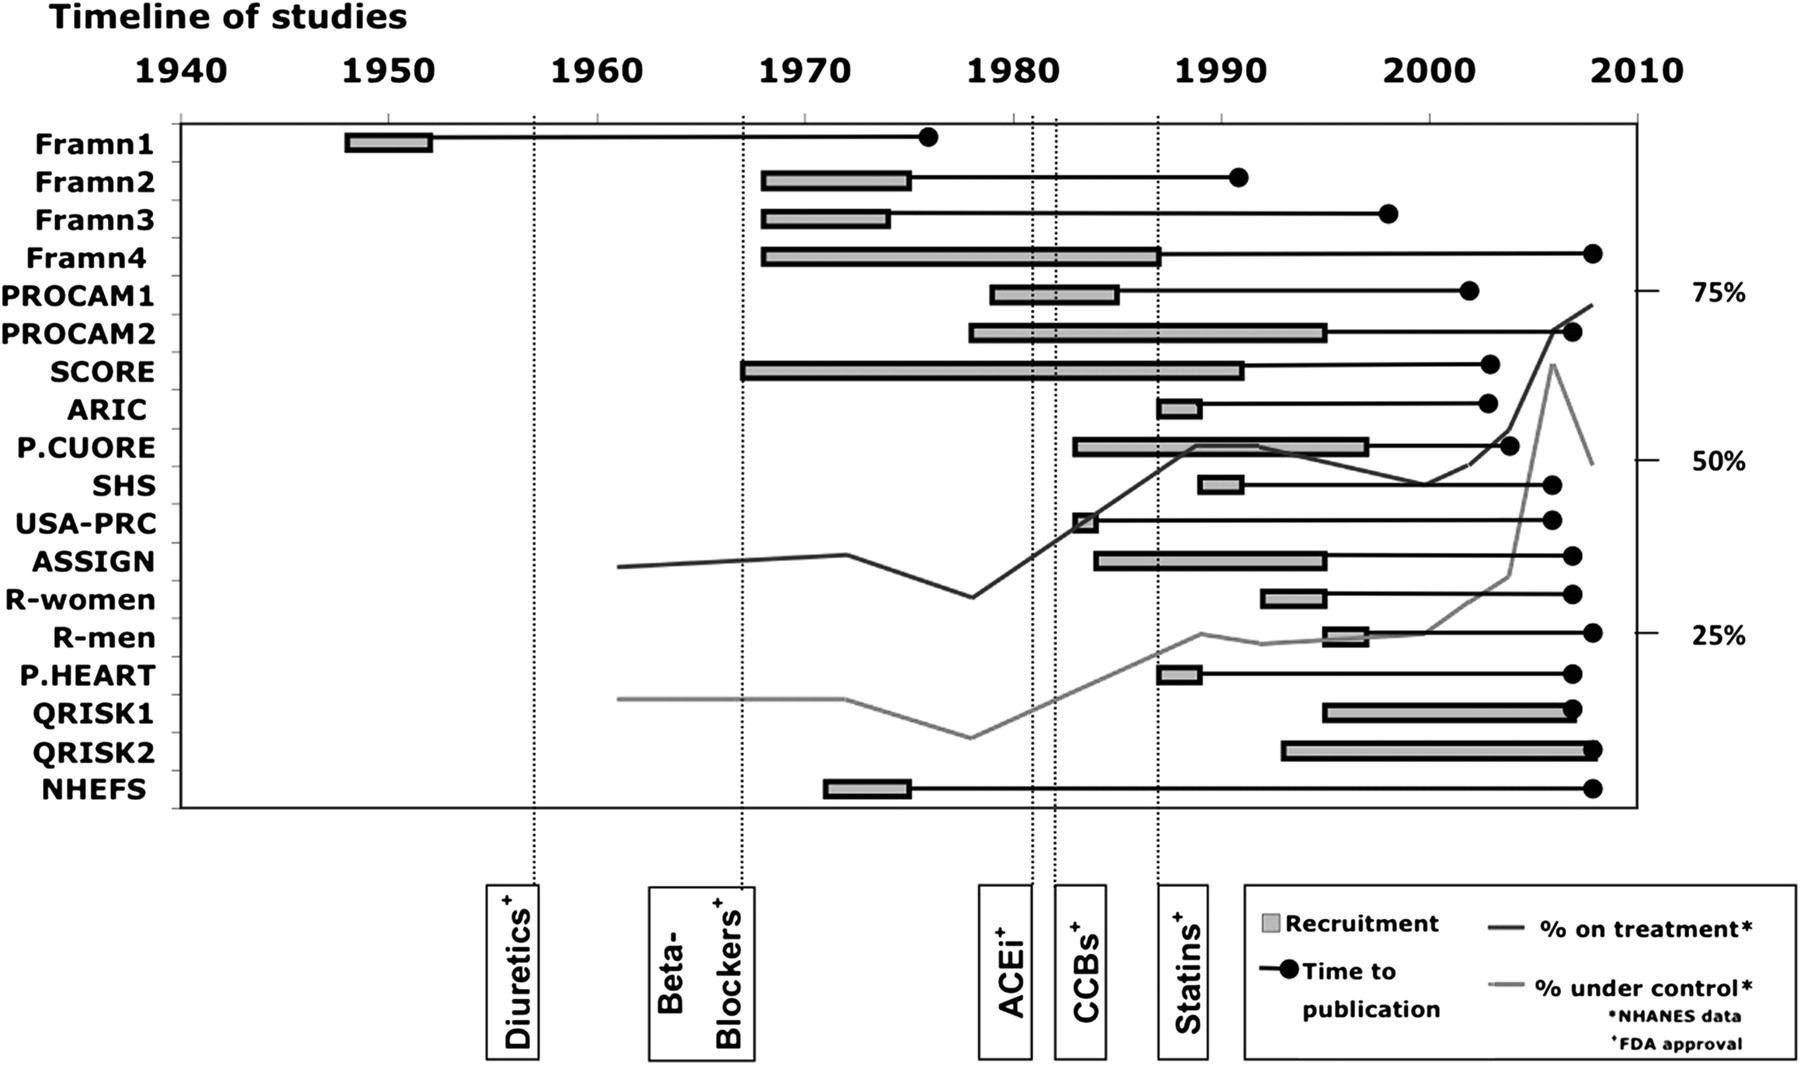
Figure 2 shows a timeline chart of the reviewed cohort studies and the introduction of several drugs.13 14

Timeline of studies.
Analytical methods
Table 2 compares the analytical methods of the reviewed risk scores.
Analytical methods
The areas in which most of the risk equations did poorly were: (1) reporting loss to follow-up; (2) percentage of missing values; and (3) blind assessment of outcomes.
Risk predictors and their definitions
The final number of risk predictors ranged from five (PROCAM stroke) to 15 in QRISK 2 (table 3). Selection of predictors was mostly by significance testing (table 2). All scores included age, gender, blood pressure and smoking, and most included lipids and diabetes. Lipid levels were not used in the non-laboratory model of the 2008 Framingham risk score, the PROCAM 2007 risk equation for stroke, or the NHEFS risk score. Diabetes, glucose intolerance or HbA1c level was a predictor for all except the European SCORE. Other risk predictors included by some scores were left ventricular hypertrophy, antihypertensive medication use, body mass index, ethnicity, family history, socioeconomic status, medical diseases, biomarkers (hsCRP and albuminuria) and physical activity.
Predictors
Definitions for risk predictors differed from score to score. In the original Framingham cohort, diabetes was defined as a random blood glucose measurement ≥150 mg/dl (8.3 mmol/l) or treatment with insulin or oral hypoglycaemics. In the Framingham Offspring cohort, this definition was broadened to a fasting plasma glucose level ≥140 mg/dl (7.7 mmol/l) or treatment requirement.18 This in turn differs from the current definition used by the World Health Organization (WHO) of fasting plasma glucose ≥126 mg/dl (7.0 mmol/l).31 Hence, patients with fasting plasma glucose between 126 and 150 mg/dl (7–8.3 mmol/l) would be classed as non-diabetics by the first Framingham score. Systolic blood pressure measurement methods included averages taken from two readings (Framingham, Progetto CUORE, ASSIGN), average of last two of three readings (ARIC, SHS, NHEFS), average of three readings (USA-PRC) and second reading taken from two readings (PROCAM). For some scores, the measurement method was ill defined: self-report (Reynolds Study), general practitioner record (QRISK studies) or a previous diagnosis of hypertension (Personal HEART), to not being stated (SCORE).
Outcomes predicted
The outcomes predicted differ widely between the risk scores (table 4), ranging from general cardiovascular risk to specific disease outcomes. Almost all scores predict myocardial infarction and death from coronary heart disease. Only 12 of the 21 scores included cerebrovascular events. SCORE only predicts fatal cardiovascular events.
Outcomes
Methods to assess outcome events also differed. The SCORE and ASSIGN scores used hard outcomes with diagnostic codes such as ICD 9/10 codes. ‘Hard outcomes’ can be defined as irrevocable events32 that have permanent consequences, such as myocardial infarction and death, as opposed to ‘soft events’, such as hospitalisation for angina. The Framingham studies included a broader composite of hard and soft end points. Diagnostic criteria for outcomes in Progetto CUORE and the USA-PRC cohorts followed the WHO-MONICA Study (WHO–MONItoring trends and determinants in CArdiovascular disease project).28 30 Expert panels reviewed medical records and hospital notes in the Framingham studies, PROCAM scores, ARIC, SHS, Reynolds studies and the NHEFS. QRISK1 and 2 used general practice electronic recorded diagnosis or death certificates linked to the computer system.
Adjustment for treatment effects
Methods used to adjust for the effect of medication were absent or weak (table 5). The effect of treatment is not fully assessed or adjusted for by any of the reviewed risk scores. Treatment effect includes (1) that which occurs by risk factor modification (eg, blood pressure-lowering medication), (2) that which works independently of risk factors (eg, platelet inhibitors such as aspirin), and (3) that which works by both means (eg, statins). Twelve of the cardiovascular risk score studies (Framingham 1998, Framingham 2008, ARIC, Progetto CUORE, SHS, USA-PRC, Reynolds 2007, Reynolds 2008, Personal Heart, QRISK1, QRISK2, and NHEFS) reported data on prior treatment, but this was mainly limited to antihypertensive treatment. Only seven (Framingham 2008, ARIC, Progetto CUORE, SHS, QRISK1, QRISK2 and NHEFS) included the use of antihypertensive drugs as a risk predictor. The Reynolds studies were the only ones to report prior use of lipid-lowering agents. None of the studies reported on the prior use of platelet inhibitors.
Treatment effect
Two treatment effects need to be considered: (1) prior treatment (started before enrolment in the study) and (2) subsequent treatment started during study follow-up (treatment drop-ins). None of the risk scores addressed the effect of treatment drop-ins. For early studies, such as the older Framingham Study, this may be minimal. Recent cohorts such as QRISK may have had more than half of their study population receiving treatment with their blood pressure under control (see NHANES data33–37 in figure 2).
Discussion
For users of cardiovascular risk scores, this review has two main findings: that cardiovascular risk scores differ considerably in terms of population, predictors and outcomes, which may not match those used by clinicians, and that treatment ‘drop-in’ is poorly accounted for by most rules.
Whichever risk equation they choose, clinicians should know which outcomes are predicted. As the outcomes predicted differ significantly, the risk scores are not interchangeable. For example, the Framingham risk scores predict a broad range of cardiovascular events (including cerebrovascular events), whereas SCORE only predicts fatal cardiovascular events. The Framingham Study risk scores have been criticised for the inclusion of ‘soft’ (subjective) outcomes such as angina,10 although the Framingham investigators argue that such outcomes estimate the total cardiovascular disease burden19 and are clinically important to both patient and doctor. Revascularisation interventions may also be criticised as being subjective.
Time is a major obstacle to the use of risk scores by physicians4; obtaining more information from a patient will further decrease the use of risk calculators. Of the risk scores, QRISK2 had the most predictors, which included disease conditions such as atrial fibrillation and chronic renal disease. QRISK2 score is designed to use data in the patient's electronic health record, with imputed values for missing data. However, the proportion with missing data for these factors in the derivation cohorts was substantial (>70% for ethnicity; >60% for cholesterol).23
The second limitation is that the effect of treatment has not been considered fully by any of the reviewed risk scores. Treatment decreases the true effect of risk factors on outcomes,38 39 as illustrated by figure 3. The combined effects of risk reduction due to treatment can be as much as 50%.40 If 25% of the population started treatment during follow-up, it would mean a population risk reduction of 12.5%. But this would be greater in the high-risk groups, who are more likely to be treated. These differences are similar to those found between QRISK 2 and Framingham (11.6%), which was obtained in a recent validation study of QRISK 2.41

True effect of risk factor on outcome.
Ideally, a cardiovascular risk score to determine the risk of a cardiovascular event and to stratify patients for risk factor modification should be derived in a population receiving no treatment at the start of and during the study. Such an ideal study is not tenable or ethical. We know of three possible solutions. First, we could favour the use of older studies, when less aggressive treatment occurred. Second, treatment uptake could be monitored and appropriate adjustments such as the application of a penalised Cox model made to account for the effect of treatment.42 Until such studies have been performed, study cohorts where there is minimal treatment drop-in during follow-up should be preferred. Alternatively, to minimise treatment drop-in, we could study cohorts with much larger numbers over much shorter periods (Rod Jackson, personal communication).
We have not addressed how risk scores may change over time. However, a common misconception is that the strength of the risk scores change with population health status. Changes in the prevalence of a risk factor should not change the underlying relationship of a risk predictor to a disease outcome. For example, lower rates of smoking will not change the RR reduction due to smoking. Study participants may have changed their risk behaviour—for example, stopped smoking during the study. However, that is another treatment effect and should ideally be measured.
The lack of accounting for treatment makes the use of most cardiovascular risk scores for treatment decisions problematic. We need to examine how doctors use cardiovascular risk scores in clinical practice. If the aim is to discuss with patients the risk of remaining untreated, then the use of the majority of these risk scores would be incorrect.
Strengths and weaknesses of the study
The review was limited to studies in which participants had no previous history of cardiovascular disease and excluded those who were restricted to a disease condition. A prior diagnosis of cardiovascular disease or a disease such as diabetes raises the patient into the high-risk category, removing the need for risk scoring. This has also been advocated by the NICE guidelines, which states that risk equations should not be used for those with a previous history of cardiovascular disease or other high-risk diseases such as diabetes.1 Furthermore, the majority of these patients would have received treatment, potentially altering study outcomes.
This is a detailed review with a clear and focused question and explicit methodology. The review is particularly relevant to the recent modification of the NICE guidelines and offers the most up-to-date comparison of available cardiovascular risk scores. It has also identified a major gap in risk assessment studies, namely, the effect of treatment.
Strengths and weaknesses in relation to other studies, discussing particularly any differences in results
The 2005 review by Beswick et al43 included in the appendix of the NICE guidelines identified 110 studies, with 70 meant specifically for application in primary prevention. The difference in the number of studies identified is due to their wider inclusion criteria, which included studies restricted to a disease condition, studies that had participants with prior cardiovascular disease, studies that were recalibrations or modifications of the original cohort study, studies that did not use absolute risk scoring, and studies where the duration of prediction was not specified. More recent studies such as QRISK and Reynolds scores are not included, as their search concluded in April 2005.
Meaning of the study: possible mechanisms and implications for clinicians or policymakers
The recent change in the NICE guidelines has major implications for clinical practice. Selecting an appropriate risk score is likely to be difficult because of the wide variation in available risk scores. This review has attempted to address the problem by comparing features of all the cardiovascular risk scores.
Unanswered questions and future research
This review did not address the effectiveness or accuracy of the cardiovascular risk scores, which would require a review of validation studies instead of the original cohort studies. The reviews by Beswick et al and Brindle et al44 have tried to assess this, but do not include the more recent studies. However, it should be pointed out that any validation study of risk scores might also suffer the same problem of treatment drop-in, which would attenuate the true cardiovascular risk. Researchers should also attempt to address the effect of treatment in future studies in this field by collecting data on treatment at the start and during the course of cohort studies, as this will impact on the final outcomes.
Authors' conclusions
Implications
These results show that there are substantial differences in the available cardiovascular risk scores in terms of study characteristics, predictors and outcomes. The effect of treatment on the study population has not been taken into account by these cohort studies. Further study is required for the translation of such research into clinical practice.
References
Footnotes
Funding This study was funded in part by the NHMRC Project Grant 511217 and Prof Glasziou's NIHR Fellowship.
Competing interests None.
Provenance and peer review Not commissioned; internally peer reviewed.