Article Text

Abstract
Introduction Physician global assessments of disease activity (medical doctor (MD) globals) are important outcomes. MD globals may vary based on their age, gender, practice setting and experience (number of patients seen per year and years in practice).
Methods We determined the variability of MD globals, surveying rheumatologists from the Canadian Rheumatology Association using rheumatoid arthiritis (RA) cases rated by MD for disease activity from 0 to 10. Cases were developed to span the spectrum of disease activity. Kappa, intraclass correlation (ICC) coefficients and linear mixed models were used.
Results 109 responded to the survey (approximately 30% response). The range of MD globals for the same scenario was as high as 7.6 out of 10, indicating vast discrepancies between physicians. Some scenarios outlined changes in individual patients; however, physicians surveyed were often in disagreement as to how much the patient recovered or worsened but the direction was the same (ie, if better all agreed). When physician-related factors were analysed separately, MD global scores were significantly influenced by age and experience (ranked by a physician, number of patients seen per year and years in clinical practice) in linear mixed models. Multivariate analysis revealed borderline significance for two age categories (56–65 years, P=0.049; over 65 years, P=0.058) and those who have seen 600–800 patients per year (P=0.056).
Conclusions This emphasises the need to establish evaluation criteria in RA for disease. Perhaps, a catalogue of patient scenarios that range from 0 to 10 could be developed, standardised and agreed on to decrease the wide variability of ranking by rheumatologists.
- rheumatoid arthritis
- outcomes research
- disease activity
This is an Open Access article distributed in accordance with the Creative Commons Attribution Non Commercial (CC BY-NC 4.0) license, which permits others to distribute, remix, adapt, build upon this work non-commercially, and license their derivative works on different terms, provided the original work is properly cited and the use is non-commercial. See: http://creativecommons.org/licenses/by-nc/4.0/
Statistics from Altmetric.com
Key messages
What is already known about this subject?
We use a physician global assessment in routine care monitoring patients with rheumatoid arthritis (RA) (using Clinical Disease Activity Index, Simple Disease Activity Index) and in trials.
Variability between physician global ratings is not known.
What does this study add?
There is very wide variability between rheumatologists with respect to their medical doctor (MD) global ratings of patient with RA cases which is dependent on experience and age, but not gender or type of practice.
MD global agreement between physicians is moderate, but the change in a patient over time has slightly better agreement.
Rheumatologists lack agreement as to how they rank global assessments of disease activity in RA especially in moderate disease.
How might this impact on clinical practice?
To better standardise physician rated disease activity in RA, consensus scores of MD global ratings are needed. There is diversity on who is in low disease state if MD globals are so varied.
Introduction
Assessments of disease activity in rheumatoid arthritis (RA) are important in determining treatment plans and patient response to treatment. Along with counts of swollen and tender joints, acute phase reactants, patient global assessments, function and pain, physician global assessments of disease activity (medical doctor (MD) globals) play an important role in current assessments of disease activity.1 2 They are key in determining both Clinical Disease Activity Index (CDAI) and Simple Disease Activity Index (SDAI)3 composite scores.3 4 While multiple factors are used for assessing MD global disease activity, the variability of MD globals may cause different responses in clinical trials. Some may overrate and others underrate disease activity due to a lack of training for disease activity assessment in clinical trials. Training currently exists for patients with systemic lupus erythematosus (SLE) whereby physicians are trained to score patients according to the SLE Disease Activity Index (SLEDAI) and British Isles Lupus Activity Group (BILAG)5 6 and MD global assessments with practice cases (from personal experience with SLE and RA trials). MD globals measure different outcomes than patient global assessments and are often discordant to patient evaluations in usual RA care.7 We wanted to determine what the variability in MD globals was between physicians and if it was influenced by one or more physician factors (age, gender, practice setting, experience, number of patients with RA seen per year, self-ranking of RA expertise) and years in practice. We expected MD global assessments to be lower as physician experience increased. Once a physician has been in practice, a long time he or she would have seen more severe cases. Their experiences with more severe patients would potentially lessen their perceived MD global score for less active patients relative to MD globals of less experienced rheumatologists.
Methods
Questionnaire design
Participating physicians were presented with scenarios of a patient with RA where each evaluated MD global for disease activity. We asked for each question: What is your (MD) global assessment.
From 0 to 10, where 0 was no disease activity and 10 most active disease activity.
The questionnaire provided 42 scenarios (fictional but realistic patient scenarios). Most scenarios described one point in time, while others presented patients who returned with a follow-up visit (such as improving, flaring or remaining the same). The cases covered a range of disease activity, in order to determine extreme cases and more intermediate cases and potentially have ratings distributed over the spectrum of the disease activity scale.
Inclusion criteria for participating physicians
In exchange for completing the 15-minute survey, participating physicians were rewarded with a US$10 Starbucks card. Physician responses were included if they completed all or part of the questionnaire. The questionnaire was approved to be sent to members of the Canadian Rheumatology Association (including rheumatology residents) and it was sent with a letter of information and an electronic link to Google Forms for the survey to be completed. It was optional at the end of the survey to include an email and receive a US$10 Starbucks gift card for participating. The survey link was emailed twice to the membership. Paediatric rheumatologists and those who did not treat adult patients with RA were excluded from completing the questionnaire.
Statistical analysis
Participating physicians were separated into the following six categories: age (categorical: <35 years, 36–45 years, 46–55 years, 56–65 years, >65 years), sex (male/female), practice setting (categorical: community, university or other), number of patients with RA seen per year (categorical: <200, 200–400, 400–600, 600–800, 800–1000,>1000), self-ranked expertise (continuous) and year of graduation (continuous) (table 1). Their responses were analysed in each category to see if any one metric significantly affected their assessments.
Demographics of the physicians who participated in the study (n=109)
Descriptive statistics such as means, SD, proportions with their 95% CI were performed. Analysis of variance (ANOVA) with Tukey’s honest significant difference test, correlations and Fleiss Kappa8 statistics were used to compare the data using Microsoft Excel and SPSS; Pearson correlation coefficient and ANOVA were used to explore associations between doctor-related factors. Reliability was assessed by comparing scores for case scenarios obtained by each rater using the intraclass correlation coefficient (ICC) between (inter) raters. The scores were analysed using the two-way random single measures with absolute agreement ICC with 95% CIs. Values for ICC measures were interpreted using the guidelines of Portney and Watkins,9 where less than 0.50 represents poor reliability, 0.50–0.75 represents moderate reliability and greater than 0.75 suggests good reliability. For ICC analysis, missing data was replaced by using the Expectation Maximisation Technique, SPSS Missing Values Analysis for 109 raters. Additionally, we analysed the inter-rater reliability between the raters who completed the questionnaire that did not require imputing missing values. Mixed models (random effect models) in SPSS were used to determine whether doctor-related factors (age, gender, experience, number of patients with RA seen per year, year of graduation and practice setting) were associated with MD global scores for case scenarios. The scores were handled as dependent variables and scenario and raters/doctors as crossed random effects. The doctor-related factors were included one at a time to analyse the possible effect of each of them (univariate analysis) and then all factors at the same time (multivariate analysis). Missing data were not imputed for mixed models. SPSS V.25.0 and Stata V.13 were used to conduct the statistical analyses.
Results
Responses by category
We received 109 responses from eligible physicians spanning the above categories (approximately 30% response rate of eligible rheumatologists). Sixty-seven per cent of surveys were returned with all questions completed and the remainder were incomplete as some raters said the questionnaire was too long. The percentages of missing scores for each case scenario are summarised (online Supplementary table). Most physicians (85%) indicated having higher than average experience in the treatment of RA (4 and 5 out of five scores) and 83 doctors saw more than 200 patients with RA annually (table 2). Half of respondents completed training after 1997 (51%) and half worked in a university setting (54%). The mean number of years in clinical practice was 20±13 years, median 19 years, ranged from 0 (still in training) to 52 years.
Supplementary file 1
Univariate analysis
We found strong associations between experience ranked by a physician and age (r=0.552, P=0.0001), number of patients seen a year (r=0.347, P=0.0001), year of graduation (r=−0.494, P=0.0001) and men had more experience (P=0.015). The latter is likely explained by the fact that male physicians were older (P=0.0001), were in practice for longer (P=0.001) and saw a higher number of patients with RA per year (P=0.022). Physicians who worked at a community setting also saw more patients with RA per year (P=0.031).
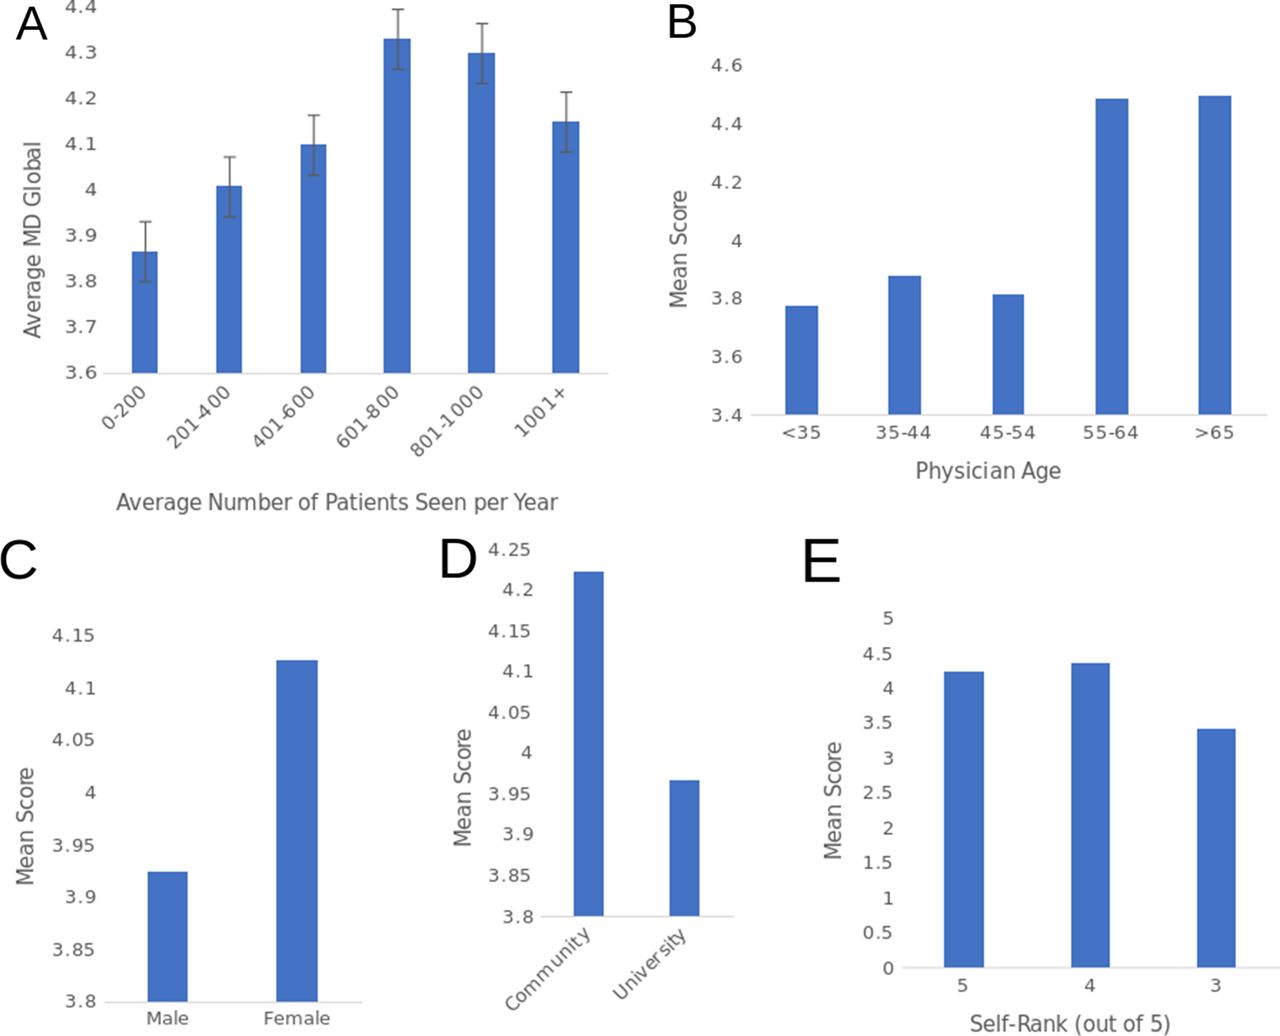
Mean MD global assessments were not significantly different between physicians in any category (figure 1); however, physicians who ranked themselves more highly in expertise tended to rank disease activity higher, but not significantly (P=0.064) (figure 1E).

Mean MD global response by rheumatologist characteristics. (A) Number of patients with RA seen per year, (B) physician’s age, (C) physician’s gender, (D) practice setting (community or university), and (E) expertise self-rank where five has the most experience and one has the least.
Physician’s age and the factors indicative of experience significantly influenced the scores when the variables were analysed in the mixed random effects model that includes both case scenarios and physician characteristics. Higher experience (ranked by the physician, years in practice and number of patients seen per year) and older age were associated with higher scores whereas gender, practice setting, complete/incomplete questionnaires were not associated with the MD global assessments (table 2).
The final linear mixed model with all significant factors (experience, age, years in practice, number of patients seen per year) revealed that only age over 56 years and number of patients between 600 and 800 seen per year had an impact on the scores, but results were borderline significant (table 3).
Multivariate analysis
Range of responses for individual questions
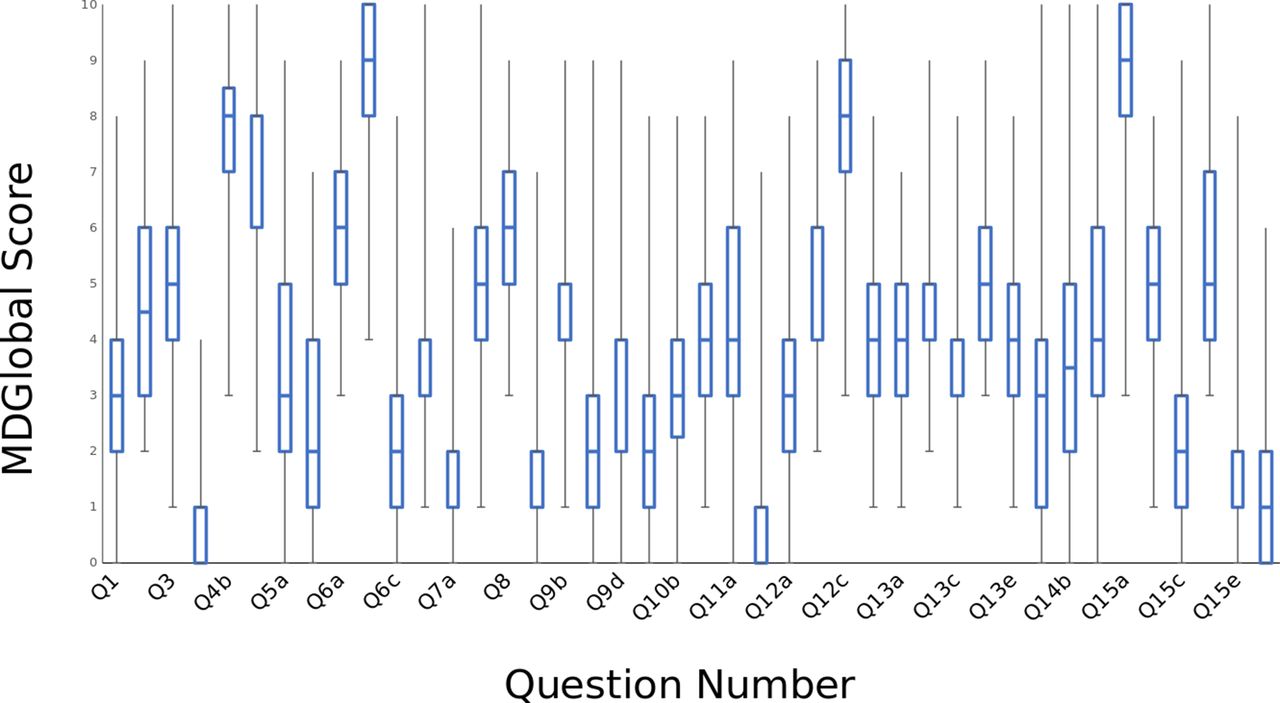
Ranges of answers for each individual question were evaluated. The average range for their answers was 7 out of a possible 10 with an average SD of each answer was 1.7. The average Q1–Q3 IQR was 3 and overall Fleiss Kappa was 1.16×10⁻³ (indicating poor to slight agreement for many case scenarios) (figure 2). Mean kappa for new questions was 1.16×10⁻³, whereas for change scenarios, it was 2.513×10⁻³ (only slightly numerically better for changes in diseases activity). Answers were individually evaluated to ensure the questionnaire was not filled out in reverse (to ensure physicians did not rank a benign case a 10 and a severe case a 0) and everyone completed the questionnaire properly as when a scenario had more than one time point that a patient was evaluated (and they either got better or worse), everyone completed the change in their scores in the same direction (ie, if better, all agreed and if worse all agreed with an appropriate change in the MD global rating).

Box plot of physician MD globals as answered per question. The average range of answers was 7.6 per question, with average quartile 1 to quartile 3 ranges of three points. Bars are all the answers to each question. Questions that respond to the same patient have the same number with a different subsequent letter.
Conclusions and discussion
This research emphasises the need to establish criteria in RA for MD disease activity assessments, particularly if remission and low disease activity are used clinically in composite scores such as the CDAI or SDAI.
The physician agreement was highest in the extreme scenarios (very low or very high disease activity, but in the spectrum in between, agreement was poor). Some scenarios outlined changes in individual patients; however, physicians surveyed were often in disagreement as to how much the patient recovered or worsened (ie, wide variations in the amount of change of global assessments at a subsequent time point). However, the change in MD globals between one time and the next had better agreement than the actual scores (ie, most agreed that a patient had worsened or improved).
A limitation of the current study is that we do not know if there would be better physician agreement if there was some form of standardisation or training with consensus prior to completing the cases. A catalogue of patient scenarios that range from 0 to 10 could be developed with corresponding MD global ratings developing consensus scores. This work could standardise MD global assessments to decrease the variability of ranking by rheumatologists with implications in both clinical trials and clinical practice. Treating to a target should include a low MD global assessment of disease activity but maintenance of medications may be difficult with lacking consensus of disease activity. Quality indicators will vary if the same patient would be rated with far more disease activity by one rheumatologist compared with another.
Acknowledgments
Tatiana Nevskaya helped with statistical analyses.
Footnotes
Contributors Both authors designed, analysed and wrote the paper. MT obtained ethics approval.
Competing interests None declared.
Ethics approval This study was approved by Canadian Shield Ethics Review Board #16-08-006.
Provenance and peer review Not commissioned; externally peer reviewed.
Data sharing statement No additional data are available.