

Abstract
Objective. To compare the psychometric functioning of multidimensional disease-specific, multiitem generic, and single-item measures of fatigue in patients with rheumatoid arthritis (RA).
Methods. Confirmatory factor analysis (CFA) and longitudinal item response theory (IRT) modeling were used to evaluate the measurement structure and local reliability of the Bristol RA Fatigue Multi-Dimensional Questionnaire (BRAF-MDQ), the Medical Outcomes Study Short Form-36 (SF-36) vitality scale, and the BRAF Numerical Rating Scales (BRAF-NRS) in a sample of 588 patients with RA.
Results. A 1-factor CFA model yielded a similar fit to a 5-factor model with subscale-specific dimensions, and the items from the different instruments adequately fit the IRT model, suggesting essential unidimensionality in measurement. The SF-36 vitality scale outperformed the BRAF-MDQ at lower levels of fatigue, but was less precise at moderate to higher levels of fatigue. At these levels of fatigue, the living, cognition, and emotion subscales of the BRAF-MDQ provide additional precision. The BRAF-NRS showed a limited measurement range with its highest precision centered on average levels of fatigue.
Conclusion. The different instruments appear to access a common underlying domain of fatigue severity, but differ considerably in their measurement precision along the continuum. The SF-36 vitality scale can be used to measure fatigue severity in samples with relatively mild fatigue. For samples expected to have higher levels of fatigue, the multidimensional BRAF-MDQ appears to be a better choice. The BRAF-NRS are not recommended if precise assessment is required, for instance in longitudinal settings.
Rheumatoid arthritis (RA) is frequently associated with fatigue; clinically relevant fatigue is estimated to be experienced by about 40% of patients1. Depending on their disease status, patients rate the effect of fatigue on their day-to-day functioning about equal to that of pain and physical disability2. RA fatigue is receiving increased attention and is now recommended as an important patient-reported outcome domain that should be assessed alongside the core outcome domains in all RA studies3,4.
However, no consensus has yet been reached on how patient-reported fatigue should be measured in RA. A variety of more or less generic measures are being used, although most have not yet been adequately validated for RA5,6. Moreover, the advantages of using disease-specific versus generic measures, or of multiitem, multidimensional instruments versus single-item measures are unclear. Wolfe, for example, suggested that scoring different components of fatigue does not appear to offer much additional useful information and that a single-item visual analog scale (VAS) performs as well as, or better than, lengthy, multiitem instruments in terms of reliability and sensitivity to change7. More recently, a series of qualitative studies have suggested that RA fatigue is a multifactorial experience that may be different from fatigue in other chronic conditions, and that RA-specific questionnaires are needed to fully and precisely identify fatigue8,9,10,11. This has led to the development of the Bristol RA Fatigue Multidimensional Questionnaire (BRAF-MDQ) and numerical rating scales (BRAF-NRS)12, and a multidimensional computer adaptive test, all of which aim to evaluate several of the dimensions of fatigue that are typically experienced by patients with RA.
These new instruments are likely to have high content validity for fatigue in RA because they incorporate the different aspects of fatigue that were mentioned by patients in qualitative studies. From a psychometric perspective, however, it is unclear whether these aspects of fatigue constitute distinct dimensions or whether they are facets of a single underlying dimension of fatigue severity that could appropriately be expressed as a single score.
The objectives of our current study were to further explore the measurement structure and local reliability of a multidimensional disease-specific, a multiitem generic, and several single-item measures of fatigue commonly used in patients with RA. To evaluate whether the instruments and subscales essentially measure the same underlying trait of fatigue severity, the measurement structure of the ensemble of instruments was rigorously evaluated using confirmatory factor analyses (CFA) and item response theory (IRT) analyses. Additionally, the local measurement precision of the various instruments was further explored in the framework of IRT.
MATERIALS AND METHODS
Patients
Baseline and 3-month followup data were selected for analysis from the first 588 patients in an ongoing study evaluating the possibility of discontinuing anti-tumor necrosis factor treatment in patients with low disease activity. Fatigue measures were included as secondary outcomes. At baseline, all patients fulfilled the 1987 American College of Rheumatology criteria for the diagnosis of RA and had a Disease Activity Score in 28 joints < 3.2 for at least the last 6 months.
Measures
The BRAF-MDQ is a disease-specific, 20-item questionnaire covering domains of physical fatigue (4 items), living (7 items), cognition (5 items), and emotion (4 items)12. Subscale items are summed to produce scores for physical fatigue, living with fatigue, cognitive fatigue, and emotional fatigue. Additionally, a total score can be obtained by the summation of all 20 items, yielding a score between 0 and 70, with higher values reflecting greater fatigue severity. The content of the questionnaire was derived from qualitative studies in patients with RA and is therefore considered to reflect relevant aspects of RA-related fatigue. The BRAF-MDQ was found to have adequate criterion and construct validity12.
The Medical Outcomes Study Short Form-36 (SF-36) health survey is a generic instrument for measuring 8 aspects of health-related quality of life and has been validated in general and disease-specific populations, including RA13,14. Its vitality scale consists of 4 items measuring energy/fatigue levels over the past week on a 5-point response scale from 1 (all of the time) to 5 (none of the time). Scores on the vitality scale items are summed and linearly transformed to range between 0 and 100, with higher scores indicating less fatigue13.
The BRAF-NRS consist of 3 standardized single-item rating scales for measuring fatigue severity, effect on life, and coping ability12. All 3 aspects of fatigue are measured using 0–10 NRS, with higher scores on the severity and effect scales indicating greater severity and higher scores on the coping scale reflecting less severity.
Disease activity was measured using a tender joint count of 28 joints (TJC28) and the erythrocyte sedimentation rate (ESR). Patient-reported pain, well-being, and disease activity were assessed using VAS ranging from 0–100 with higher scores indicating worse health.
Statistical analysis
Preceding the IRT analysis, CFA was performed to evaluate the dimensional structure of the BRAF-MDQ and SF-36 vitality scale. First, a 1-factor model was specified using weighted least squares estimation with robust standard errors, and mean and variance adjusted chi-square statistics. We compared the relative fit of the model with that of a model with 5 factors, representing the SF-36 vitality scale and the 4 subscales of the BRAF-MDQ. CFA analysis was performed with Mplus. Overall fit of the models was evaluated using commonly accepted cutoff points of the fit indices provided by Mplus15,16.
IRT analyses were performed with the MIRT software package17, using the generalized partial credit model (GPCM) as the basic IRT model18. The GPCM is an IRT model suitable for ordered polytomous data. The marginal maximum likelihood estimation procedure was used and the latent fatigue levels of patients were estimated using the expected a posteriori method throughout all IRT analyses. Preceding the analyses, responses on the “exhausted” and “tired” items of the SF-36 vitality scale and the “coping” item of the BRAF-NRS were reverse-coded to achieve consistent response patterns, so that higher values on the underlying IRT metric (θ) reflect more severe fatigue in our current study. To obtain optimally stable estimates of the item characteristic functions, baseline and followup data were jointly modeled using a between-item, multidimensional generalization of the GPCM suitable for the analysis of longitudinal data19. In this model, the different timepoints were the latent dimensions, and the dependency between-item responses at different timepoints were modeled by the correlation between the dimensions. The model allowed levels of fatigue to change over time, but the item characteristic functions were constrained to be equal over time. As a result, each item is described by 1 item characteristic function and each patient was characterized by fatigue estimates for timepoint 1 (T1) and timepoint 2 (T2). The reasonability of the assumption that the item characteristic functions were the same across timepoints was investigated by evaluating the presence of longitudinal differential item functioning (DIF). DIF occurred if item responses were dependent on background variables. In this case, DIF occurred if the item characteristic functions were significantly different at both timepoints. Presence of DIF was evaluated using Lagrange multiplier (LM) statistics proposed by te Marvelde and Glas, and by evaluating absolute differences (effect sizes; ES) between average expected and average observed item scores for individuals at each timepoint19,20. As in previous studies, items were considered to display substantial DIF if the LM tests reached statistical significance (p < 0.05) and the effect size was at least 0.1021,22. Subsequently, item fit of the longitudinal IRT model was assessed using LM statistics targeted at the form of the item response curves of individual items23. Separate tests of item fit were performed for T1 and T2. The sample of patients was divided into 3 subgroups of high-scoring, average-scoring, and low-scoring individuals of about the same size based on their latent fatigue estimates, and observed average item scores were compared to those expected by the IRT model for each timepoint separately. Item fit was considered acceptable in case ES statistics were < 0.10 and p values ≥ 0.05. Overall, model fit was considered to be acceptable in the case where at least 95% of items met the criteria for acceptable fit. The second step of the IRT analysis was to evaluate the presence of DIF with respect to sex and age (median split at 62 yrs). Substantial DIF was again considered present in case the LM tests reached statistical significance (p < 0.05) and the effect size was at least 0.10. Finally, the item characteristic functions of the resulting IRT model were used to construct subscale level information functions. Information functions provide information about the measurement precision or reliability of the evaluated fatigue instruments at different levels of fatigue. Information (I) is inversely proportional to the standard error (SE) of measurement at a given level of θ:

Construct validity was evaluated by calculating Pearson correlation coefficients between the various fatigue measures and TJC28, ESR, and VAS pain, well-being, and disease activity. We hypothesized that the strongest correlations would be observed between the fatigue measures and patient-reported outcomes, and significant but weaker correlations with both measures of disease activity.
RESULTS
Patient baseline characteristics are summarized in Table 1. A total of 588 patients were included and data of 427 of those were available at the 3-month followup. Consistent with the inclusion criteria, patients had low disease activity at baseline. Rheumatoid factor was positive and evidence for erosions was present in the majority of patients. On average, patients reported low levels of fatigue according to the SF-36 vitality scale and BRAF-MDQ subscales, and high ceiling effects were observed for the BRAF-MDQ living, cognition, and emotion subscales.
Baseline characteristics.
Confirmatory factor analysis
The 1-factor CFA model showed acceptable fit according to the comparative fit index (CFI 0.98) and Tucker-Lewis index (TLI 0.98), but not according to the root mean square error of approximation (RMSEA 0.15). The fit of the 5-factor model was also acceptable according to the CFI (0.99) and TLI (0.99) fit indices, but not according to the RMSEA (0.09). Standardized factor loadings were generally high for the 1-factor model (> 0.70), except for item 1 of the SF-36 vitality scale, which had a factor loading of 0.44 in the 1-factor model and a factor loading of 0.48 in the 5-factor model. The pattern of factor loadings for the remaining items was also highly similar between the 1- and 5-factor models, with the mean difference between standardized factor loadings being 0.04 (SD 0.01). Because model fit did not substantially improve for the 5-factor CFA model compared to the 1-factor CFA model, according to both the fit indices and the standardized factor loadings and because standardized factor loadings were all > 0.40 for the 1-factor model, we concluded that the different instruments and subscales all essentially measured a common underlying dimension of fatigue severity.
IRT analysis
As expected, the analysis of longitudinal DIF revealed that no items met the criteria for substantial longitudinal DIF (all p values ≥ 0.05 and/or ES < 0.10), indicating that the item characteristic functions were not statistically different across timepoints. The results of the subsequent fit analysis of the longitudinal IRT model are summarized per timepoint in Table 2. Although particularly the first 2 items of the BRAF-MDQ physical subscale showed significant misfit according to the LM test at T1, the difference between average observed and average expected item scores (ES) was minor and none of the items had significant LM tests at both timepoints. Therefore, it was concluded that the total model adequately fit the data.
Item fit at timepoints 1 and 2 in longitudinal IRT analysis.
In the DIF analyses, again none of the items met the criteria for age-related DIF according to the LM statistics. The “mistakes” item of the BRAF-MDQ cognition subscale was the only item to show statistically significant sex bias for men according to the LM tests (LM = 12.19, p = 0.01 and LM = 6.88, p = 0.08, respectively, for timepoints 1 and 2). However, the difference between average observed and average expected scores for men was again minor (ES = 0.05). These results indicated that none of the individual items showed substantial sex- or age-related bias.
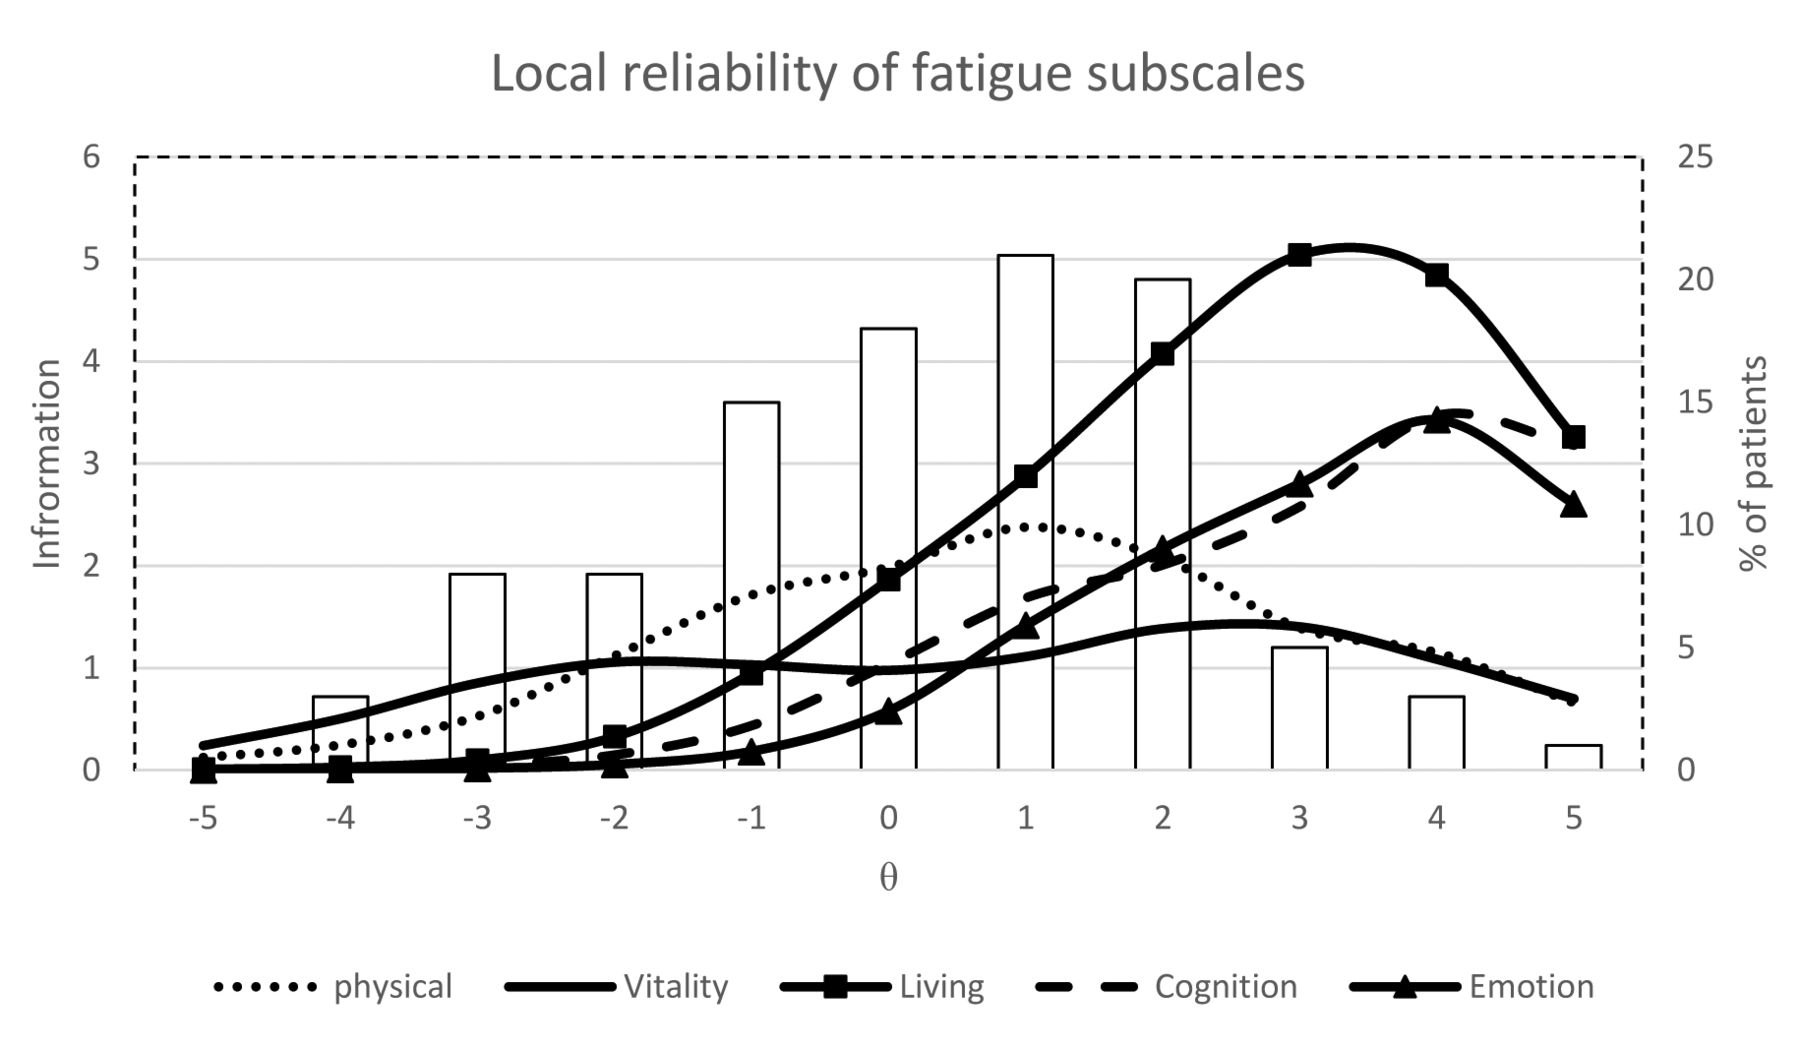
Figure 1 and Figure 2 present the information functions that indicate the measurement precision of the various subscales relative to the latent scale, as well as the distribution of the patients’ estimated levels of fatigue at baseline. Despite the low average fatigue scores for the individual subscales, a wide variety of fatigue levels were observed even at the extremes of the latent fatigue scale. The measurement precision of the BRAF-MDQ subscales and SF-36 vitality scale covered a wide range of the latent fatigue continuum (Figure 1). The SF-36 vitality scale had its highest measurement precision at low to moderate levels of fatigue, whereas the BRAF-MDQ scales differentiated better between patients with more severe fatigue. The total measurement precision was comparatively high for the living subscale of BRAF-MDQ. This likely relates to the relatively high number of items for this subscale. In contrast, the measurement precision of the BRAF-NRS for severity and effect covered only a narrow range of fatigue, and measurement precision peaked around average observed levels of fatigue (Figure 2). The coping scale had low precision across the latent metric, reflecting a poor ability to differentiate between different levels of fatigue severity, a finding reflected in a comparatively low ability to discriminate between levels of fatigue (α = 0.20) compared to the average of the other items (mean α = 1.20).

Local reliability of BRAF-MDQ and SF-36 vitality subscales in relation to latent fatigue scores. θ is IRT-based fatigue scores estimated from the ensemble of instruments and expressed on a scale ranging from −5 to 5. The mean (θ = 0) of the θ scale corresponds to the mean observed fatigue level. Information is reliability defined as the inverse square of the standard error of measurement for each level of θ [SE θ = 1 ÷ √ (I × θ)]. BRAF-MDQ: Bristol Rheumatoid Arthritis Fatigue Multi-Dimensional Questionnaire; SF-36: Medical Outcomes Study Short Form-36; IRT: item response theory.

Local reliability of BRAF-NRS. θ is IRT-based fatigue scores estimated from the ensemble of instruments and expressed on a scale ranging from −5 to 5. The mean (θ = 0) of the θ scale corresponds to the mean observed fatigue level. Information is reliability defined as the inverse square of the standard error of measurement for each level of θ [SE θ = 1 ÷ √ (I × θ)]. BRAF-NRS: Bristol Rheumatoid Arthritis Fatigue Numerical Rating Scales; IRT: item response theory.
Construct validity
The correlation of the fatigue measures with clinical and patient-reported outcomes is presented in Table 3. All fatigue measures, except NRS coping, showed a similar pattern of correlations with other measures. Low (r < 0.30) but still significant correlations were observed between all the fatigue measures and clinical measures, and moderate correlations (0.30 < r < 0.60) with other patient-reported outcomes. NRS coping was less strongly associated with all patient-reported and clinical measures, except VAS well-being.
Construct validity of fatigue measures. Values are Pearson correlation coefficients.
DISCUSSION
The objective of our study was to use state-of-the-art psychometric methods to examine the measurement structure and local measurement precision of different fatigue instruments used in patients with RA. By and large, the results suggest that the BRAF-MDQ, BRAF-NRS, and SF-36 vitality scale essentially measure a common underlying concept of fatigue severity. Researchers and clinicians interested in measuring fatigue severity in samples of patients with RA who had mild to moderate fatigue may best use the generic, multiitem SF-36 vitality scale. For samples expected to have higher levels of fatigue, we recommend the disease-specific, multidimensional BRAF-MDQ. The single-item BRAF-NRS scales appear to have a limited measurement range and are not recommended if a more precise assessment of a wide range of fatigue levels is essential, such as in intervention studies.
RA fatigue is often considered to be a multidimensional entity8,11,24. However, this is mainly based on qualitative work in which patients report on multiple aspects of their experience of fatigue8,24. Our current study used CFA-based and IRT-based methods to examine whether this multidimensionality is also reflected in the latent structure of the BRAF-MDQ and SF-36 vitality scale. The findings suggest that, from a psychometric perspective, the majority of evaluated items pertains to a common underlying dimension of fatigue severity. This was also reflected in a practically identical pattern of correlations with other measures for all evaluated instruments, except NRS coping. These results correspond closely to previous efforts where cancer-related fatigue severity was found to be essentially unidimensional25. Moreover, 2 previous studies have also found that response data from multiple fatigue instruments could be fitted to a single unidimensional IRT model26,27. One of these studies simultaneously calibrated item responses on the Functional Assessment of Chronic Illness Therapy (FACIT) Fatigue Scale, the Multidimensional Assessment of Fatigue Scale, and the SF-36 vitality scale in a sample of patients with RA26. The other study cocalibrated the FACIT and the SF-36 vitality scale in a sample of patients with systemic sclerosis27. A study on a recently developed item bank for measuring fatigue in RA, on the other hand, showed that its items represented 3 psychometrically distinct dimensions labeled as severity, impact, and variability28.
In our study, we found that the evaluated fatigue instruments essentially assess a common underlying dimension of fatigue severity. This suggested that the most reliable fatigue scores would be obtained if a combined score was calculated for all items within a specific questionnaire. Nevertheless, it is important that the various aspects of fatigue severity that patients experience be represented in a way that ensures their content validity29,30. This requires a balanced representation of the different aspects of fatigue that have been shown to be relevant to the target population in previous studies. The BRAF-MDQ was the only evaluated instrument to comprehensively assess aspects of fatigue relevant in RA. However, physical aspects and impairments in daily activities because of fatigue are weighted more heavily in the total score than emotional and cognitive aspects of fatigue.
The information functions obtained in the IRT analysis showed that patients with mild levels of fatigue experience symptoms that are best detected by the SF-36 vitality scale, whereas the BRAF-MDQ items are better suited for patients with more severe fatigue. Items related to problems in performing daily tasks as a result of fatigue discriminate best between patients with moderate levels of fatigue, and patients with severe levels of fatigue in particular experience more cognitive or emotional symptoms of fatigue. The large number of items reflecting severe fatigue in the BRAF-MDQ may result from the inclusion criteria applied in the qualitative study used to generate items, which required patients to have a fatigue score > 7 on a 10-cm VAS8,9. The item content of the BRAF-MDQ may therefore not be relevant to all patients with RA. This was underscored by the high ceiling effects on the living, cognition, and emotion subscales of the BRAF-MDQ in the current sample, with the proportion of patients achieving the best possible score far exceeding the commonly used threshold of 15%31. Therefore, the BRAF-MDQ might not be optimally suited to evaluate fatigue in patients with RA with milder levels of fatigue, especially in the setting of intervention studies where the aim is usually to measure improvement. The SF-36 vitality scale, on the other hand, covered the entire range of observed fatigue levels and did not have relevant floor or ceiling effects in the current sample. It should be noted, however, that typical patients with RA likely experience more severe fatigue than those in the current study, because all patients were in clinical remission for at least 6 months preceding our study. No substantial ceiling effects were observed for the BRAF-MDQ in a previous study32. However, the patient population of that study was characterized by very high disease burden. Interestingly, in that study, the BRAF-MDQ was found to be more responsive than the SF-36 vitality scale, which might reflect the better measurement precision of the BRAF-MDQ at higher levels of fatigue.
Given that all evaluated instruments, except NRS coping, appear to measure the same underlying dimension of fatigue severity, clinicians and researchers intending to measure fatigue in patients with RA are recommended to consider the expected range of fatigue severity levels in their patient sample when selecting an instrument. Although a single-item NRS will be least burdensome to patients, our results show that it also has limited measurement precision, particularly for patients with low or high levels of fatigue. SF-36 vitality scale is generally more appropriate for patients with mild to moderate levels of fatigue. BRAF-MDQ is the only questionnaire to specifically address aspects of fatigue that are important to patients with RA and it should be preferred when fatigue levels are moderate to high. Finally, calibrated item banks, such as the one recently developed for RA, may help achieve high measurement precision for all patients irrespective of their underlying level of fatigue. From such an item bank, short forms or computerized adaptive tests can be developed33,34. Both ensure that patients respond to questions that are more relevant to their level of fatigue and that fewer questions need to be answered by patients while retaining or surpassing the measurement precision of classical instruments35.
Fatigue in RA, like pain and global health, is also frequently measured with single-item instruments such as an NRS. Single-item fatigue instruments often correlate highly with more elaborate measures of fatigue and are responsive to change5,7. However, in previous research, they have been shown to be less reliable than multiitem tools7. As a result of the smaller number of fatigue levels distinguished by the single-item instruments in our current study compared to multiitem scales (e.g., 20 for the SF-36 vitality scale), the information functions of the BRAF-NRS scales provide less information about a patient’s level of overall fatigue. In addition, all 3 NRS provided their optimal measurement precision near the middle of the fatigue continuum. Use of only the BRAF-NRS, therefore, is not recommended for patient samples with varying levels of fatigue or in longitudinal studies aimed at capturing changes in fatigue.
The low fatigue scores observed at baseline underscore the usefulness of the longitudinal IRT analysis used in our current study, because the skewed distribution of data over the response options might have otherwise hampered the stable estimation of some of the threshold variables. The longitudinal IRT model incorporates data from both timepoints in estimating the item characteristic functions that not only raise the sample size but, provided that overall levels of fatigue change over time, improve the distribution of the data over the response options. This model is therefore very useful to model longitudinal data with relatively small sample sizes for IRT applications36 and skewed score distributions.
Fatigue is an increasingly important outcome in various clinical settings in the field of RA. Our current study suggests that the BRAF-MDQ, BRAF-NRS, and SF-36 vitality items measure a common underlying trait of fatigue severity and that the BRAF-MDQ is best targeted at patients with more severe fatigue while the SF-36 vitality scale is generally more appropriate for patients with mild to moderate levels of fatigue. The BRAF-NRS demonstrated a limited coverage of the fatigue continuum and are not recommended if precise measurement is required.
Acknowledgment
For enthusiastic cooperation we thank all patients and research nurses who took part, and particularly the Steering Committee consisting of Renée Allaart, UMC Leiden; Annelies Boonen, MUMC; Reinhard Bos, MCL; Liesbeth Brouwer, UMCG; Alfons den Broeder, SMK; Danielle Gerlag, AMC; Mieke Hazes, Erasmus UMC; Willem Lems, VUMC; Dirk-Jan van Schaardenburg, Reade; Janneke Tekstra, UMCU; Harald Vonkeman, MST; and Gerardine Willemsen from the patient society. For executing the nationwide study, we thank the DREAM cooperation presided over by Mart van de Laar and Piet van Riel.
Footnotes
-
The Poeet study is a nationwide initiative in the Netherlands on behalf of the Dutch Society of Rheumatology, financially supported by the Ministry of Health (VWS) and ZonMW.
- Accepted for publication November 19, 2014.


