

Abstract
Objective. To examine trends in annual medical expenditures from 1997 to 2005 among adults with arthritis and other rheumatic conditions (denoted Arthritis group).
Methods. We analyzed annual medical expenditures (2005 US dollars) among adults with Arthritis using the Medical Expenditure Panel Survey (MEPS), a nationally representative survey of the US civilian, noninstitutionalized population. Expenditures were stratified by Arthritis and comorbidity status.
Results. The Arthritis population increased by 22% (36.8 to 44.9 million) during this period, attributable entirely to the subpopulation with at least one comorbid condition (31.8 to 40.3 million). The overall, inflation-adjusted annual mean medical expenditures for adults with Arthritis increased from $6,848 in 1997 to $7,854 in 2005. In 1997, inpatient care was the most expensive component of overall expenditures (mean $2,702), but beginning in 2001, mean inpatient and ambulatory expenditures were almost identical. Mean prescription expenditures increased nearly every year, almost doubling from $970 in 1997 to $1,811 in 2005. Aggregate total expenditures for the Arthritis population increased markedly during this period, from $252.0 to $353.0 billion (+40%). Most of this increase was attributable to the population increase in the Arthritis and comorbid condition subgroup.
Conclusion. Mean annual ambulatory and prescription expenditures for adults with Arthritis increased far above the rate of medical inflation, offsetting a relative decline in inpatient expenditures. Increases in overall mean and aggregate total expenditures are attributable to the increasing number of adults with Arthritis and at least one comorbid chronic condition. Projected increases in this population suggest that these expenditures will continue to rise.
Arthritis is among the most common chronic diseases1, the most common cause of disability in the United States2, and the second most common group of conditions affecting health-related quality of life3. It has been projected that the prevalence of doctor-diagnosed arthritis in the US adult population will increase from 45.7 million, or 22% of the population, in 2003 to 67.0 million adults, 25% of the population, in 2030. Of those US adults with doctor-diagnosed arthritis, it is estimated that 16.8 million experienced arthritis-attributable limitation in 2003; that number is projected to increase by 49% to 25.0 million in 20304.
Recognizing the current and growing economic impact of arthritis and other rheumatic conditions (here called Arthritis), we previously reported Arthritis prevalence, direct medical expenditures among those with Arthritis, and direct and indirect expenditures attributable to Arthritis, among US adults in 19975 and 20036. We observed large increases in prescription and ambulatory care expenses from 1997 to 20036. Our current analysis was conducted to determine (1) whether rising expenditures for prescriptions and ambulatory care are responsible for the increases in the overall expenditures for individuals with Arthritis; and (2) whether increases in the size and overall medical expenses of the Arthritis population observed in our previous study were biased by the choice of years examined in that study6. This report presents updated estimates of Arthritis prevalence and medical expenditures among people with Arthritis for 1997 through 2005, describing all expenditures among people with Arthritis, rather than those specifically attributable to Arthritis5,6.
The focus of this report is trends in medical expenditures among people with Arthritis (as defined by the National Arthritis Data Workgroup7), thereby providing the rheumatology community with an essential tool for describing the ongoing public health and economic burden of Arthritis to healthcare policymakers. We also report expenditures among US adults with other and no chronic conditions to provide policymakers with a comprehensive overview of medical expenditures among all adults to demonstrate the proportional influence of Arthritis on total expenditures and guide decisions concerning resource allocation.
MATERIALS AND METHODS
Data source
We analyzed expenditures among adults using the Medical Expenditure Panel Survey (MEPS) household component, a nationally representative survey of the United States civilian, noninstitutionalized population. MEPS, a joint endeavor of the Agency for Healthcare Research and Quality and the National Center for Health Statistics, is designed to provide data on national healthcare use, medical care expenditures, and sources of payment.
MEPS collects data on healthcare use, medical care expenditures, demographic characteristics, and health status from 5 interviews over a 2-year period8,9. The presence of medical conditions is ascertained primarily by prompting household component respondents for the causes of medical events and disability episodes (i.e., time lost from work or school and days spent in bed due to illness or injury). The condition can also be reported by the respondent as “bothering” the person during the reference period. Conditions identified by one or more of these methods are then coded using the International Classifications of Diseases, ninth revision (ICD-9) system at the 3-digit level10. Expenditure data in MEPS derive from a combination of the household component interviews and information obtained from providers10. Expenditures in MEPS are defined as the actual expenditures for the medical care services used, regardless of the source of payment. Payments for over-the-counter medications and indirect payments (e.g., Medicaid Disproportionate Share and Medicare Direct Medical Education subsidies) are not included11.
The study uses 1997 to 2005 MEPS data, with each year’s sample comprising roughly 22,000 adults aged ≥ 18 years. MEPS is a continuous study with an overlapping panel design that can provide estimates that are exclusive to a calendar year. In this study, we conducted analysis using a cross-sectional approach (including application of annual cross-sectional sampling weights), which ensures that expenditures analyzed do not overlap with adjacent years.
Definition of the Arthritis Group and 2 subgroups
From our earlier work5,6, adults in each year with Arthritis were defined using the National Arthritis Data Workgroup7 definition, modified to apply to the 3-digit ICD-9 level available in the MEPS public release files (ICD-9 codes 274, 354, 390, 391, 443, 446, 710–716, 719–721, and 725–729). The Arthritis group was further stratified into 2 subgroups based on the presence of other chronic conditions: (1) Arthritis Only (adults with Arthritis and no other chronic conditions); and (2) Arthritis Plus (adults with Arthritis and one or more comorbid chronic conditions). Chronic conditions in general are defined by the protocol devised by Hoffman, et al., which was designed to provide a conservative estimate of prevalence. All of these conditions have been previously defined by NHIS as impairments, or were defined by Hoffman et al. as creating persistent health consequences lasting several years or more12. We reserve the terms “comorbid conditions” and “comorbidities” to describe the presence of additional conditions for individuals with arthritis, whereas we use the term “multimorbidity” in the context of several conditions occurring together.
General approach
We estimated annual medical care expenditures (2005 US dollars) overall and subdivided by expenditure components for the Arthritis population and its 2 subgroups. First, we estimated the mean (i.e., per person) medical care expenditures for 6 expenditure components (inpatient, ambulatory, prescription medications, home health, emergency room, and other) and overall (all 6 expenditure components combined). Then, we estimated the aggregate expenditures for the Arthritis group and its 2 subgroups by multiplying the number of persons in the group or subgroup by their overall mean expenditures. Expenditures were tabulated without regard to the extent the condition(s) characterizing each group or subgroup accounted for those expenditures, i.e., they were not specifically attributed to Arthritis or any other specific condition.
Complex survey design
Population sampling weights were applied in all analyses so that estimates could be projected to the US population. We used SAS version 9.1.3 Survey procedures (Surveyfreq and Surveymeans) to adjust standard error estimates for MEPS’s clustered sampling design13.
Statistical significance of changes over time
All estimates were not statistically different at α = 0.05 unless explicitly noted; 2 population or expenditure estimates were considered significantly different if their 95% confidence intervals did not overlap. The use of “significant” and “significantly” refer exclusively to statistical significance. In a few circumstances where confidence intervals were especially large, we evaluated the effect of removing the largest outliers as noted in the text. Average annual expenditure increases were calculated by regressing log expenditures on (year of estimate – 1997). We used the Fieller approach as described by Motulsky14 to calculate confidence intervals for ratios of 2005 estimates relative to their 1997 counterparts.
Converting annual expenditures to 2005 dollars
We used the medical care component of the Consumer Price Index15 to convert expenditures for 1997 through 2004 into 2005 dollars (selections: “Area”: US city average; “Item”: medical care; “Seasonal Adjustment” = not seasonally adjusted).
Comparative analyses
From our previous work5,6, we stratified the remaining adults without Arthritis in each year into 2 other mutually exclusive groups: (1) Other CC (non-Arthritis chronic conditions); and (2) None (no chronic conditions). As with the Arthritis group, the Other CC group was further stratified into 2 subgroups (single morbidity and multimorbidity subgroups based on the presence of comorbid conditions): (1) Other CC Only (just one non-Arthritis chronic condition) and (2) Other CC Plus (2 or more non-Arthritis chronic conditions). We also estimated annual medical care expenditures subdivided by expenditure components for these populations just as we did for Arthritis. Therefore, aggregate expenditures for the 3 groups (Arthritis, Other CC, and None) sum to the aggregate expenditures for the entire country, and the sum of subgroup aggregate expenditures is equal to the aggregate expenditures for the corresponding group.
RESULTS
Population trends
While the entire US adult population increased steadily from 196.6 to 219.5 million (12%) from 1997 to 2005, population changes differed among the Arthritis group and subgroups (Figure 1). From 1997 to 2005, the Arthritis group increased significantly (22%); the largest increase was in the Arthritis Plus subgroup (27%), with the Arthritis Only subgroup remaining relatively stable.

US adult population trends in Medical Expenditure Panel Survey (MEPS) for Arthritis by subgroups, 1997 to 2005. “Plus”: Arthritis and 1+ non-Arthritis chronic condition; “Only”: Arthritis and no other chronic condition. Population totals for Arthritis group may not equal sum of “Plus” + “Only” subgroups due to rounding. MEPS sample reflects the noninstitutionalized civilian population; analyses limited to individuals age 18 years and over.
Trends in mean overall medical expenditures
Between 1997 and 1998, the annual mean overall medical care expenditures for the Arthritis group decreased sharply from $6,848 to $6,141, but then increased steadily to $7,854 in 2005 (Figure 2), representing an average increase of $196 (2.8%) per year above medical inflation. The baseline level of expenditures and trends over time for the Arthritis group conceals important differences between its two subgroups. Mean overall health expenditures for the much smaller Arthritis Only subgroup fluctuated from 1997 through 2005, with 2003 and 2005 “peaks” resulting from a single extreme outlier in each year; when removed, the values are $1,807 (95% CI $1,405 to $2,210) in 2003 and $1,770 (95% CI $1,194 to $2,346) in 2005 (data not shown).

Annual mean overall healthcare expenditures in Medical Expenditure Panel Survey (MEPS) for the Arthritis group and subgroups, 1997 to 2005 (2005 US dollars). Overall expenditures for each individual are the sum of their component expenditures (i.e., inpatient, outpatient, office visit, home health, emergency, prescription medications, and other). “Plus”: Arthritis and 1+ non-Arthritis chronic condition; “Only”: Arthritis and no other chronic condition. MEPS sample reflects the noninstitutionalized civilian population; analyses limited to individuals age 18 years and over. * Average annual increase above medical inflation was 2.8% for “All”.
Trends in component expenditures
Annual mean medical care component expenditures for the Arthritis group are plotted in Figure 3. In 1997, inpatient care was the most expensive component, averaging $2,702 annually (95% CI $2,294 to $3,111), which was significantly higher than the next component, ambulatory care, at $1,957 (95% CI $1,774 to $2,139). By 2001, means of the inpatient and ambulatory components were almost identical ($2,193 and $2,240), with this pattern persisting through 2005. The increase in ambulatory expenses was driven in part by a significant increase in mean ambulatory visits, from 11.1 in 1997 to 12.7 in 2005 (data not shown).
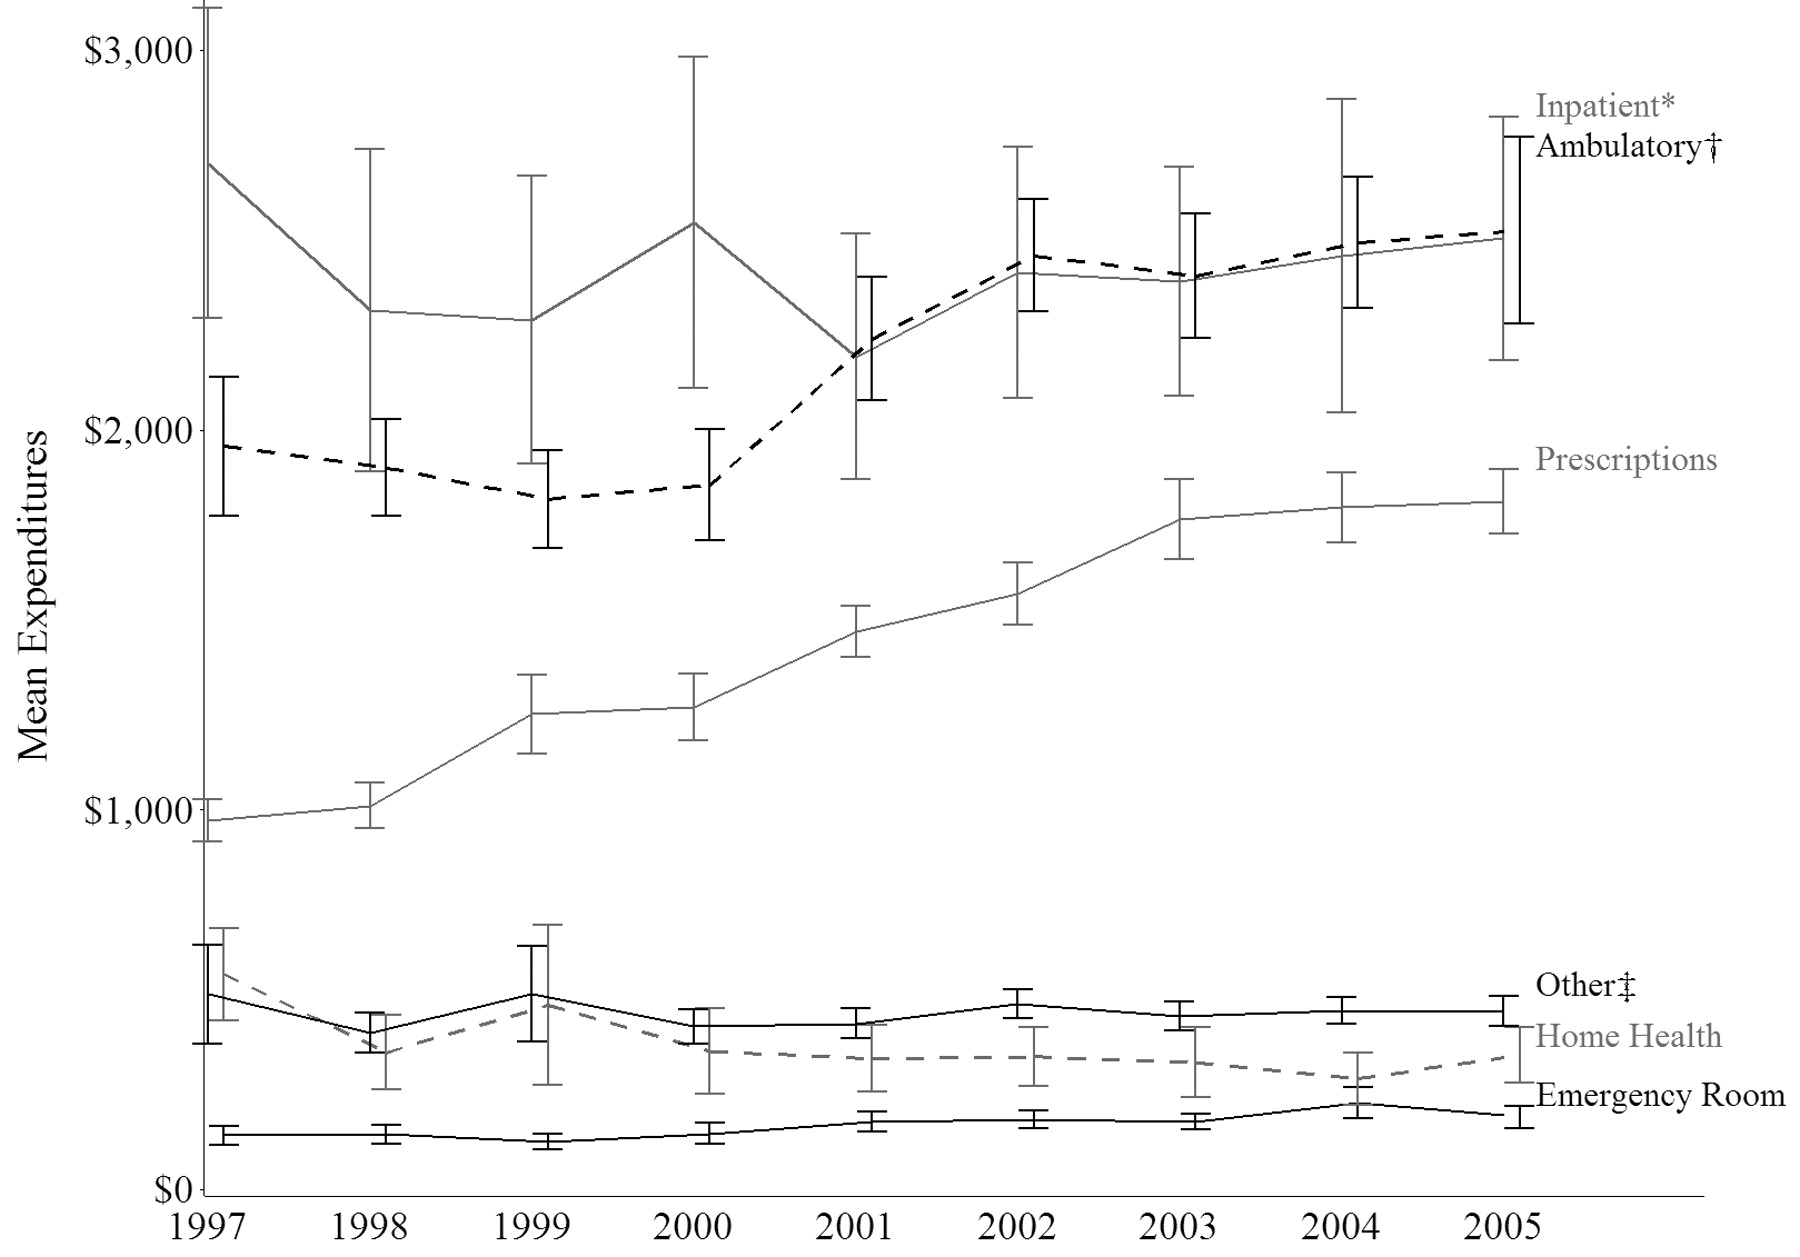
Annual mean component healthcare expenditures in Medical Expenditure Panel Survey (MEPS) for the Arthritis group, by expenditure category, 1997 to 2005 (2005 US dollars). MEPS sample reflects the noninstitutionalized civilian population; analyses limited to individuals age 18 years and over. *“Inpatient” includes facility and separately billed provider expense. †“Ambulatory” includes office and outpatient visits. ‡“Other” includes dental visits and other medical supplies and equipment.
Another important trend was the consistent annual increase in mean prescription expenditures, which resulted in a significant increase over the entire period. In 1997, prescription expenditures averaged $970 (95% CI $914 to $1,025), or 14% of overall expenditures for the Arthritis group. By 2005, prescription expenditures almost doubled to a mean of $1,811 (95% CI $1,727 to $1,896), accounting for 23% of overall expenditures.
A less marked but still significant trend was exhibited by home healthcare, which accounted for $565 or 8% of the Arthritis group total expenditures in 1997 (95% CI $444 to $687). Home healthcare expenditures decreased significantly over the period under study. In 2005, home healthcare expenditures averaged $354 (95% CI $280 to $428), or 5% of the overall healthcare expenditures that year.
Both the emergency room and “other” expenditure components exhibited year-to-year fluctuations throughout the period, resulting in nonsignificant changes from 1997 to 2005 overall. As was the case with overall expenditures, the patterns of the specific expenditure categories of the Arthritis group mirrored those of its Arthritis Plus multimorbidity subgroup (data not shown).
Drivers of prescription component expenditures
The marked increase in prescription expenditures for the Arthritis group described above resulted from increases in both the mean expenditures per prescription and the number of prescriptions filled by each individual in that group (Table 1). Mean expenditures per prescription increased from 1997 to 2005 for the Arthritis group and its subgroups. The 1997 to 2005 increases were significant for the Arthritis group and the Arthritis Plus subgroup, but not the Arthritis Only subgroup. The mean total number of prescriptions filled increased significantly and steadily from 1997 to 2005 for Arthritis and the Arthritis Plus subgroup. Among the Arthritis Only subgroup there were similar numbers of prescriptions in 1997 and 2005 (2.7 and 2.5 prescriptions per person, respectively).
Mean (95% CI) annual prescription utilization and expenditures in MEPS for the Arthritis group and 2 subgroups, 1997 to 2005. The MEPS sample reflects the noninstitutionalized civilian population; analyses limited to individuals age 18 years and over.
To determine whether the increases in mean prescription expenditures per person were attributable to increases in mean expenditures per prescription or mean total number of prescriptions, we computed ratios of the 2005 estimates relative to their 1997 counterparts for each of these 3 quantities and by subgroups; 95% CI were calculated around these ratios. The Arthritis Plus subgroup exhibited a significant 81% (95% CI 68% to 94%) increase in mean prescription expenditures per person, and also showed significant increases for mean expenditures per prescription [31% (95% CI 26% to 36%)] and mean prescriptions per person [38% (95% CI 30% to 47%)] from 1997 to 2005, indicating that both factors contributed relatively equally to the increase in mean prescription expenditures per person. The Arthritis Only subgroup did not exhibit an increase in mean prescription expenditures per person, although there was a significant increase of 49% in mean expenditures per prescription filled (95% CI 1% to 97%).
Comparative analyses — trends in Other CC and None
(Detailed population and expenditure data for Other CC and None groups are available in the technical appendix located at www.mgcdata.com/publications/trends_arthritis/appendix.pdf) The Other CC group mirrored the trends for Arthritis. Between 1997 and 2005, the size of the Other CC population increased significantly (15%), primarily as a result of an increase in the Other CC Plus subgroup (22%).
The Other CC group also exhibited a significant steady increase in annual mean overall medical care expenditures from $3,848 (95% CI $3,571 to $4,126) in 1997 to $4,629 (95% CI $4,293 to $4,965) in 2005, representing an average increase of $109 (2.6%) per year. The expenditure patterns for the 2 Other CC subgroups were similar to those for the 2 Arthritis subgroups. As was the case for Arthritis, the increase in overall expenditures for the Other CC group follows the trends of its multimorbidity subgroup (Other CC Plus) closely. Expenditures for the Other CC Only subgroup remained essentially flat across the years, with overlapping confidence intervals throughout the period.
Mean expenditures per prescription for Other CC and its subgroups increased from 1997 to 2005. The 1997 to 2005 increases were significant for Other CC and the Other CC Plus subgroup. The average total number of prescriptions filled increased significantly from 1997 to 2005 for Other CC and both its subgroups. The Other CC group and its Other CC Plus subgroup showed a consistent pattern of increasing prescription use throughout the period. Interestingly, persons in the Arthritis Plus group filled significantly more prescriptions than those in the Other CC Plus group [e.g., 29.4 (95% CI 28.3 to 30.5) for Arthritis Plus vs 19.0 (95% CI 18.2 to 19.8) for Other CC Plus in 2005], even as the number of prescriptions filled in both groups rose between 1997 and 2005.
The None group (individuals with no chronic conditions) remained relatively stable in size from 1997 to 2005, and total expenditures remained the most stable of all the groups during the period, with a small and statistically nonsignificant $40 decrease in mean overall expenditures ($774 in 1997 to $734 in 2005). With respect to prescriptions, the None group showed no real change in mean expenditures or numbers filled over the time period.
Trends in aggregate total expenditures
The estimated aggregated total expenditures, the product of mean overall medical care expenditures and total population, for the Arthritis group and its 2 subgroups, are displayed in Figure 4. Aggregate total expenditures increased markedly and steadily for the entire US population during this period, from $676.9 billion to $918.6 billion (36%). The Arthritis group experienced a marked decrease in aggregate expenditures from $252.0 billion in 1997 to $227.1 billion in 1998, followed by steady increases through 2004. Overall, the aggregate total expenditures for the Arthritis group rose by 40% during the period, resulting in $353.0 billion in expenditures in 2005. Increases in aggregate expenditures for the Arthritis group are wholly attributable to the Arthritis Plus subgroup, whose aggregate expenditures increased by $98.2 billion from 1997 to 2005 to yield aggregate expenditures of $342.7 billion in 2005. Aggregate expenditures for the Arthritis Only subgroup experienced a slight net gain from $7.5 billion in 1997 to $10.3 billion in 2005. However, the year-to-year fluctuations in the mean expenditures of this subgroup, combined with the error around the mean expenditure and population estimates, do not provide strong evidence for an increasing trend.
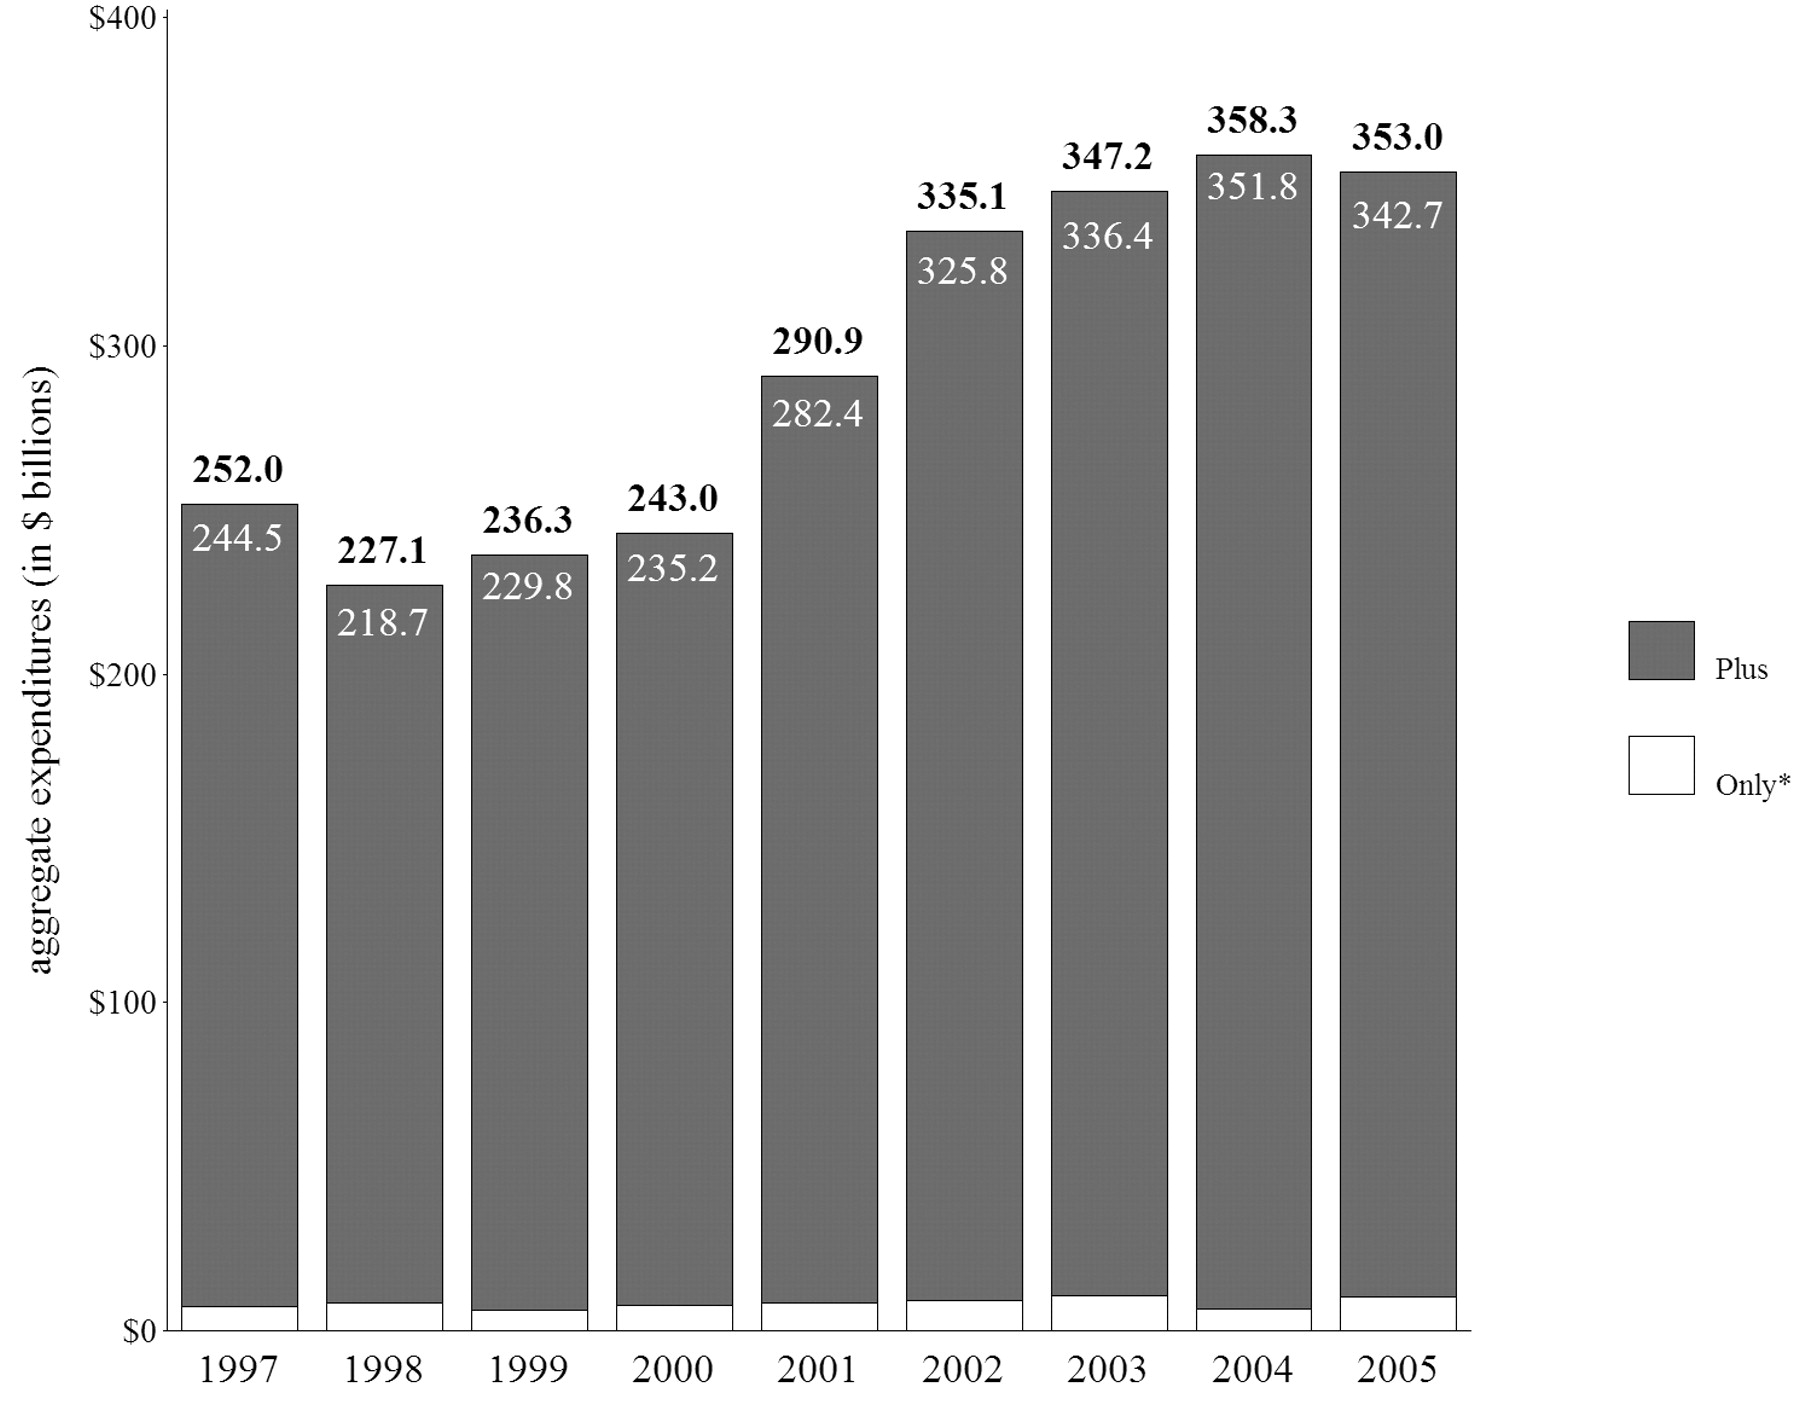
Aggregate total expenditures ($ billion) of the Arthritis group, by subgroups, 1997 to 2005 (2005 US dollars). “Plus”: Arthritis and 1+ non-Arthritis chronic condition; “Only”: Arthritis and no other chronic condition. Aggregate totals for Arthritis group may not equal sum of “Plus” + “Only” subgroups due to rounding. Medical Expenditure Panel Survey (MEPS) sample reflects the noninstitutionalized civilian population; analyses limited to individuals age 18 years and over. * Arthritis Only subgroup yearly expenditures as follows: $7.5, $8.4, $6.5, $7.9, $8.5, $9.4, $10.9, $6.5, and $10.3 billion.
(Detailed aggregate expenditure data for Other CC and None groups are available in the technical appendix located at www.mgcdata.com/publications/trends_arthritis/appendix.pdf) Like its Arthritis counterpart, the Other CC group also experienced steady increases in aggregate expenditures throughout the period (from $377.0 to $520.0 billion, or 38%). Like Arthritis, the primary driver of this increase was the aggregate expenditures of the multimorbidity subgroup (Other CC Plus), which generally rose steadily, from $308.6 billion in 1997 to $433.9 billion in 2005, representing an increase of 41%. The increase in Other CC Only was less (from $68.3 to $86.0 billion, or 26%), and exhibited year-to-year fluctuations similar to its Arthritis Only counterpart. Aggregate total expenditures for the None group also fluctuated between individual years and actually decreased by 5% overall across the years covered by the present analysis (from $47.9 to $45.6 billion).
DISCUSSION
We found a constant annual increase above medical inflation in overall medical expenditures for individuals with Arthritis from 1997 through 2005, although the $1,006 increase for the period was not statistically significant. As we hypothesized, increases in overall Arthritis group expenditures since 1997 are primarily attributable to significant escalations in ambulatory visit expenditures (29% above medical inflation, due to increases in both mean number of visits and expenditures per visit) and prescription expenditures (87% above). This finding confirms our earlier 1997 to 2003 study results6 and is consistent with a broader Agency for Healthcare Research and Quality analysis of the MEPS, which also found increases between 1997 and 2004 in the cost of prescription medications and the number of prescriptions filled for the US population16.
In 2005, the $353 billion spent on aggregate overall direct medical expenditures for the 20% of adults represented by the Arthritis group accounted for 38% of the aggregate direct medical expenditures for all US adults. In other words, the proportion of aggregate costs incurred by the Arthritis group is almost twice its share of the population. These aggregate costs accounted for 2.8% of the US gross domestic product (GDP) in 2005, slightly higher than the 2.2% of the GDP these expenditures represented in 1997.
The 40% increase in aggregate expenditures from 1997 to 2005 for the Arthritis group is attributable to 2 distinct factors: (1) the 22% increase in population for this group during this period, and (2) the 15% increase in mean per-person expenditures for the adults comprising this group. Questions eliciting conditions have not changed during this period; thus the large increases in population for the Arthritis and Other CC groups and their multimorbidity subgroups observed here are not due to changes in survey design. In addition, our prevalence estimate for Arthritis in the US adult population in 2003 (46.1 million) is very similar to that estimated by Hootman and Helmick from the National Health Interview Survey (NHIS) in that year (45.7 million)4. This similarity is remarkable given that the case-finding question in the NHIS is a single question querying whether the respondent has ever been diagnosed with arthritis by a doctor or healthcare practitioner, whereas the MEPS solicits causes of medical events or reports of bothersome conditions to ascertain medical diagnoses.
What might explain the large increase in the adult Arthritis population in this period, especially the 15% increase between 2000 (36.8 million) and 2001 (42.4 million)? The introduction of cyclooxygenase-2 (COX-2) inhibitors in 1999 and subsequent aggressive national and local direct-to-patient advertising in the last quarter of 2000 through 2002 significantly increased the flow of patients with osteoarthritis into physician practices17. It is reasonable to assume that individuals with osteoarthritis who may not have been diagnosed or who otherwise would not have visited a doctor due to their arthritis pain, started to do so shortly following the increase in advertising that began in late 2000. The increase in patient contact with physicians due to direct-to-patient advertising for COX-2 inhibitors could also have affected individuals with other conditions included in the Arthritis definition, and we presume that the large increases seen in the Arthritis population between 2000 and 2001, and to a lesser extent between 2001 and 2002, reflect that trend.
In our earlier work, we compared overall expenditures attributable specifically to Arthritis between 1997 and 2003 and found virtually no change in average per-person medical expenditures6. The significant increase in the overall expenditures found in this study among people with Arthritis is therefore due to treatment of the concurrent nonarthritis conditions experienced by adults in the Arthritis Plus subgroup, not due to an increase in the cost of treating arthritis.
One study objective was to examine the stability in expenditures among people with Arthritis across time and determine the robustness of our 2003 Arthritis-attributable cost estimate. This study confirms that (1) inflation-adjusted healthcare expenditures among adults with Arthritis Only remained roughly constant between 1997 and 2003, and (2) increases in expenditures among adults with Arthritis were attributable to the increased number of adults with Arthritis and coexisting conditions. This verifies that the findings in our earlier study6, which were based on only 2 years (1997 and 2003), were not biased by our choice of years.
Using a longitudinal study of older adults, Schoenberg and colleagues18 documented a large increase in multimorbidity and associated out-of-pocket expenditures from 1998 to 2002. Specifically, the prevalence of multimorbidity for all chronic diseases increased from 58% to 70% during this period. The percentage of the older adult population represented by adults with arthritis and another condition (equivalent to our Arthritis Plus subgroup) increased slightly, from 20.2% in 1998 to 22.5% in 2002, while the percentage for those with arthritis only decreased from 12.9% to 10.2%18.
This work sheds light on the growth and expenditures trends of the Arthritis adult population, but has at least 2 limitations. First, the accuracy of self-reported diagnosis of specific arthritis and rheumatic conditions in population-based samples is typically only low to moderate19,20; however, the agreement between self-reported and medical-provider diagnosis for the generic Arthritis category has been demonstrated to be sound in MEPS, with a sensitivity of 78% and specificity of 87%21. Second, other health-related expenditures such as those for modifications to an individual’s environment are not addressed.
The increased medical expenditures among people with Arthritis observed in our study indicate that the societal and individual burden of Arthritis has indeed increased and that this increase is likely to grow if trends observed here continue. The parallel trends seen in the non-Arthritis multimorbidity group (Other CC Plus) suggests that mounting effective public health responses to risk factors shared across many chronic diseases may yield substantial health and economic benefits. Our results further illustrate the urgent need for clinical and public health strategies to reduce risk factors (e.g., obesity) associated with Arthritis and other chronic conditions, and for greater awareness and use of disease management approaches, such as self-management education and regular physical activity, that are proven to decrease the symptoms of arthritis (e.g., pain) and other chronic conditions.
Acknowledgments
We thank Jeffrey Sacks, MD, MPH, for his thorough review and helpful contributions to this report.
Footnotes
-
The findings and conclusions in this report are those of the authors and do not necessarily represent the official position of the Centers for Disease Control and Prevention.
-
Supported by the Arthritis Program, Arthritis, Epilepsy and Quality of Life Branch, Centers for Disease Control and Prevention.
- Accepted for publication June 27, 2009.


