

Abstract
Objective. To investigate the characteristics of circulating natural killer (NK) cells and their interferon (IFN)-γ–producing ability in adult-onset Still disease (AOSD).
Methods. Peripheral blood mononuclear cells were obtained from 22 patients in the acute phase of AOSD (acute AOSD); 7 of the 22 patients after treatment (remission AOSD), and 11 healthy controls (HC). NK cells and their IFN-γ expression levels were analyzed by flow cytometry. Additionally, the cytokine receptors of interleukin (IL)-12, IL-15, and IL-18 on NK cells were also evaluated.
Results. The frequency of NK cells was significantly lower in acute AOSD than in HC. NK cell counts significantly increased in remission AOSD. Expression of IL-12 and IL-15 receptors on NK cells was significantly increased in acute AOSD, whereas that of IL-18 receptor indicated no significant difference among 3 groups. IFN-γ expression in NK cells was significantly higher in acute AOSD than in HC, and significantly decreased in remission AOSD. The absolute number of NK cells and IFN-γ–expressing NK cells revealed an inverse correlation with serum ferritin levels in acute AOSD. In 2 distinct subsets of NK cells, CD56dim NK cells significantly exhibited higher IFN-γ expression than CD56bright NK cells in acute AOSD.
Conclusion. In acute AOSD, NK cells displayed lower proportion, whereas they had higher ability for IFN-γ production than in HC; moreover, upregulation of IL-12 and IL-15 receptors on NK cells may promote IFN-γ production. In addition, disease activity may be implicated in regulating the number of NK cells and IFN-γ–expressing NK cells in AOSD.
Adult-onset Still disease (AOSD) is a systemic autoinflammatory disease characterized by daily spike fevers, polyarthritis, evanescent rash, pharyngitis, lymphadenopathy, and hepatosplenomegaly. Further, AOSD sometimes indicates life-threatening conditions such as aseptic meningitis, thrombotic thrombocytopenic purpura, disseminated intravascular coagulation, and macrophage activation syndrome (MAS) as a reactive hemophagocytic lymphohistiocytosis. The hallmarks of AOSD are hyperferritinemia, increased levels of inflammatory mediators including C-reactive protein (CRP), and increased white blood cell counts1,2. In addition, elevated levels of proinflammatory cytokines, including interleukin (IL)-1β, IL-6, IL-8, IL-12, IL-18, interferon (IFN)-γ, and tumor necrosis factor-α are found in the acute phase of AOSD3,4,5,6. These cytokines activate macrophages and neutrophils, which play a pivotal role in the pathogenesis2,7,8, suggesting that innate immunity contributes to the development of AOSD. Immune impairment of natural killer (NK) cells is also associated with the pathogenesis of AOSD or systemic juvenile idiopathic arthritis (sJIA), which have been regarded as the adult or juvenile spectrum of same disease, respectively9. Moreover, lower expression and defective cytotoxicity of NK cells were demonstrated in an active phase of disease10,11,12,13.
NK cells are identified as cytotoxic cells in the category of innate lymphoid cells capable of immune response without antigen-specific cross-linking. To defend the host against invasive and neoplastic pathogens, they stimulate macrophages, upregulate MHC class I on antigen-presenting cells, and promote effector function in T cell lineage by IFN-γ release; alternatively, they perform direct cytotoxicity14,15. In addition, a functional response of NK cells can be promoted by cytokine combination signals with IL-12, IL-15, and IL-18; notably, their relevant cytokine receptors are found on NK cells14,15,16,17. Accordingly, a specific immune response of NK cells in AOSD is supposed to be affected by the exposure of proinflammatory cytokines related to the disease. On the other hand, the IFN-γ–producing ability of NK cells remains unclear in AOSD.
We investigated the characteristics of circulating NK cells including their IFN-γ–producing ability as well as the relevant cytokine receptor expression in patients with AOSD.
MATERIALS AND METHODS
Patients and samples
Twenty-two patients with AOSD took part in this study [mean age: 51 ± 16 yrs (range 25–80 yrs), 5 men and 17 women]. They were definitively diagnosed according to the criteria proposed by Yamaguchi, et al18 in Shinshu University hospital. The clinical characteristics of the diagnosis and other features related to the disease are shown in Table 1. The complication of MAS and the activity score were also investigated according to the proposal diagnostic criteria19 and the systemic score proposed by Pouchot, et al20, respectively. Blood samples were obtained prior to the immunosuppressive treatments. As for the healthy controls (HC), blood samples from 11 individuals (mean age: 47 ± 12 yrs, 6 men and 5 women) were also provided. No significant differences in the mean age and distribution of sex were shown between patients with AOSD and HC.
Clinical characteristics of patients with adult-onset Still disease in the acute and remission phases.
To evaluate the results in the remission phase of AOSD, blood samples were taken from 7 of 22 patients at the mean period of 39 ± 43 months after starting immunosuppressive therapy. Remission was defined by fulfilling both assignments as follows: the Pouchot’s score was achieved in 0, and no physical findings concerning disease activity shown in Table 1 were found. When the blood samples were taken, 5 patients had received maintenance therapy including prednisolone (n = 4), cyclosporine (n = 1), methotrexate (n = 2), golimumab (n = 1), and tocilizumab (n = 2). Their laboratory findings were also significantly improved as follows (Table 1): the number of white blood cells (p = 0.032), neutrophils (p = 0.014), serum levels of aspartate transaminase (p = 0.0004), alanine transaminase (p = 0.022), lactate dehydrogenase (p = 0.0003), CRP (p < 0.0001), erythrocyte sedimentation (p = 0.0004), and ferritin (p < 0.0001).
This study was approved by the Local Ethics Committee at Shinshu University (approval number: 601). All individual participants provided informed consent.
Sample preparation and flow cytometry
Whole blood samples were collected into EDTA-coated tubes. Peripheral blood mononuclear cells (PBMC) from whole blood samples were isolated by gradient centrifugation with Ficoll-Hypaque PLUS (GE Healthcare). To define NK cells in flow cytometric analysis, unstimulated PBMC were stained with Pacific blue–conjugated anti-CD3 (BioLegend), FITC-conjugated anti-CD16, and phycoerythrin-conjugated anti-CD56 (both from Beckman Coulter). NK cells were phenotypically defined as CD3–CD16+CD56+ cells in the population gated on total lymphocytes. NK cells were additionally stained with allophycocyanin (APC)-conjugated anti-CD212 (IL-12Rβ1) (Miltenyi Biotec), alternatively, with APC-conjugated anti-CD215 (IL-15Rα; BioLegend), or APC-conjugated anti-CD218 (IL-18Rα; Miltenyi Biotec). To examine intracellular IFN-γ expression in NK cells, PBMC were stimulated with 0.5 μg/ml of ionomycin, 0.04 μg/ml of phorbol myristate acetate (both from Sigma-Aldrich), and 2 μm monensin (BD Bioscience) at 37°C for 4 h. Stimulated PBMC were permeabilized with Cytofix/Cytoperm (BD Bioscience) after being stained with above-described cell-surface makers including CD3, CD16, and CD56. Permeabilized cells were subsequently stained with APC-conjugated anti-IFN-γ (BioLegend). IFN-γ expression was detected in the population gated on NK cells. Stained cells were acquired on a FACSCanto II flow cytometer (BD Bioscience), and the acquired data were analyzed by FlowJo version 7.6.5 software (Tree Star Inc.).
Serum IL-18 measurement
Serum samples were stored at −80°C until use with ELISA. The serum concentration of IL-18 was measured using commercially available ELISA kit (Medical and Biological Laboratories). The minimal detectable concentration of IL-18 was 12.5 pg/ml.
Statistical analysis
The clinical findings shown in Table 1 were represented as the median (interquartile range). The analyzed results were shown as the mean ± SD. Statistical significance was defined as 2-sided p values < 0.05. To compare the analyzed findings between patients with AOSD and HC, the Mann-Whitney U test was used. The Wilcoxon signed-rank test was performed to compare data before and after treatment in patients with AOSD. Correlation coefficient test was used for evaluating a significant relationship between the analyzed data and clinical findings.
RESULTS
Circulating NK cell proportion and counts in AOSD
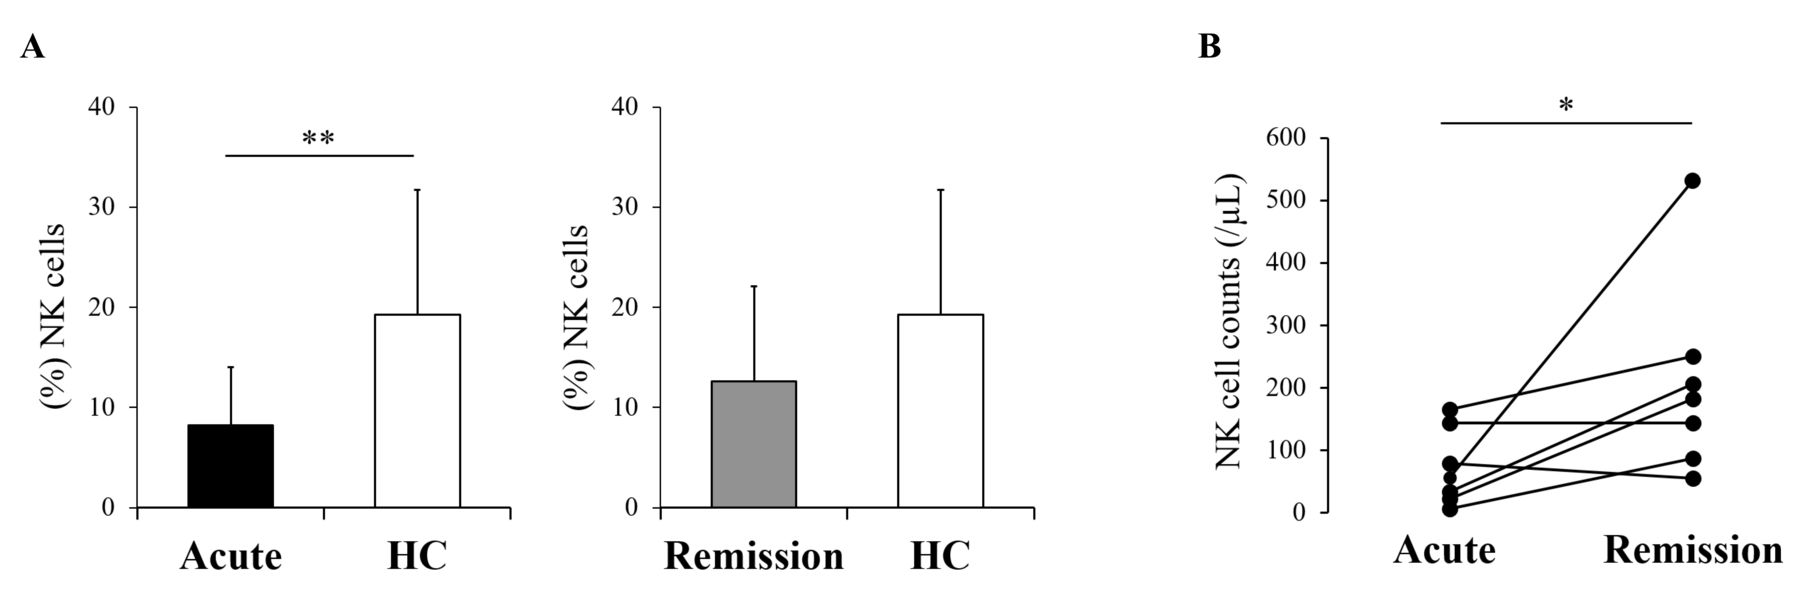
To determine the proportion of NK cells in the peripheral blood, we compared the frequency of NK cells in the population of peripheral lymphocytes between 22 patients with AOSD prior to the treatment (acute AOSD), 7 of those in the remission phase of AOSD (remission AOSD), and HC. The proportion of NK cells was significantly lower in acute AOSD than in HC (mean 8.2% vs 19.2%; p = 0.002; Figure 1A). Meanwhile, no significant difference was demonstrated between remission AOSD and HC (mean 12.6%, p = 0.063). Of 7 patients in remission AOSD, 6 indicated increased counts of NK cells, ultimately demonstrating statistical significance (p = 0.042; Figure 1B).

NK cell counts in patients with AOSD. Frequencies of NK cells in peripheral blood lymphocytes were compared between 22 patients with acute AOSD, 7 with remission AOSD, and 11 healthy controls (A). NK cell counts were sequentially evaluated in 7 patients between acute and remission phase (B). Values are shown as the mean ± SD. Statistically significant difference was evaluated by the Mann-Whitney U test (A) or Wilcoxon signed-rank test (B), indicating as follows: *p < 0.05 and **p < 0.005. NK: natural killer; AOSD: adult-onset Still disease; HC: healthy controls.
Expression of cytokine receptors on NK cells in AOSD
Since IL-12, IL-15, and IL-18 are pivotal cytokines promoting NK cell lineage, we investigated the expression of cytokine receptors responsive to IL-12, IL-15, and IL-18 (IL-12Rβ1, IL-15Rα, and IL-18Rα, respectively) on NK cells (Supplementary Figure 1A, available with the online version of this article). IL-12Rβ1 expression was significantly higher in acute AOSD than in HC [mean 94.0% vs 87.2%, p = 0.004; median fluorescence intensity (MFI), p = 0.002; Figure 2A, 2B]. No significant difference was shown between remission AOSD and HC (mean 90.2%, p = 0.717; MFI, p = 0.497; Supplementary Figure 2A, 2B). A significant decrease of IL-12Rβ1-MFI was demonstrated in a remission phase (p = 0.017; Figure 3A), whereas IL-12Rβ1+ NK cell counts were not significantly different between an acute and remission phase (p = 0.062; Figure 3B). IL-15Rα proportion was significantly higher in acute and remission AOSD than in HC (mean 21.4%, 9.4%, 4.6%, respectively; acute AOSD vs HC, p < 0.0001; remission AOSD vs HC, p = 0.016; Figure 2C and Supplementary Figure 2C), and IL-15Rα-MFI was significantly higher in acute AOSD than in HC (p < 0.0001) while being not significantly different between remission AOSD and HC (p = 0.205; Figure 2D and Supplementary Figure 2D). In comparison between an acute and remission phase, a decrease in IL-15Rα-MFI was significant (p = 0.028) despite no statistical significance in IL-15Rα+ NK cell counts (p = 0.225; Figure 3C, 3D). Percent frequency of IL-18Rα was around 80% in acute, remission AOSD, and HC (mean 80.4%, 77.7%, and 82.7%, respectively), showing no significant difference (acute vs HC, p = 0.516; remission vs HC, p = 0.441; Figure 2E and Supplementary Figure 2E). No statistical significance was indicated in the comparison of IL-18Rα-MFI (acute vs HC, p = 0.169; remission vs HC, p = 0.556; acute vs remission, p = 0.612) or that of IL-18Rα+ NK cell counts between an acute and remission phase (p = 0.063; Figure 2F, 3E, 3F, and Supplementary Figure 2F).

The comparison of interleukin (IL)-12Rβ1, IL-15Rα, and IL-18Rα expression on NK cells between acute AOSD and HC. Percentage of IL-12Rβ1, IL-15Rα, or IL-18Rα (A, C, E) and median fluorescence intensity (MFI) of them (B, D, F) in NK cells were compared between patients with acute AOSD and HC. Values are shown as the mean ± SD. The Mann-Whitney U test was used in the comparison. Statistically significant differences are indicated as follows: **p < 0.005 and ****p < 0.0001. NK: natural killer; AOSD: adult-onset Still disease; HC: healthy controls.

The evaluation of interleukin (IL)-12Rβ1, IL-15Rα, and IL-18Rα expression on NK cells in a remission phase. IL-12Rβ1, IL-15Rα, or IL-18Rα-MFI in NK cells (A, C, E) and their expressing NK cell counts (B, D, F) were sequentially evaluated in 7 patients between acute and remission phase. The Wilcoxon signed-rank test was used in the comparison. Statistically significant difference is indicated as *p < 0.05. NK: natural killer; MFI: median fluorescence intensity.
Kinetic evaluation of IFN-γ–expressing NK cells in AOSD
IFN-γ production is a crucial function in NK cell machinery. Therefore, we additionally investigated IFN-γ expression in NK cells. In acute AOSD, IFN-γ expression in NK cells was significantly higher than in HC (mean 53.2% vs 24.1%; p = 0.0001; MFI, p = 0.0001; Figure 4A, 4B, and Supplementary Figure 1B, available with the online version of this article). In remission AOSD, IFN-γ expression in NK cells was significantly lower than in HC (mean 13.1%; p = 0.008; MFI, p = 0.040; Figure 4C, 4D). IFN-γ-MFI decreased in 7 patients at a remission phase, showing statistical significance in remission AOSD (p = 0.018; Figure 4E). Meanwhile, no significant difference was shown in the comparison of IFN-γ–expressing NK cell counts (p = 0.398; Figure 4F). Even among 3 patients who had been treated with biologics, only 1 patient revealed a decrease in IFN-γ–expressing NK cell counts (data not shown).
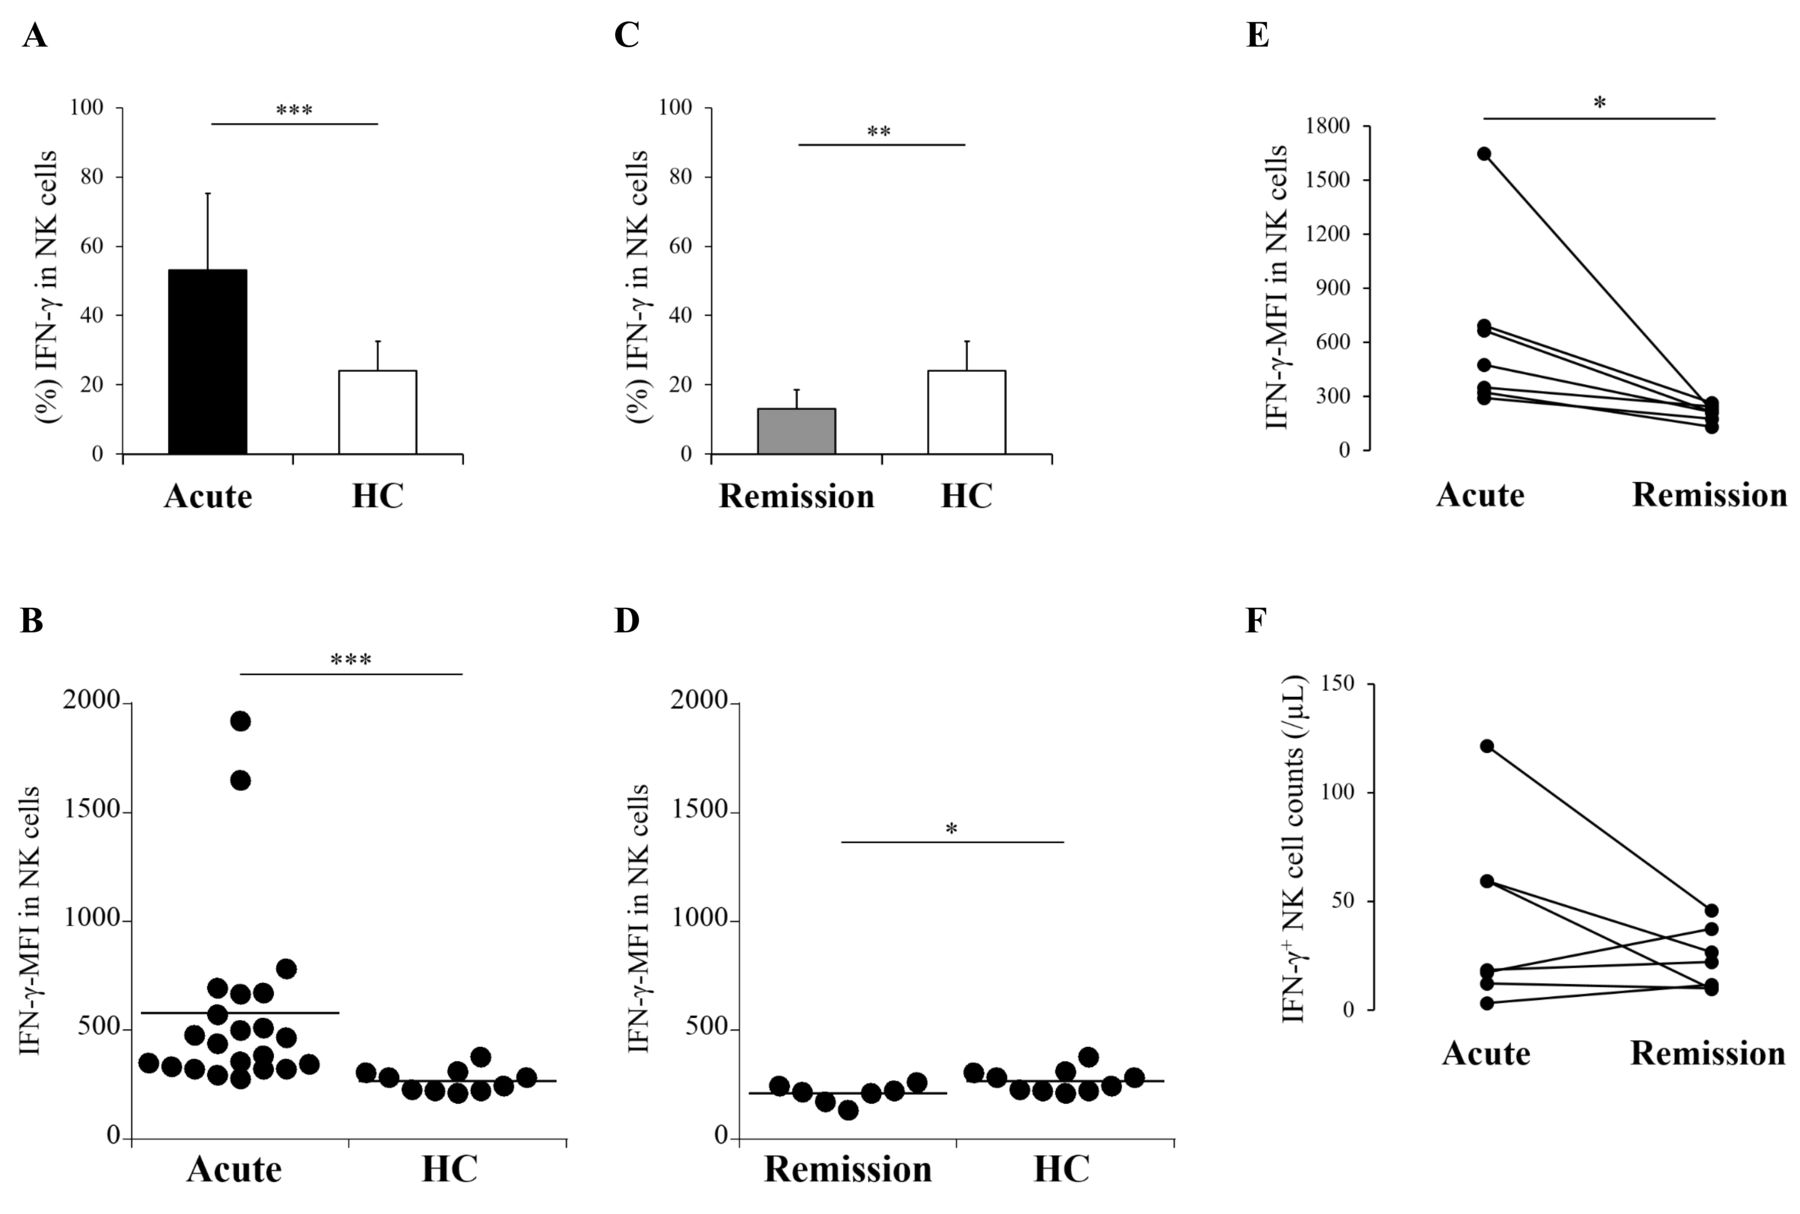
IFN-γ production in NK cells from patients with AOSD. Percentage and MFI of IFN-γ in NK cells were compared between patients with acute AOSD and HC (A, B), or between those with remission AOSD and HC (C, D). IFN-γ-MFI in NK cells (E) and IFN-γ–expressing NK cell counts (F) were sequentially evaluated in 7 patients between acute and remission phase. Values are shown as the mean ± SD. The Mann-Whitney U test was used in the comparison between 3 groups. The Wilcoxon signed-rank test was used in comparison between an acute and remission phase. Statistically significant differences are indicated as follows: *p < 0.05, **p < 0.01, and ***p = 0.0001. NK: natural killer; AOSD: adult-onset Still disease; HC: healthy controls; IFN: interferon; MFI: median fluorescence intensity.
Relationship between IFN-γ–expressing NK cells and serum ferritin levels in AOSD
We analyzed the relationship between NK cells and clinical findings. It has been found that serum IL-18 was strongly associated with the disease activity and/or the clinical features in AOSD2,3,4,5,21,22. Therefore, serum IL-18 levels were additionally measured. Serum levels of IL-18 were higher in acute AOSD than in HC (mean 2212.4 pg/ml vs 71.6 pg/ml, p < 0.0001; Supplementary Figure 3A, available with the online version of this article). They were still higher in remission AOSD than in HC (mean 109.2 pg/ml, p = 0.008), while a significant decrease was demonstrated in a remission phase (p = 0.018; Supplementary Figure 3B). However, serum IL-18 levels had significant correlations with neither the clinical findings described in Table 1, including MAS complication and the Pouchot’s score, nor any data analyzed by flow cytometry (data not shown). MAS complication or the Pouchot’s score had no significant correlation with any data analyzed by flow cytometry (data not shown). On the other hand, serum ferritin levels significantly demonstrated inverse correlations with the absolute number of NK cells and IFN-γ–expressing NK cells in acute AOSD (p = 0.017 and p = 0.003, respectively) despite no correlation with IFN-γ–MFI in NK cells (p = 0.202; Figure 5A, 5B, 5C).
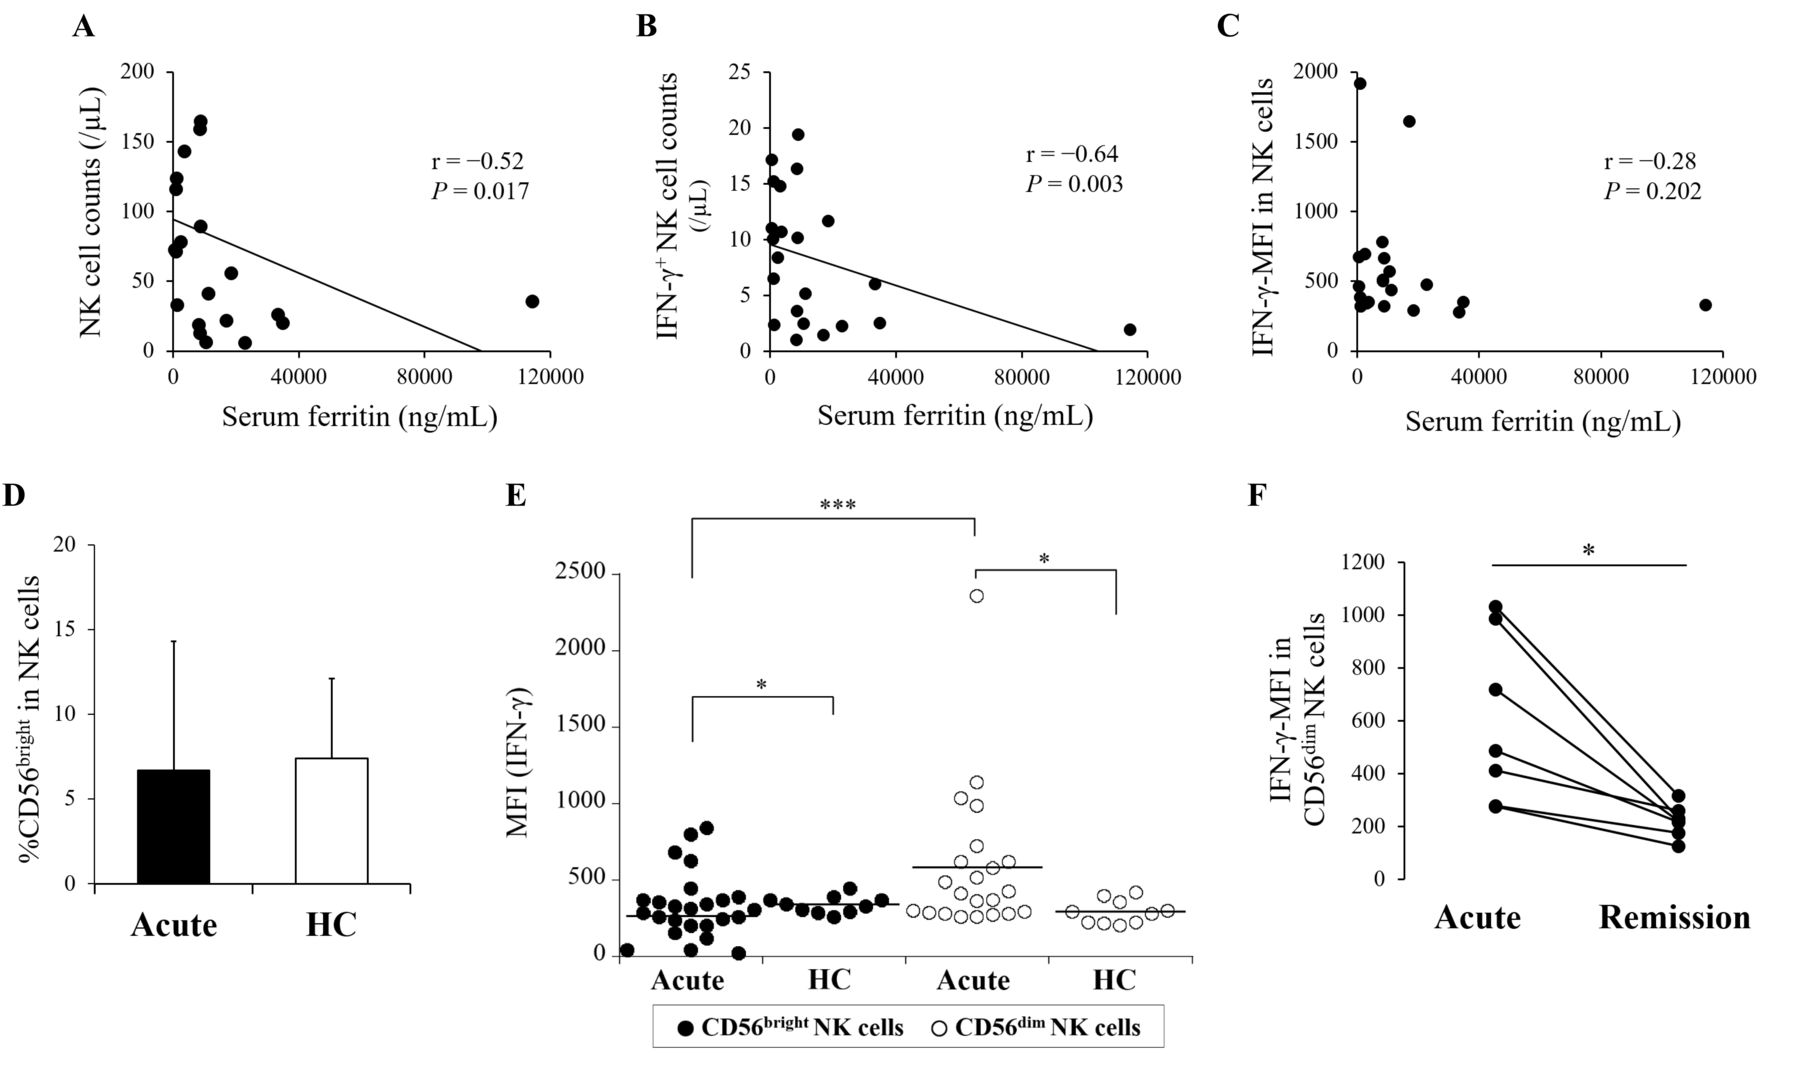
Inverse correlation with serum ferritin levels and IFN-γ-producing ability in 2 distinct NK cell subsets. Regarding the absolute number of NK cells, IFN-γ-expressing NK cells, and IFN-γ-MFI in NK cells, the correlations with serum ferritin levels were evaluated in patients with acute AOSD by the correlation coefficient test (A, B, C). In the population of NK cells (CD3−CD16+CD56+ cells), CD56bright and CD56dim subsets were divided. The proportion of CD56bright in NK cells was compared between patients with acute AOSD and HC (D). In the population of CD56bright or CD56dim NK cells, IFN-γ–producing ability was evaluated. IFN-γ-MFI in each subset was compared between patients with acute AOSD and HC (E). In addition, IFN-γ–MFI in CD56dim NK cell population was compared between an acute and remission phase (F). Values are shown as the mean ± SD. The Mann-Whitney U test was used in the comparison between patients with acute AOSD and HC. The Wilcoxon signed-rank test was used for the comparison between CD56bright and CD56dim in acute AOSD, or for that between an acute and remission phase. Statistically significant differences are indicated as follows: *p < 0.05 and ***p < 0.0005. NK: natural killer; AOSD: adult-onset Still disease; HC: healthy controls; IFN: interferon; MFI: median fluorescence intensity.
Next, we re-analyzed the property of NK cells in relation to IFN-γ production by subdividing the CD3−CD16+CD56+ population into high- and low-density expression of CD56 (CD56bright and CD56dim, respectively; Supplementary Figure 4A, available with the online version of this article). The proportion of CD56bright in NK cells was almost equal between acute AOSD and HC (mean 6.7% vs 7.4%, p = 0.268) while being lower in remission AOSD than in HC (mean 3.9%, p = 0.042; Figure 5D and Supplementary Figure 4B). IFN-γ-MFI in CD56bright was significantly lower in acute AOSD than in HC (p = 0.014), whereas that in CD56dim was significantly higher in acute AOSD than in HC (p = 0.012; Figure 5E and Supplementary Figure 5A). In acute AOSD, IFN-γ-MFI was significantly lower in CD56bright than in CD56dim (p = 0.0003). IFN-γ-MFI in CD56dim significantly decreased in a remission phase (p = 0.018; Figure 5F). Although IFN-γ-MFI in CD56bright showed no significant difference in a remission phase (p = 0.310), increased expression of that was shown in 3 patients who had been treated with biologics (Supplementary Figure 5C).
DISCUSSION
The proportion of NK cells was found to be significantly lower in acute AOSD than in HC, supporting previous studies, which demonstrated impairment of NK cells based on disease activity of AOSD10,11. MAS may be attributed to defective cytotoxic function of NK cells as a hallmark of AOSD pathogenesis7,13. A high amount of serum IL-18, which is strongly associated with the disease activity in AOSD2,3,4,5,21,22, reduces functional NK cells, and is implicated in MAS induction21,23, suggesting that the dysfunction of NK cells is a fundamental immune disorder in AOSD development. Although it was insufficient to indicate direct relationship between NK cell reduction and MAS or serum IL-18 levels in our study, NK cell reduction was significantly related to high levels of serum ferritin. Meanwhile, high elevation of serum ferritin is found to be associated with MAS and/or serum IL-18 elevation in AOSD5,24; moreover, serum ferritin is a valuable serological marker of disease activity2,25,26. Accordingly, this result may suggest that the higher AOSD disease activity develops, the more the reduction of NK cells may be substantially promoted. In fact, NK cell counts significantly increased in remission AOSD.
IFN-γ, which is known to activate macrophages, is primarily produced by activated NK cells and effector T cells27. Previous studies have shown that serum levels of IFN-γ significantly increase in the acute phase of AOSD4,5,6. Indeed, our study demonstrated that IFN-γ expression in NK cells was significantly higher in acute AOSD than HC. In the activating cascade of NK cells, IL-12, IL-15, and IL-18 are potential inducers of IFN-γ secretion15,28. Therefore, upregulation of proinflammatory cytokines including IL-18 and IL-12, which are shown in an acute phase of AOSD4, is supposed to enhance NK cell activation. Elevated expression of serum IL-15 was also demonstrated in patients with sJIA29.
In a series of our study, we also focused on the relevant cytokine receptors on NK cells. IL-18 receptor expression on NK cells in acute AOSD was not significantly different from that in both remission AOSD and HC. In NK cells, IFN-γ can be predominantly produced based on IL-18 participation in the presence of IL-12 or IL-15 under physiological conditions28,30. When extracellular IL-18 binds to IL-18 receptor α (IL-18Rα), IL-18 receptor β (IL-18Rβ) is recruited as the co-receptor to form a high-affinity receptor complex in the process of intracellular IL-18 signal transduction28,31,32,33. However, defective phosphorylation of IL-18Rβ impaired NK cell function and reduced IFN-γ secretion even after IL-18 stimulation in sJIA32. Accordingly, IL-18 signaling within NK cells from patients with AOSD may be impaired even though IL-18Rα expression remains. This theory may explain the causal attribution of our result that no significant correlation was shown between serum IL-18 levels and IFN-γ–expressing NK cells in acute AOSD. On the other hand, expression of IL-12 and IL-15 receptors on NK cells was significantly higher in acute AOSD than in both remission AOSD and HC. The ability to drive IFN-γ secretion by IL-12 or IL-15 seems to be restricted under deficient IL-18 signaling15,30. However, NK cells may exert the compensatory mechanism mediating IFN-γ production by inducing intracellular IL-12 and IL-15 signals by upregulating their affiliate receptors in AOSD.
In acute AOSD, IFN-γ–expressing NK cell counts was inversely correlated with serum ferritin levels. Given the evaluation of NK cell features divided into 2 subsets based on CD56 antigen in this study, IFN-γ expression in CD56bright was significantly lower in acute AOSD than in HC; and conversely, increased IFN-γ expression in CD56dim was significantly demonstrated. This result is considered paradoxical as the physiological phenomenon because CD56bright NK cells are recognized as the main producer of IFN-γ16,34,35. However, CD56dim NK cells can more prominently produce proinflammatory cytokine after K562 cell interaction as a target cell than CD56bright NK cells36. In fact, K562 cell interaction was found to reduce the proportion and/or function of NK cells in sJIA and AOSD10,13. Besides, cell-cell interaction with dendritic cells may also affect NK cell function in which IFN-γ production can be induced15. Therefore, CD56dim NK cells may develop their IFN-γ–producing ability through crosstalk with immunopathogenic cells related to AOSD development. Further, it is hypothesized that the absolute number of IFN-γ–expressing NK cells may be changed during IFN-γ–producing dominancy being shifted from CD56bright to CD56dim in acute AOSD, allowing that the inverse correlation with serum ferritin levels might be ultimately determined as the result of reducing the absolute number of IFN-γ–expressing NK cells depending on high disease activity.
Meanwhile, IFN-γ expression in NK cells significantly decreased in remission AOSD compared with that in HC. Previous studies demonstrated that NK cell function including IFN-γ production is suppressed by the treatment with immunosuppressive agents37,38. Given the above-mentioned results as well as the relevant citations, it should be considered that defective NK cell function may contribute to not only onset of AOSD, but also insufficient host immunity against infectious microbes during the treatment. However, only 7 patients in remission AOSD could be sequentially analyzed in our study, thus the number of samples might be insufficient for obtaining a complete determination.
The proportion of NK cells was significantly lower in acute AOSD than in HC, whereas NK cells revealed higher expression of IFN-γ as well as IL-12 and IL-15 receptors in acute AOSD than in HC. It was suggested that upregulation of IL-12 and IL-15 receptors may be implicated in compensating increased intracellular IFN-γ production in NK cells from patients with acute AOSD despite no significant expression of IL-18 receptor. Meanwhile, the numbers of NK cells and IFN-γ–expressing NK cells were correlatively reduced in accordance with elevated serum levels of ferritin. In addition, CD56dim NK cells prominently produced IFN-γ compared with CD56bright NK cells in acute AOSD. It was assumed that the ability of IFN-γ production in NK cells may be affected depending on a disease activity in AOSD. On the other hand, NK cells are also induced in response to certain viruses and haptens through a different mechanism14,17,39. Some inhibitory receptors binding to host-MHC class I regulate NK cell activity including cytotoxicity and cytokine production15,40. Moreover, the experimental system with multiple-proinflammatory cytokines affecting AOSD development may be needed for clarifying more precise IFN-γ–producing machinery in NK cells, because the activation with phorbol myristate acetate/ionomycin was used solely in our study. Therefore, further investigation requires evaluating a wide variety of immune reactions in NK cell lineage together with recruiting more patients.
ONLINE SUPPLEMENT
Supplementary material accompanies the online version of this article.
Acknowledgment
We thank all members of the Department of Medicine (Neurology and Rheumatology), Shinshu University Hospital, for treating the patients.
Footnotes
This study was supported by a Health and Labor Sciences Research Grant on Rare and Intractable Diseases from the Ministry of Health, Labor, and Welfare of Japan.
- Accepted for publication January 28, 2019.


