Article Text

Abstract
Objective Resting Fluorine-18 fluorodeoxyglucose positron emission tomography (FDG-PET) brain imaging and neuropsychological testing were used to investigate the usefulness of a spatial navigation task (SNT) as a performance benchmark for cognitive impairment related to anti-N-methyl D-aspartate (anti-NMDA) receptor antibodies (DNRAb) in SLE.
Methods Neuropsychological assessments, including a desktop 3-D virtual SNT, were performed on 19 SLE participants and 9 healthy control (HC) subjects. SLE participants had stable disease activity and medication doses and no history of neuropsychiatric illness or current use of mind-altering medications. Resting FDG-PET scans were obtained on all SLE participants and compared with a historical set from 25 age-matched and sex-matched HCs. Serum DNRAb titres were measured by ELISA.
Results 11/19 (58%) of SLE participants failed to complete the SNT (SNT−) compared with 2/9 (22%) of HCs. Compared with 7/9 (78%) in HCs, only 2/9 (22%; p=0.037) of SLE participants with high serum DNRAb titres completed the SNT, in contrast to 6/10 (60%; p=0.810) in SLE participants with low DNRAb titres. Voxel-wise comparison of FDG-PET scans between the 8 SLE participants successfully completing the SNT task (SNT+) and the 11 SNT− SLE participants revealed increased metabolism in the SNT+ participants (p<0.001) in the left anterior putamen/caudate, right anterior putamen, left prefrontal cortex (BA 9), right prefrontal cortex (BA 9/10) and left lateral and medial frontal cortex (BA 8). Compared with HCs, the SNT+ group demonstrated increased metabolism in all regions (p<0.02) except for the right prefrontal cortex (BA 9), whereas the SNT− group demonstrated either significantly decreased or similar metabolism in these seven regions.
Conclusions SNT performance is associated with serum DNRAb titres and resting glucose metabolism in the anterior putamen/caudate and frontal cortex, suggesting compensatory neural recruitment in SNT-associated regions is necessary for successful completion of the task. The SNT therefore has potential for use as a marker for SLE-mediated cognitive impairment.
- FDG-PET
- DNRAb
- systemic lupus erythematosus (sle)
- spatial navigation task (snt)
This is an open access article distributed in accordance with the Creative Commons Attribution Non Commercial (CC BY-NC 4.0) license, which permits others to distribute, remix, adapt, build upon this work non-commercially, and license their derivative works on different terms, provided the original work is properly cited, appropriate credit is given, any changes made indicated, and the use is non-commercial. See: http://creativecommons.org/licenses/by-nc/4.0/.
Statistics from Altmetric.com
Key messages
SLE patients with no history of central nervous system (CNS) disease exhibit poor performance on a spatial navigation task (SNT).
SNT performance associates with resting metabolism in the anterior putamen/caudate and frontal cortex.
Poor performance on an SNT associates with high serum DNRAb titres.
Compensatory neural recruitment may be necessary to complete the SNT in patients with SLE.
Introduction
Cognitive dysfunction (CD) is a common manifestation of neuropsychiatric lupus (NPSLE) with reported prevalences of 20%–80% and is associated with diminished quality of life.1–4 Discrepancies in prevalence rates reflect the variability and imprecision of available neuropsychological testing, differences in definitions of CD and difficulties with assigning attribution to SLE-associated mechanisms rather than other potentially confounding influences from infection, metabolic disturbances, medication effects, mood disturbances, microvascular insults and neurotoxins. There is a great need for unbiased measures for the assessment and attribution of CD related to SLE (SLE-CD) as these will provide diagnostic and prognostic biomarkers that can also be used as metrics for a clinical trial. Fluorine-18 fluorodeoxyglucose positron emission tomography ([18F]FDG-PET) provides non-invasive functional assessments of regional brain metabolism that can be correlated with serology and neuropsychological testing to identify specific SLE-related cognitive deficiencies.5 6
The wide range of clinical manifestations of SLE are unified by the presence of autoreactive cells and antibodies that promote destructive inflammatory responses. Proposed mechanisms for SLE-CD include neurotoxic effects of autoantibodies directed at neuronal antigens such as N-methyl D-aspartate receptors (NMDAR), which affect neuronal function.7–11 In non-autoimmune mice immunised to produce anti-NMDAR antibodies (termed DNRAb), it has been well established that DNRAb, depending on methods used to breach the blood–brain barrier, bind NMDARs on place cells in the CA-1 area of the hippocampus with resulting functional alterations in spatial memory.12–14 Accordingly, studies in SLE participants have demonstrated a significant association between poor performance on a spatial memory task and serum DNRAb titres.12 We have reported previously that SLE participants demonstrate increased resting metabolism in the hippocampus, posterior putamen/globus pallidus/thalamus and orbitofrontal cortex.5 6 Serum DNRAb titres correlated with metabolic increases in the hippocampus and orbitofrontal cortex, decreased microstructural integrity in the parahippocampus, and memory impairment.6
The current study furthers exploration into the relationship between spatial memory and DNRAb in SLE subjects by using a spatial navigation task (SNT) that may be more clinically relevant than the previously used static spatial memory task.12 Spatial navigation is known to rely on the hippocampus and the parahippocampal gyrus in both murine15 and human16 models, with additional input from the caudate nucleus and orbitofrontal cortex. Recruitment of these areas depends on whether an individual is using a more flexible allocentric strategy, which primarily uses the hippocampus,17 18 or a less flexible stimulus-response strategy that uses the caudate.19–21 In addition, the prefrontal cortex is known to vary in activity based on retrieval difficulty for general memory,22 a finding that has been replicated with navigation-specific information.16 23 24 Related to the current study, it has also been shown that better navigational performance without explicit manipulation of retrieval difficulty is directly associated with increased activity in left-lateralised inferior frontal and orbitofrontal cortex.19
The ability of navigation tasks to selectively elicit activity from cortical regions previously shown to be susceptible to damage in SLE (the hippocampus, parahippocampus, putamen and orbitofrontal and prefrontal cortex) makes it ideal as a potential diagnostic tool. We hypothesised that SLE spatial navigation performance would be impaired compared with healthy controls and that high serum DNRAb titres in SLE participants would inversely correlate with performance. FDG-PET imaging was used to explore associations between regional resting metabolism and spatial navigation performance. As in our previous studies, we continue to focus on SLE participants with no known history of NPSLE or other CNS insult in order to avoid confounding influences on our neuropsychological and imaging outcomes that are likely driven by different underlying mechanisms. We employed a dynamic SNT that has been used in a healthy control population to elicit differences in egocentric versus allocentric processing.25 Understanding the relationships between the SNT, serum DNRAb titres, other cognitive testing and resting regional glucose metabolism in the brain will expand our characterisation of SLE-CD and evaluate the potential of these measures as biomarkers for SLE-CD.
Participants and methods
Participant selection
Nineteen SLE participants were recruited randomly from Rheumatology Clinics at the Feinstein Institute for Medical Research (FIMR) from 2014 to 2016. All were 18 years of age or older and fulfilled American College of Rheumatology (ACR) revised criteria for SLE.26 To avoid confounding influences on neuroimaging and neuropsychological endpoints, key exclusion criteria included the presence of active or prior NPSLE (defined by the 19 case definitions26) or other CNS event, a primary psychiatric diagnosis that precluded the SLE diagnosis, current use of antidepressant (any class), antipsychotic or anxiolytic drugs or history of illicit drug use that included opiates, cannabis or any illegal drugs. All of the SLE subjects were well known to two of the investigators, MM and CA, and records were reviewed during screening to assess eligibility. Cognitive and behavioural impairment were the focus of the study, and these were not assessed during screening. Inclusion criteria required stable disease activity for 4 weeks prior to the assessments, defined as no increase in disease signs or symptoms attributed to SLE that prompted an increased dose or addition of corticosteroids and/or immunosuppressive/disease-modifying drugs.
Nine age-matched and sex-matched healthy control subjects were recruited for the neuropsychological assessments (NHCs). Only 2/9 NHCs had FDG PET scans, therefore, 23 historical healthy control PET scans were selected from a cohort of resting FDG PET imaging studies at the Center for Neurosciences in the FIMR for a total of 25 age-matched and sex-matched imaging healthy controls (IHCs). PET imaging data from these 25 IHCs were used for comparison with the 19 SLE scans. The research was in compliance with the Helsinki Declaration. Informed consent was obtained prior to study procedures.
Clinical and neuropsychological assessments
SLE disease activity and accrued damage were assessed with the Safety of Estrogens in Lupus Erythematosus National Assessment – Systemic Lupus Erythematosus Disease Activity Index27 and the Systemic Lupus International Collaborating Clinics/ACR Damage Index28 within 2 weeks of imaging and neuropsychological assessments. Neuropsychological assessments, including the Automated Neuropsychological Testing Metric (ANAM) and SNT, were performed on all SLE participants and nine NHCs in a quiet room by one author (EP) and two graduate students who remained blinded to DNRAb status of participants. The ANAM (V.4.5.0.2) comprises a computerised library of assessments of cognitive domains.29 30 Throughput scores, representing a combination of reaction time and accuracy, were the primary measure of cognitive efficiency used in the analyses. The following ANAM subtests were selected for this study based on their cognitive domain associations:
Matching grids: a measure of spatial processing efficiency where two designs are shown sequentially, and the viewer is asked to determine if they are identical or different from each other.
Match to sample: a measure of visuospatial perception and working memory where the subject is asked to select which of two checkerboard matrix designs match a target checkerboard matrix design presented 5 seconds earlier.
Running memory continuous performance test: a measure of vigilance and sustained attention where a running set of numbers is presented in a randomised sequence. The subject is asked to continuously monitor the numbers and determine if each new number is the same as or different from the preceding number.29
The SNT consisted of navigation through a desktop 3D virtual city using Blender (Blender Foundation, Amsterdam, The Netherlands), as previously described.25 The virtual city comprised a grid of intersections anchored by four surrounding towers (figure 1). Navigation through some of the intersections was obstructed by semi-randomly placed road blocks that subconsciously encouraged a particular route to the target location. The SNT was designed in two steps; a training period followed by a probe period. Participants were given four training trials to find the target intersection, located near one of the four towers. Each trial terminated after 5 min if the target was not found. If successful at finding the target, participants moved on to probe trials to assess ability to mark the intersection without feedback. Due to substantial difficulties in locating the target, most SLE participants did not perform probe trials. We therefore report only the training trial data and SNT performance was assessed by the ability to find the target, as well as total search area, total number of turns and total number of moves over the course of the four training trials. Participants were additionally rated for depression and anxiety with the Beck Depression Inventory (BDI)31 32 and the State Trait Anxiety Inventory (STAI).33
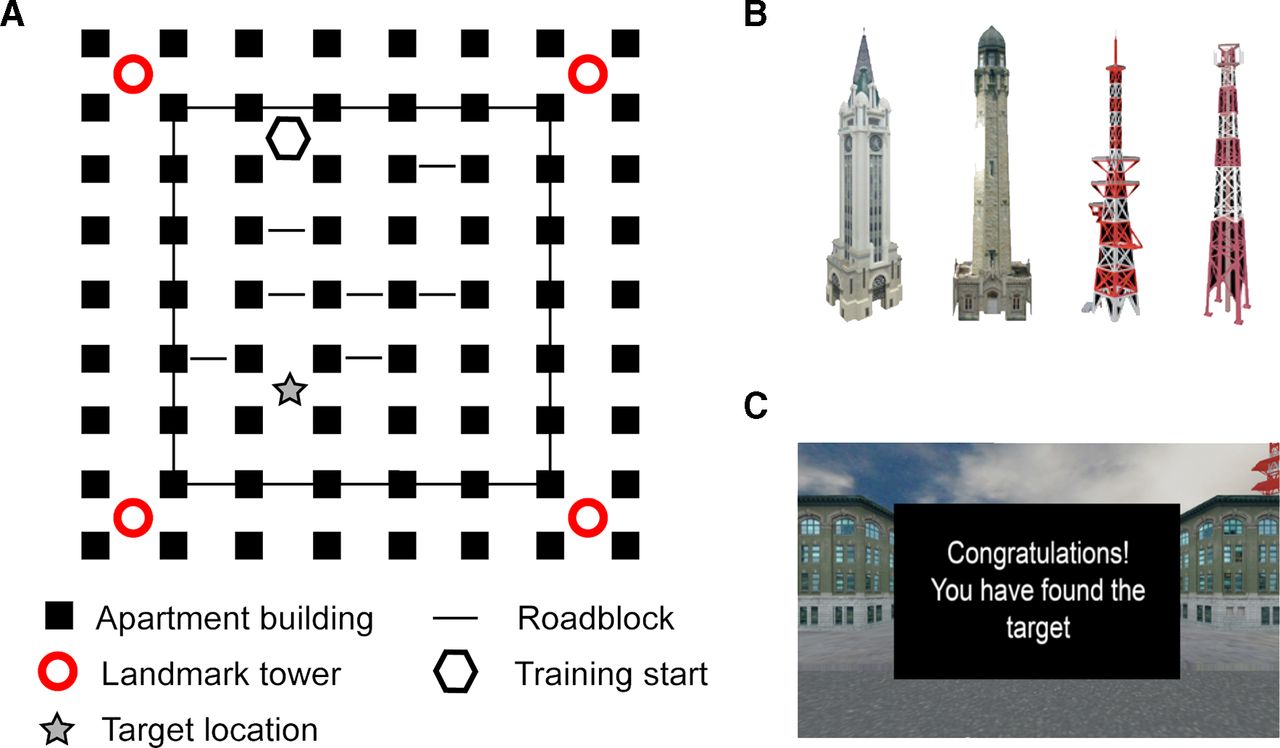
Spatial navigation task. (A) Navigation occurred in a five block by six block city environment. (B) Each corner of the environment had a different landmark tower that could serve as a global location indicator. (C) On crossing into the target intersection from any direction during training trials, participants saw a feedback screen.
Serum DNRAb assays were performed by ELISA with the DWEYS consensus sequence as the substrate as previously described.34 The cut-off for normal was the mean +2 standard deviations (SD) of serum levels from 10 separate healthy control subjects used in the laboratory.
Imaging
SLE participants and 25 IHCs underwent FDG-PET imaging following an overnight fast, as described in detail elsewhere.35 Scanning was conducted in 3D mode using the GE Advance tomograph (General Electric Medical Systems, Milwaukee, Wisconsin, USA) at the FIMR. Autoradiographic PET images were acquired for 20 min beginning 35 min after the injection of 3.5 mCi FDG in an eyes-open rest state in a dimly lit room with minimal auditory stimulation. Following scan preprocessing in SPM5 (Institute of Neurology, London, UK), individual images were non-linearly warped into Talairach space using a standard PET template and smoothed with an isotropic Gaussian kernel (10 mm) in all directions to improve the signal-to-noise ratio. Investigators were blinded to participant clinical status during data acquisition and analysis.
Statistical analysis
Clinical analyses
Clinical and demographic characteristics of the SLE participants and nine NHCs are presented as frequencies and/or compared between groups using the two-sample Student’s t-test, χ2 or Fisher’s exact tests, as appropriate. For additional comparisons, SLE participants were stratified by serum DNRAb status (DNRAb- for normal range and DNRAb+ for high serum levels) and based on SNT performance (SNT+ for SLE participants successfully completing the training trials and SNT− for SLE participants unable to locate the target).
FDG-PET analyses
To identify brain regions specifically associated with SNT performance, a voxel-wise search of whole brain volume using the SPM5 two-sample t-test option was performed comparing FDG-PET scans between the SNT+ and SNT− SLE subgroups. SPM (T) maps were then created, and peak voxels were considered significant at the threshold of T>3.65, p<0.001, uncorrected. Voxels were further evaluated for significance at p<0.05, corrected at the cluster level, as well as with family-wise error rate and false discovery rate corrections for voxel height. For significant regions identified in this analysis, volumes-of-interest (VOI) analyses were used to measure regional metabolism in each of the SLE and IHC participants. VOI metabolism in each region was compared between the whole group of SLE participants and IHCs using Student’s t-test. A one-way analysis of variance (ANOVA) was used to compare the SLE SNT+ and SNT− subgroups with the IHC group, followed by post hoc Bonferroni tests to correct for multiple comparisons. Additionally, Student’s t-tests were used to compare resting glucose metabolism in each of the three hypermetabolic regions previously identified as abnormal in SLE5 6 between the SNT+ and SNT− subgroups.
FDG-PET and clinical correlations
Relationships among resting regional metabolism and clinical/demographic parameters were examined in the SNT+ and SNT− SLE participants using Pearson’s correlations. If regional metabolism or a clinical measure (eg, disease duration) were found to correlate with age in SLE participants, multiple regression models were used to further examine relationships between regional metabolism and multiple predictor variables (eg, disease duration and age) in the SNT+ and SNT− SLE participants. These models included regional metabolism as the predicted variable and disease duration and age as the two predictor variables, in order to demonstrate the independent effect of one predictor (ie, disease duration) on regional metabolism after accounting for potential confounding effects of the other predictor (ie, age).36 37 Statistical analyses were performed using SAS V.9.4 or SPSS V.23. All tests were two sided, and significance was set at p<0.05.
Results
Participant characteristics and cognitive performance
Characteristics of all SLE participants and subset by SNT performance are shown in table 1 with the nine NHC demographics. Overall, the NHCs had significantly more years of education and scored lower on the BDI than the SLE participants; however, scores lower than 13 on the BDI are considered clinically insignificant.31 BDI scores ranged from 0 to 16 for SLE subjects and 0–7 for the NHCs. Using cut-off scores for the BDI,31 6/19 (31.5%) of the SLE subjects had mild depressive symptoms, and the rest scored in the normal range as did all of the NHCs. The possible range of scores for STAI is 20–80 with a suggested cut-off of 39–40 for clinically significant symptoms.38 39 SLE STAI scores ranged from 20 to 50; 4/19 (21%) of SLE had scores consistent with clinically significant symptoms, and the rest scored less than 39 as did all of the NHCs. There were no significant differences between the SLE groups in sex, race, disease duration, current medication use, computer experience, serology, depression or anxiety scores and ANAM test scores. The SNT− group was significantly older (p=0.002) than the SNT+ group and had fewer years of education (p=0.035). Importantly, due to the association between antiphospholipid antibodies and microinfarcts in the brain,40 none of the SLE participants had anticardiolipin antibodies, and only one in the SNT+ group had a positive lupus anticoagulant. Although not statistically significant, a trend of difference in high titres of serum DNRAb (p=0.096) was noted between the SLE SNT+ group (2/8; 25%) and the SNT− group (7/11; 64%) (table 1).
Subject characteristics
Compared with the NHC subjects, evaluation of SNT performance in SLE participants stratified by DNRAb status highlights a significant association between DNRAb and poor SNT performance. Ages of the nine NHCs and the SLE participants were not different in either DNRAb+ or DNRAb+ groups (table 2). The SLE DNRAb+ group, with a target success rate of 2/9 (22%), performed significantly worse on the SNT (p=0.037) than the NHC group with a target success rate of 7/9 (78%). Conversely, the SLE DNRAb− group performed similarly (p=0.810) to the NHCs with a success rate of 6/10 (60%).
Performance on the spatial navigation task as a function of age and DNRAb status
The total number of moves performed during the training trials was equivalent across all groups. However, compared with the SNT+ group, the SNT− participants had significantly increased total search area and total number of turns, thereby demonstrating adequate motivation to complete the task despite continued inability to find the target.
Increased regional resting metabolism associated with SNT performance
To identify brain regions specifically associated with SNT performance in SLE, a whole-brain, voxel-wise SPM analysis comparing FDG-PET scans of the 8 SNT+ and 11 SNT− participants revealed seven regions with significantly higher resting metabolism (p<0.001, peak voxel; table 3) in the SNT+ group, including the left anterior putamen/caudate, right anterior putamen, left and right prefrontal cortex/BA9, right prefrontal cortex/BA10, left lateral and medial frontal cortex/BA 8 (figure 2). Four of these regions, including the left (BA 9) and right (BA 10) prefrontal cortex, and the left lateral (BA 8) and medial frontal cortex (BA 8), were also significant at p<0.05, corrected for cluster extent (table 3).

Brain regions specifically associated with spatial navigation task (SNT) performance in SLE. Voxel-wise comparison of the FDG-PET scans between 8 SNT+ and 11 SNT− SLE subjects revealed significant increases in resting glucose metabolism in seven brain regions in the SNT+ group, including (A–G) the left anterior putamen/caudate, right anterior putamen, left prefrontal cortex/BA 9, right prefrontal cortex/BA 9, right prefrontal cortex/BA 10, left lateral frontal cortex/BA 8 and left medial frontal cortex/BA 8. (Peak voxel of each cluster was significant at p<0.001 (table 3), and clusters were displayed using a red–yellow scale thresholded at p<0.005 superimposed on a MRI template.). In these seven regions specifically associated with SNT performance, metabolism in the SNT+ SLE subjects (filled triangles) was significantly higher than the SNT- SLE Subjects (open triangles; p<0.006; post hoc Bonferroni tests) and the imaging healthy controls (IHCs) (open circles; IHCs; p<0.02; except in the right prefrontal cortex/BA 9: p=0.38). (Error bar represents SE of the mean. Arrow represents post hoc Bonferroni tests of SNT+ SLE subjects vs SNT− SLE subjects. *P<0.05, **p<0.01, ***p<0.001, post hoc Bonferroni tests of SLE SNT+ or SNT− subjects vs IHC group.)
Brain regions with significant differences in metabolic activity between 8 SNT+ SLE and 11 SNT− SLE subjects
VOI analyses demonstrated no differences in resting metabolism between the combined SLE groups (SNT+ and SNT−) and 25 IHCs in all seven regions (p>0.15; Student’s t-tests). However, one-way ANOVAs comparing the SNT+ subgroup, the SNT− subgroup and the IHC group demonstrated significant differences in resting metabolism across the three groups in each of the seven regions (p<0.006; table 3). Post hoc Bonferroni tests further showed that the SNT+ participants demonstrated abnormally increased metabolism (p<0.02) compared with the IHC subjects in all regions except the right prefrontal cortex/BA 9 (p=0.38) (figure 2; table 3). Conversely, compared with the IHCs, the SNT− participants demonstrated significantly decreased metabolism in the right prefrontal cortex/BA 9 and BA 10 (p<0.05; post hoc Bonferroni tests) but no significant differences (p>0.05) in other five regions (figure 2, table 3). Moreover, there were significant differences in resting metabolism between the SNT+ and SNT− subjects in all seven regions (p<0.006; post hoc Bonferroni tests; figure 2; table 3), consistent with the results of the SPM analysis. These data suggest that successful SNT performance by SLE participants is associated with resting hypermetabolism in the anterior putamen/caudate and frontal/prefrontal cortex, while failed SNT performance is associated with normal or decreased metabolism in these brain regions.
As previously reported,5 resting metabolism in the hippocampus, orbitofrontal cortex and posterior putamen/globus pallidua/thalamus was significantly increased in the combined SLE group compared with IHCs (p<0.008; Student’s t-tests; data not shown). However, metabolism in these three regions was not different between the SNT+ and SNT- SLE subgroups (p>0.07; Student’s t-tests).
Correlations between resting metabolism in SNT-associated regions with age, disease duration and serum DNRAb titres
In the combined SLE group (SNT+ and SNT−), there were significant inverse correlations between disease duration and resting metabolism in five of the seven SNT-associated regions, including the left anterior putamen/caudate (r=−0.63, p<0.005), right anterior putamen (r=−0.49, p<0.04), left lateral frontal cortex/BA8 (r=−0.53, p<0.02), left medial frontal cortex/BA8 (r=−0.51, p<0.03) and right prefrontal cortex/BA10 (r=−0.56, p<0.02). There were also significant inverse correlations between age and resting metabolism in the combined SLE group in four of the seven SNT-associated regions (left anterior putamen/caudate (r=−0.48, p<0.04), left medial frontal/BA8 (r=−0.59, p<0.009), right prefrontal/BA 9 (r=−0.46, p<0.05) and right prefrontal/BA 10 (r=−0.47, p<0.05). In contrast, the IHC group did not demonstrate any correlations between age and metabolism in the seven regions (p>0.27).
Because a significant correlation was found between age and disease duration (r=0.60, p<0.007) in the whole SLE group, and the SNT+ group had significantly younger age (p<0.003) and relatively shorter disease duration (p=0.09) than the SNT− group (table 1), correlations of regional metabolism with disease duration could be partially influenced by confounding effects of age. Results of a multiple regression model to determine the effect of disease duration on resting metabolism in each SNT-associated region independent of age, demonstrated that the inverse relationship between regional metabolism and disease duration remained significant in the left anterior putamen/caudate (p<0.05) after controlling for age (p=0.50). Metabolism in the other six regions, however, did not correlate independently with either disease duration (p>0.10) or age (p>0.09). These data suggest that the left anterior putamen/caudate is the only SNT-associated region where metabolism was found to correlate independently with disease duration, while age is not a significant factor driving the changes in regional metabolism in any of the SNT-associated regions.
There was a non-significant trend towards increased DNRAb sero-positivity in the SNT− compared with the SNT+ group (78% vs 22% DNRAB+, respectively, p=0.17); however, no significant correlations were found between resting metabolism in all seven regions and serum DNRAb titres (p>0.29).
Distinct functional associations of anterior and posterior putamen metabolism in SLE
The SNT+ participants have increased resting metabolism in the anterior putamen compared with the SNT− participants and IHCs, even though metabolism in this area in the combined SLE groups (SNT+ and SNT−) did not differ from the IHCs (p=0.15) (figure 2, table 3). In contrast, as reported previously,5 6 the posterior putamen showed significant abnormal hypermetabolism in the combined SLE groups compared with IHCs (p<0.0001) that correlated modestly (p=0.05) with poor performance on the ANAM running memory continuous processing test (continuing processing test, which is a non-spatial test that measures working memory and attention), although metabolism in the posterior putamen did not differ between the SNT+ and SNT− groups (p=0.31). Therefore, the anterior and posterior putamen are affected differently in SLE participants, and the metabolic activities in these two parts of the putamen associate with different cognitive functions.
Discussion
Based on the murine model of DNRAb-mediated neurotoxicity of CA-1 hippocampal neurons resulting in impaired spatial memory and previously demonstrated associations between spatial memory and serum DNRAb titres in human SLE participants,5 we sought to extend this line of inquiry to incorporate a novel SNT. The choice of spatial navigation as the assessment was motivated by the expectation that a dynamic task would provide a complementary measure of clinical impairment to the single relational spatial memory task used previously.5 Additionally, SNTs have been shown to elicit activity from several brain regions previously reported as having abnormal resting hypermetabolism in SLE.5 16 19 20 As expected, more than half of the SLE participants enrolled were unable to successfully complete the SNT, and high serum DNRAb titres were associated with inability to complete the task. Previously reported abnormal resting hypermetabolism in the hippocampus, orbitofrontal cortex and posterior putamen/globus pallidus/thalamus in SLE compared with healthy control participants did not correlate with SNT performance. However, an unbiased, voxel wise approach comparing the SLE SNT+ and SNT− groups revealed a distinct neural loop composed of regions in the anterior putamen/caudate and frontal cortex. Hypermetabolism in these regions associated with successful SNT completion, whereas hypometabolism associated with inability to complete the SNT. In particular, the anterior putamen/caudate, subcortical nuclei within the basal ganglia associated with procedural learning, stood out as a region that correlated independently with SNT performance and disease duration after controlling for age. These findings are consistent with previous studies identifying the roles of the caudate and frontal cortex in navigation19 20 and suggest that the SNT may be a potential biomarker for SLE-CD.
Previous studies of spatial navigation among the healthy population indicate that the anterior caudate becomes active during egocentric, step-by-step navigation following a predetermined sequence of moves or heavily practiced route.19 20 Accordingly, the left and right anterior putamen/caudate were two of the seven regions associated with SNT performance in the SLE participants. Moreover, following the multiple regression model analyses demonstrating that age is not a significant factor driving regional metabolism, the left anterior putamen/caudate continued to be associated with disease duration and SNT performance. Our cross-sectional results suggest a continuum of evolving metabolism in the anterior putamen caudate such that, as disease duration progresses, there is an initial increase in resting metabolism associated with ability to complete the SNT followed by a decline in resting metabolism to normal or subnormal levels and inability to complete the SNT. This hypothesis will need to be confirmed in a longitudinal study.
Increased PET signal indicates metabolic hyperactivity that may represent increased neuronal activation, increased neuronal density, local inflammatory processes and microglial cell activation or disinhibition due to damage from a remote but connected region.41–44 The resting hypermetabolism in the anterior putamen/caudate and frontal cortex reported here suggests that increased neuronal function and/or recruitment for stimulus-response conditioning may be a compensatory mechanism in order to successfully complete the SNT. The concept of compensatory neuronal recruitment in neurodegenerative diseases such as multiple sclerosis and Alzheimer’s disease is well established.45–47 Using functional MRI (fMRI) during a modified Sternberg memory task, we previously reported findings suggestive of increased cortical recruitment in SLE participants with new onset disease (<2 years) compared with those with longer disease duration (>10 years).48 Others have also used fMRI during task performance in SLE participants and reported evidence of increased neural recruitment in multiple cortical areas including increased hippocampal connectivity to other cortical regions.49–52 Longitudinal studies are necessary to determine whether the observed hypermetabolism remits over time along with ability to complete the SNT, as suggested by the correlations with age and disease duration in this cross-sectional study.
Although high serum DNRAb titres were associated with poor performance on the SNT in this cohort, they did not correlate significantly with metabolism in the SNT-associated regions. While this may be a function of small sample size, the lack of correlation between DNRAb serum titres and metabolism in the anterior putamen/caudate and frontal cortex may also reflect DNRAb-mediated neurotoxicity to other important regions such as the hippocampus.12 14 FMRI studies in healthy individuals engaged in a different virtual navigation task have demonstrated significantly increased BOLD activity in the hippocampus and orbitofrontal cortex or prefrontal cortex early in spatial learning, depending on whether a spatial, wayfinding strategy or response learning strategy is employed to find the target.21 53 Specific lesions in murine studies that disrupt hippocampal–prefrontal cortex connections result in impaired spatial learning.54 55 Thus, it is possible that DNRAb-mediated neuronal toxicity in the hippocampus may result in reduced communication between the hippocampal–prefrontal cortex and caudate. As suggested by our findings, early in the disease process, this results in compensatory neuronal recruitment in the regions normally responsible for spatial learning. However, as disease duration lengthens, our results suggest that the neuronal recruitment is lost along with the ability to complete the SNT.
The current study illustrates the importance of test selection for individual components of cognitive performance and the invaluable contributions from the mouse model. Appreciation of the selective effects of DNRAb on spatial performance in the murine model has previously informed our choice of a static spatial memory task over traditional neuropsychiatric batteries.12 However, assessing the spatial relationship between two objects on a screen is categorically different than physical movement through an environment to explore a maze or examine physical objects, as was done in the murine experiments. Using the SNT, we attempted to mimic the dynamic movement through an environment as in the murine experiments. Not surprisingly, successful SNT performance in the SLE participants was associated with resting activation of selective regions in the anterior putamen/caudate and frontal cortex, as reported in healthy individuals.19 20 23 24 Additional associations between SNT performance and serum DNRAb titres suggest that the SNT may provide a unique test for SLE-CD.
Our study is limited by the lack of FDG-PET imaging on the healthy controls who also completed the neuropsychological tests, making it impossible to compare relationships between brain metabolism and SNT performance in a healthy sample. Additionally, the associations drawn here are based on separate testing of SNT performance and resting metabolism, rather than concurrent functional imaging such as fMRI. The small sample size may also have limited detection of significant associations between DNRAb and metabolism. Therefore, our results may be considered as proof-of-concept findings of SNT performance in SLE associated with serum DNRAb titres and regional brain metabolic abnormalities that need to be validated in future studies with larger samples.
In summary, we have demonstrated the potential of a novel SNT for assessment of SLE-CD. Performance on the SNT is associated with serum DNRAb titres and resting glucose metabolism in regions known to orchestrate spatial navigation. Additional longitudinal studies are necessary to validate these findings; however, addition of dynamic navigation tasks to our battery of cognitive testing will likely increase the sensitivity and specificity of these assessments for SLE-CD. Improved characterisation of cognitive status will allow for more targeted and timely interventions that may improve quality of life for SLE participants.
Acknowledgments
The authors would like to thank all of the patients and healthy individuals who contributed to this study. They would also like to thank Andrew Shaw for his dedication to this study, help with subject recruitment and scheduling and overall support.
References
Footnotes
EP, CT and MM are joint first authors.
Contributors Study concept and design: EP, CT, MM, JS, BB, PW, BV, BD and DE; acquisition of data: EP, CT, EA, BB, SK, CA and CS; analysis and interpretation of data: EP, CT, MM, MS, CA, BV, BD and DE; main manuscript text: EP, CT, MM and MS. All authors contributed to manuscript drafting and revisions, with final approval prior to submission.
Funding This work was supported by a grant from the National Institute of Allergy and Infectious Diseases at the National Institutes of Health (research grant 1P01AI073693).
Competing interests None declared.
Patient consent for publication Not required.
Ethics approval The research was in compliance with the Helsinki Declaration and approved by the Institutional Review Board and the Institutional Radioactive Dose Research Committee of the Northwell Health System.
Provenance and peer review Not commissioned; externally peer reviewed.
Data availability statement Data are available on reasonable request.