Article Text

Abstract
Objective To examine the relationship of baseline clinical, radiographic, molecular and MRI measures with structural progression (subregional MRI-based femorotibial cartilage loss) in knee osteoarthritis (OA).
Methods Single knees of 75 female participants with radiographic knee OA (and 77 healthy control participants) were examined over 24 months using MRI. Subregional femorotibial cartilage thickness was determined at baseline and follow-up. Baseline clinical, radiographic, molecular (n=16) and quantitative MRI-based measures of the meniscus and cartilage, including delayed gadolinium-enhanced MRI (dGEMRIC) and T2, were obtained. Differences in these baseline measures between radiographic osteoarthritic knees with longitudinal cartilage thinning (or thickening) and those with no significant change were evaluated by receiver operator characteristic analyses and Wilcoxon rank sum tests.
Results The relatively strongest predictors of longitudinal cartilage thinning were reduced baseline cartilage thickness in the medial femur (area under the curve (AUC)=0.81), varus malalignment (AUC=0.77), reduced minimum joint space width and a greater radiographic joint space narrowing (JSN) score (both AUC=0.74). These remained significant after adjusting for multiple comparisons using false discovery rates. Reduced bone resorption (C-terminal telopeptide of type I collagen; AUC=0.65) and a low dGEMRIC index (reflecting low proteoglycan content) in the medial tibia (AUC=0.68) were associated with longitudinal cartilage thinning, but failed to reach statistical significance after correction for multiple testing in this (small) sample.
Conclusions This exploratory study indicates that baseline molecular or MRI cartilage compositional markers may not provide better discrimination between knees with cartilage thinning and those without longitudinal change than simple radiographic measures, such as greater JSN score.
Statistics from Altmetric.com
Introduction
Knowledge about risk factors of disease progression is important for clinically managing knee osteoarthritis (OA), as identification of people at high risk may affect the advice given on lifestyle and medical treatment. Further, knowledge about risk factors is relevant in clinical trials that aim to enrich study populations with fast progressors, to demonstrate effectiveness of (structure-modifying) treatments within reasonable observation periods.1 2 One review found little evidence for predictors of radiographic progression of knee OA,3 but radiography has methodological limitations in evaluating disease progression, with MRI having been shown to display a greater sensitivity to longitudinal change4 and a better prediction of clinical outcomes, such as total knee arthroplasty.5
Risk factors for progression of knee OA that were identified based on cartilage loss measured with MRI include malalignment,6,–,8 advanced radiographic osteoarthritis (ROA),9,–,11 trabecular bone texture,12 meniscal pathology7 13 14 and bone marrow alterations.15 16 Studies on the predictive value of molecular markers (from serum, urine or joint fluids) for radiographic progression of knee OA17,–,25 or cartilage loss measured with MRI26,–,30 have, however, provided conflicting results. Also, these studies assessed only a limited number of markers in parallel, making it difficult to evaluate their relative performance.
MRI can also provide information on cartilage composition,31,–,34 and these changes are thought to occur early, before cartilage is lost. To our knowledge, however, only one study has examined the predictive value of a compositional cartilage measure in the context of structural progression of knee OA in a small cohort of (16) knees.35
The purpose of this study was, therefore, to provide a comprehensive and direct comparison of clinical, radiographic, molecular and MRI markers of several tissues (meniscus, cartilage) as predictors of subregional cartilage loss (measured with MRI)11 36 in knees with radiographic knee OA at baseline. Specifically, we examined whether molecular markers in biological fluids and MRI markers of cartilage composition are better at discriminating between OA knees with longitudinal cartilage thinning and OA knees with no (significant) cartilage thickness change than standard baseline measures. For descriptive purposes, baseline results for the same biomarkers are also provided for healthy reference knees without symptoms or ROA.
Methods
Study sample
This analysis relied on results from the A9001140 study, an observational, natural history study, including 180 women, of whom 152 (age 56.7±8.6 years) completed baseline and month 24 visits.11 36 37 Of these, 75 had knee ROA and 77 were healthy controls. The participant characteristics,11 37 selection of knee (one for each participant),11 37 reliability of the MRI-cartilage-outcomes,38 39 magnitude and sensitivity to change11 39 and locations of preferential subregional cartilage thinning11 36 were previously reported. In brief, inclusion criteria for ROA participants were mild to moderate radiographic OA (Kellgren Lawrence grade (KLG) 2 or 3) in the medial femorotibial compartment (MFTC) in conventional weightbearing, extended anterior-posterior (AP) radiographs, medial disease defined by MFTC minimum joint space width (mJSW) smaller than lateral mJSW, a medial mJSW of ≥2 mm in Lyon schuss (LS) radiographs40 41 and a body mass index (BMI) of ≥30 kg/m2. Healthy control participants showed no symptoms or radiographic knee OA (KLG0) in AP radiographs bilaterally, and a BMI ≤28 kg/m2.11 36 Imaging was carried out at seven clinical centres38; separate readings of the KLG were obtained from AP and LS radiographs.36 Seventy-seven knees with KLG0 on both the AP and LS radiographs were considered the ‘healthy reference’. The other 75 knees were KLG>0 in either the AP or LS radiograph, the disease status ranging from possible ROA (KLG1; n=5) and no symptoms to definite ROA with many symptoms. The rate of change in KLG3 knees was −1.4% a year in medial tibia (MT) and −1.9% in medial weightbearing femur (cMF), whereas changes in KLG2 knee and healthy knees were less (>−0.4%).25
Quantitative measurement of progression
Double oblique coronal MRI acquisitions were obtained at baseline and 24 months, using water excitation spoiled gradient echo sequences at 3 Tesla.11 36 38 39 Segmentation of the femorotibial cartilage plates (MT, medial tibia; cMF, medial weightbearing femur; LT, lateral tibia; cLF, lateral weightbearing femur) was performed by experienced operators (Chondrometrics GmbH, Ainring, Germany), with blinding to time points.11 36 Annualised rates of change in mean cartilage thickness (ThCtAB) were determined for femorotibial compartments, plates and 16 (medial and lateral) subregions (Figure 1).11 36 42 The cut-off points (of subregional cartilage thickness change) used to define ROA knees with progression (significant thinning or thickening) versus those without significant change were developed previously36 and were applied to the current analysis.
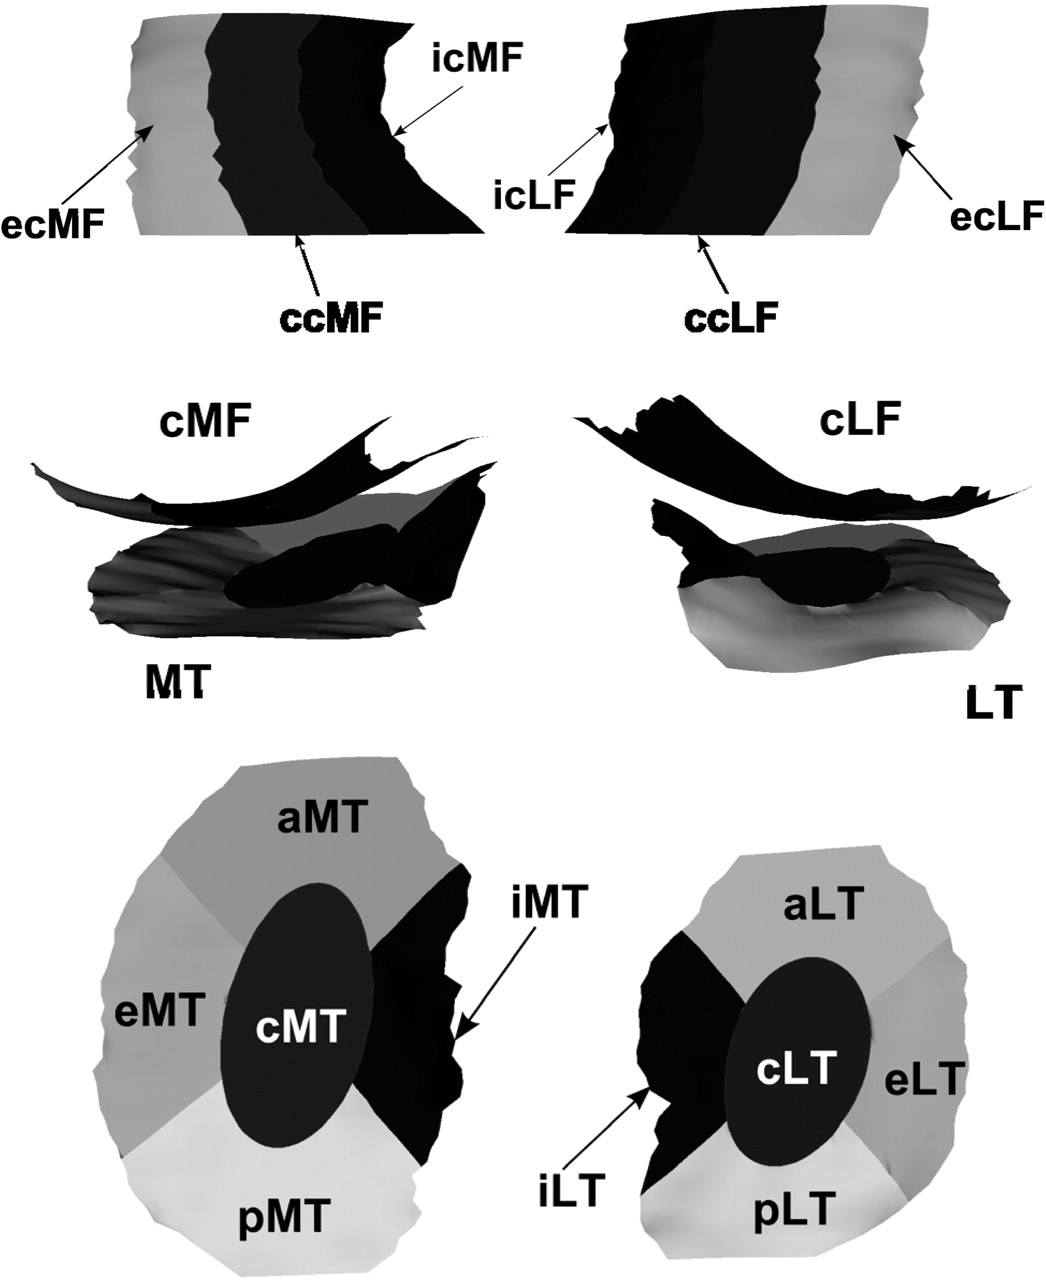
Graph showing the femorotibial subregions in which cartilage change was determined over 24 months, to dichotomise radiographic osteoarthritic knees into those with change (cartilage thinning or thickening) and into those with no significant cartilage change (please see Buck et al36). In this analysis, results from the medial femorotibial subregions were used. (Top) Weightbearing femoral condyles viewed from inferior; (middle) femorotibial compartment viewed from posterior; (bottom) tibiae viewed from superior. a, anterior; c, central; cLF, weightbearing lateral femur; cMF, weightbearing medial femur; e, external; i, internal; LT, lateral tibia; MT, medial tibia; p, posterior.
Of the 75 ROA knees, 43 showed no (significant) change in any medial femorotibial subregion, 17 showed cartilage thinning only in at least one subregion, 11 displayed thickening only and 4 showed both thinning and thickening (in different subregions).36 Of these four knees, two had (significant) thinning in two subregions, but marginally significant thickening in one subregion and were classified as having thinning.36 The other two subjects had one subregion each of marginal thinning and thickening and were classified as having no change.36 Thus, of 75 ROA knees, 45 were considered to have no change and 19 cartilage thinning.
Baseline predictors of cartilage thinning
Age, BMI and Western Ontario and McMaster Universities (WOMAC)43 pain, stiffness and function scores were recorded during recruitment. Osteoarthritis Research Society International atlas44 45 osteophyte (OP) scores in MT and cMF, joint space narrowing (JSN) scores, mJSW measures and the knee anatomical axis angle (AAA)46 were determined from LS radiographs.
Molecular markers evaluated in the plasma (p), serum (s), or urine (u), the latter normalised to creatinine (Cr), included:
bone formation: sIntactPINP (N-propeptide type I procollagen);
bone resorption: sCTXI (C-terminal telopeptide of type I collagen) and uTINE (C-telopeptide and intrahelical type I collagen neoepitopes);
cartilage synthesis: pNPII (N-propeptide type II procollagen47), sCPII (C-propeptide type II procollagen) and sPIIANP (N-propeptide type IIA procollagen);
cartilage degradation: uCTXII (C-terminal telopeptide of type II collagen), uTIINE (C-telopeptide and intrahelical type II collagen neoepitope48 49), sCOMP (cartilage oligomeric matrix protein) and uARGS (aggrecan ARGS neoepitope50 51);
inflammation/synovitis: p15HETE (hydroxyeicosatetraenoic acid), pPGE2 (prostaglandin E2), uOsteop (osteopontin neoepitope peptide), sPIIINP (N-propeptide type III procollagen), uTIIINE (intrahelical type III collagen neoepitope) and p3-NT (3-nitrotyrosine52).
Natural log-transformed values were used in the analyses. For technical details and units of measurement, see online supplementary appendix 1 and table 1.
Mean values and variability of clinical, radiographic, molecular and MRI-based risk factors in healthy reference knees and knees with radiographic osteoarthritis (ROA)
The height and subluxation of the medial meniscus, and covering (percentage of tibial plateau) were measured in the coronal plane using eFilm workstation software.14 53
The delayed gadolinium-enhanced MRI (dGEMRIC) index (as a measure of proteoglycan content) was derived from sagittal inversion recovery spoiled gradient recalled echo MRI, using five inversion times (2100, 800, 400, 200 and 130 ms). Repetition times were 2330–360 ms, the echo time 2.7 ms, the flip angle 15° and the resolution 3.0×0.625×0.625 mm. Double dose Gd-DTPA2 (Magnevist, Bayer Schering Pharma AG, Berlin, Germany) was administered intravenously, subjects were then asked to walk for 10 min and acquisitions took place 59–110 min after injection. The images from the five inversion times were registered to each other and to the three-dimensional (3D) cartilage segmentations to calculate T1 values using a pixel-wise three-parameter fit.54 ‘Effective’ T2 values were derived as a surrogate of cartilage collagen content, orientation and hydration, using sagittal fat-saturated turbo/fast spin echo sequences (TR=2700–3600 ms, TE=9, 40 ms) with the same spatial resolution as dGEMRIC. T2 values were calculated from a pixel-wise linear fit of the dual echo. Mean values of dGEMRIC and T2 and within-individual SDs (as a measure of heterogeneity) were extracted for the same 3D regions of interest (MT and cMF), in which the cartilage thickness was determined.
Statistics
For descriptive purposes, the baseline predictor variables were first compared between ROA and healthy knees (table 1); however, formal statistical testing was not performed for factors used to classify knees in either of these groups. Differences in baseline values of predictor variables were then compared between knees with cartilage thinning (n=19) versus those with no change (n=45), and in those with thickening (n=11) versus those with no change. The Wilcoxon rank sum test was used to determine which baseline predictors differed between groups; the area under the curve (AUC) from the receiver operator characteristic curve was additionally computed, as it has better interpretive value. Results for ordinal measures (OP and JSN scores) were determined using the Fisher exact test. False discovery rates (α=0.05) were used to determine which factors were statistically significant after correcting for multiple statistical testing (30 comparisons between ROA vs healthy, and 36 between longitudinal thinning/thickening vs no change). If a factor had p<0.05, but was not significant after correction, it was considered borderline significant.
Results
The demographic data, WOMAC, OP and JSN scores and medial mJSW for the 77 healthy reference and the 75 ROA subjects are shown in table 1. Compared with healthy knees, ROA knees had statistically significantly lower mean knee AAA (more varus, AUC=0.69), greater meniscus subluxation and height, smaller meniscus cover (AUC=0.62–0.70), reduced mean dGEMRIC index in MT/cMF (AUC=0.74/0.73), elevated mean and within-person SD of T2 in MT (AUC=0.63/0.62) and a greater baseline cartilage thickness (ThCtAB) in MT (AUC=0.61) (table 1). ROA subjects had elevated cartilage degradation marker levels (uCTXII, uTIINE), reduced levels of one of three cartilage synthesis markers (sCPII) and increased levels of some inflammation/synovitis markers (p3-NT, pPGE2, sPIIINP) (table 1). ROA knees showed a greater within-person SD of dGEMRIC in cMF, but this was only borderline statistically significant.
ROA knees with cartilage thinning over 24 months' follow-up displayed significantly greater baseline medial JSN scores and lower JSW (both AUC=0.74), greater varus malalignment (AUC=0.77), and lower baseline ThCtAB in cMF (AUC=0.81) than ROA knees with no significant change (table 2). ROA knees with cartilage thinning also showed greater WOMAC stiffness and function scores, an elevated OP score in cMF, reduced sCTXI levels and a reduced mean dGEMRIC index in MT compared with knees with no significant change, but these relationships were only borderline statistically significant.
Prognostic value of clinical, radiographic, molecular and MRI-based risk factors: mean values and variability in knees with radiographic osteoarthritis (ROA) which displayed no change in cartilage thickness (no progression) vs those which displayed cartilage thinning over 24 months
ROA knees with cartilage thickening over 24 months displayed greater baseline WOMAC function scores (AUC=0.69) and lower mean T2 in cMF (AUC=0.68), these relationships being borderline statistically significant (online supplementary table 1).
Of ROA participants with cartilage thinning (thickening), 42% (54%) showed weight loss, 47% (28%) weight gain and 11% (18%) no change over 24 months; in ROA participants with no cartilage change these numbers were 49% (weight loss), 42% (gain) and 9% (no change).
Discussion
In this study, we compared a large set of baseline clinical, radiographic, molecular and MRI measures between knees with and without structural progression, using MRI-based cartilage loss as an outcome.11 36 Specifically, we examined whether molecular markers in biological fluids and MRI markers of cartilage composition provide discrimination between ROA knees with longitudinal cartilage thinning and those without cartilage thickness change than standard baseline measures.
The strongest predictors of longitudinal cartilage thinning (vs ROA knees with no change) were those of advanced (structural) disease, including greater baseline JSN scores, reduced mJSW, reduced cartilage thickness in cMF and varus malalignment. A bone resorption marker (sCTXI) was the only one among 16 molecular markers that was borderline significant; a low mean dGEMRIC index in MT (reflecting a lower proteoglycan content) also attained borderline significance, but neither was significant after correction for multiple testing. The same was found for an elevated medial femoral OP score and WOMAC function and stiffness scores.
Limitations of the study include the small sample size, in particular for the relatively large number of baseline factors studied. Hence, the study is exploratory, looking at the overall pattern of associations of different markers with cartilage change. The study was not designed to formally test whether a certain marker performs significantly better than another one, and it may not have had adequate power to detect such associations and differences. The interpretation is based on qualitative interpretations of the overall pattern of significant and non-significant associations; results should thus be interpreted with care and be repeated in other (and larger) samples. Also, this paper does not examine symptomatic progression of knee OA, and relationships with symptomatic/functional progression may be different from those reported here. Structural progression was defined using a validated MRI outcome of longitudinal cartilage thinning55 56 and without use of an (arbitrary) threshold, but by direct comparison with the changes/random errors in a relatively large group of healthy reference subjects.36 Sensitivity analyses comparing knees with cartilage thinning (n=19) with all other ROA knees (those with no significant change or with cartilage thickening (n=56)) produced similar results and identical conclusions.57
Despite the small sample size, known risk factors for (structural) knee OA progression (such as markers of advanced structural disease and varus malalignment) provided highly significant discrimination between ROA knees with longitudinal cartilage thinning and those with no significant change. Therefore, the relative performance of other clinical, radiographic, molecular and MRI markers can be accurately compared against these known risk factors, despite the small sample. Adjustment for multiple comparisons was performed using false discovery rates.58 Factors that were significant before (but not after) adjustment should, however, not be entirely be dismissed, because a large series of factors was tested in this exploratory study with a limited sample size.
Age and BMI were not significantly associated with structural progression in this and in previous studies.3 59 Because a high BMI>30 was a selection criterion for the ROA cohort, however, this finding needs to be interpreted with care, as the range of BMI in the ROA groups was limited.59 Although radiographic studies did not reach consensus as to whether advanced (radiographic) disease stage is associated with greater rates of progression, recent MRI studies did.9,–,11 The results obtained here thus agree with these reports, and they are also in agreement with another study showing higher rates of progression in knees with low baseline cartilage thickness.60 The finding of increased baseline WOMAC stiffness and function scores in ROA knees with cartilage thinning also may be an expression of advanced (structural) disease; however, larger studies will need to explore whether these clinical factors are predictive also when adjusting or stratifying for structural disease status.
Although uCTXII and uTIINE (both markers of cartilage degradation) were significantly elevated in ROA compared with healthy volunteers, they did not predict longitudinal cartilage thinning versus ROA knees with no change (p=0.61). This is in contrast to observations by Dam et al,27 who found a significant association between CTXII and cartilage loss in 158 participants (36 with ROA at baseline) using low field (0.2 T) MRI-based cartilage loss. In their study, elevated CTXII was also associated with radiographic progression (by KLG or JSN), but did not reach statistical significance.27 Bruyere et al26 followed up 62 patients with knee OA using 1.5 T MRI and found that baseline COMP, CTXI and CTXII did not correlate with 1-year changes in cartilage thickness, but longitudinal increase in CTXII over 3 months did (p=0.04). Pelletier et al30 reported that higher baseline values of interleukin 6, C-reactive protein and COMP were predictive of greater cartilage loss with MRI, whereas Hunter et al28 found no association between urinary pentosidine and longitudinal changes in semiquantitative grades of MRI-based cartilage lesion scores.
In our study, the baseline levels for sCTXI (a bone resorption marker) were similar in ROA participants without cartilage change to those in healthy volunteers, but were reduced in ROA participants with cartilage thinning. This agrees with Berry et al,29 who reported that elevated markers of bone formation (and resorption) were associated with lower cartilage loss, but differs from others,61 who reported an association of OA progression with high bone turnover. Still, in our study the predictive value for any baseline molecular marker was less than for simple radiographic measures, such as baseline JSN score or JSW.
Quantitative MRI-based measures of meniscal status that predicted an increase in cartilage lesions scores in a previous study14 only attained borderline significance between knees with cartilage thinning and those with no change, possibly owing to the small sample size. For cartilage thickness, it is noteworthy that knees with ROA displayed greater baseline values in the tibia compared with healthy knees, as also reported previously, particularly for knees with KLG2 ROA.37 Longitudinally, reduced baseline cartilage thickness in cMF was the strongest predictor of subsequent cartilage loss, whereas baseline thickness in MT did not show a significant relationship. Among the compositional markers, a low dGEMRIC of MT reached borderline significance, as also reported in a small study in 16 knees with pain but without radiographic changes by Owman et al.35 In contrast, none of the T2 parameters differed between ROA knees with cartilage thinning and those with no (significant) change.
A limitation of our approach is that only the bulk T2 across the entire cartilage thickness was examined, and that only two echoes (derived from a pair of three echo trains) were used to estimate T2, in order to provide adequate anatomical coverage and to keep the imaging time within reasonable limits. T2 may be more accurately determined when a larger number of echoes is used and also is known to vary strongly as a function of the depth from the cartilage surface to the bone interface.62 We therefore cannot exclude the possibility that a layer-specific analysis with more than two echoes might have revealed significant results. However, a recent ex vivo study63 showed that dGEMRIC was significantly associated with cartilage mechanical properties (which are known to decline in ROA), but T2 was not.
In conclusion, the relatively strongest predictor variables of longitudinal cartilage thinning in ROA knees (compared with knees with no cartilage thickness change) were those of advanced (structural) disease, including greater baseline JSN scores, reduced mJSW, reduced cartilage thickness in cMF and varus malalignment. Reduced levels of a bone resorption marker (sCTXI) and a reduced dGEMRIC index in MT (reflecting a lower proteoglycan content) were borderline significant, but were not significant after correction for multiple testing. Hence, this study indicates that molecular markers from biological fluids or measures of cartilage composition obtained with MRI may not better discriminate between knees with longitudinal cartilage thinning and knees with no (subregional femorotibial) cartilage change than simple radiographic measures, such as greater JSN.
Acknowledgments
The authors are grateful to the dedicated group of study coordinators whose skills were essential in assuring the successful conduct of this study: Sandra Chapman, Emily Brown, Kristen Fredley, Donna Gilmore, Joyce Goggins, Norine Hall, Thelma Munoz and Kim Tally. They thank all the site investigators: Deborah Burstein, Julia Crim, Gary Hutchins, Chris Jackson, Nancy Lane, Thomas M Link, Sharmila Majumdar, Steve Mazzuca, Prasad Pottumarthi, Thomas Schnitzer, Mihra Taljanovic, Berchman Vaz and associates. They also thank the Duke Image Analysis Laboratory staff, the dedicated MRI technologists and the Pfizer A9001140 team, Peggy Coyle, Charles Packard for their invaluable efforts in conducting this study. Also the authors thank Gudrun Goldmann, Linda Jakobi, Manuela Kunz, Sabine Mühlsimer, Annette Thebis, Dr Susanne Maschek and Dr Barbara Wehr (Chondrometrics GmbH) for data segmentation, Steve Mazzuca, Kenneth Brandt and Muriel Piperno for the central reading and adjudication of the KLG scores, and John Kotyk and Jeff Evelhoch for their advice on the study design and set-up.
References
Supplementary materials
Web Only Data
Files in this Data Supplement:
Footnotes
-
Funding Pfizer.
-
Competing interests FE is CEO of Chondrometrics GmbH, a company providing MR image analysis services. He provides consulting services to MerckSerono, Novartis and received research support from Pfizer for the A9001140 study. MPHLG, ON, TS and BTW are full-time employees of Pfizer. HCC, DJH and VBK received research support from Pfizer for the A9001140 study. RB was formerly employed by Pfizer.
-
Ethics approval The study was conducted in compliance with the ethical principles derived from the Declaration of Helsinki and in compliance with local institutional review board, informed consent regulations and International Conference on Harmonization Good Clinical Practices Guidelines.
-
Provenance and peer review Not commissioned; externally peer reviewed.