Article Text

Abstract
Objective Radiographs of sacroiliac (SI) joints are used for the detection of structural damage in patients with axial spondyloarthritis (axSpA), but are often difficult to interpret. Here, we address the question how the T1-weighted MRI (T1w MRI) sequence compares with radiography for SI joints’ structural lesions using low-dose CT as the standard of reference.
Methods Radiographs, T1w MRI and low-dose CT of the SI joints from 110 patients (mean age 36.1 (19–57) years, 52% males and 48% females; 53% with axSpA, 21 non-radiographic axSpA and 32% radiographic axSpA, 47% with non-SpA) referred to the rheumatologist because of unclear chronic back pain, but possible axSpA, were scored for structural lesions (erosions, sclerosis, joint space changes and an overall impression of positivity).
Results Using low-dose CT as the standard of reference, T1w MRI showed markedly better sensitivity with significantly more correct imaging findings compared with radiography for erosions (79% vs 42%; p=0.002), joint space changes (75% vs 41%; p=0.002) and overall positivity (85% vs 48%; p=0.001), respectively, while there were no differences between X-rays and MRI-T1 sequence regarding specificity (>80% for all scores). Only for sclerosis, MRI-T1 was inferior to radiography (sensitivity 30% vs 70%, respectively), however, not statistically significant (p=0.663).
Conclusions T1w MRI was superior to radiography in the detection of structural lesion of the SI joints in patients with axSpA. Future studies should focus on finding an agreement on the definition of MRI-T1 positivity.
- Ankylosing Spondylitis
- Spondyloarthritis
- Inflammation
- Magnetic Resonance Imaging
Statistics from Altmetric.com
Introduction
The current Assessment of SpondyloArthritis International Society (ASAS) classification criteria for axial spondyloarthritis (axSpA) and the European League Against Rheumatism (EULAR) recommendations on the use of imaging in axSpA ask for radiographs to detect structural lesions and for MRI to detect active inflammatory lesions in the sacroiliac (SI) joints.1 ,2 However, several investigators have pointed out major problems with the use of radiography for SI joint evaluation. One concern is the large inter-reader variability in the interpretation of SI joint radiographs3 and the failure to improve agreement by training of rheumatologists and radiologists.4 The problems in evaluating radiographs of the SI joints are understandable because pelvic anatomy is complex, the SI joints have an oblique orientation and overlying bowel gas hampers visualisation. These disadvantages can be overcome by cross-sectional imaging techniques such as MRI and CT.5–7
While MRI has become generally accepted over recent years for the detection of active inflammatory lesions using T2-weighted sequences with fat suppression, such as the short-tau inversion recovery (STIR) sequence, its value for the scoring of structural lesions such as erosions, sclerosis, joint space variations and fatty lesions using T1-weighted images is still under debate.8 Recent EULAR recommendations on the use of MRI in SpA state that this imaging modality should be considered for the detection of both active inflammatory lesions and structural lesions,1 while the recent ASAS update on the definition of a positive SI joint MRI focuses on active sacroiliitis without an in-depth discussion of the value of MRI for the scoring of structural lesions.9 Another approach investigated whether the additional evaluation of structural lesions, such as erosions, on T1-weighted images can supplement the evaluation of inflammatory lesions on a STIR sequence and whether a combination of both would be more sensitive and/or specific for the detection of non-radiographic axSpA, in addition to the presence of subchondral bone marrow oedema, however, again without an in-depth discussion of whether T1-weighted MRI could replace radiography for the detection of structural lesions.10
Previous work found an acceptable performance of T1-weighted MRI for the detection of structural lesions of the SI joints in comparison with radiography; however, an imaging gold standard was not used in most of these studies.11 ,12 While CT is generally regarded as the method of choice for the detection of structural SI joint lesions, it is not widely used because of high radiation exposure.13 Previous studies directly comparing radiography and CT indicate that radiographs have limited sensitivity and specificity.14 In the current study, we used low-dose CT (ldCT) as the gold standard, with a radiation exposure similar to radiography,15–18 and compared this with MRI and X-rays in 110 patients who were referred to one rheumatology department because of unclear low back pain and possible SpA. The aim was to investigate whether T1-weighted MRI has an acceptable sensitivity and specificity for the detection of structural lesions in comparison with ldCT and performs the same or even better compared with radiography of the SI joints.
Materials and methods
Subjects
The patients analysed in this study were derived from the population of the sacroiliac joint MRI and CT study SacroIliac MAgnetic resonance Computed Tomograph (SIMACT). This prospective cross-sectional single-centre study included 110 patients being referred to the local rheumatology department, with chronic low back pain of unknown aetiology, however, with the suspicion of SpA. All patients were under the age of 60 and had no contraindications to MRI, for example, cardiac pacemakers. We also included 18 healthy age and sex matched controls that underwent MRI only (mean age 34.6 years, 9 male and 9 female). The final diagnosis was established by an expert rheumatologist using a published algorithm and taking into account all clinical data, laboratory results and imaging findings.19 The local ethics committee approved this study, and all patients gave written informed consent. The ethics committee waived the need for additional approval by the German Federal Office for Radiation Protection.
Imaging procedures
All patients for whom no current radiograph (6 months or less) was available underwent a pelvic radiograph with a 30° caudal tilt (Ferguson view) on a conventional skeletal X-ray device (DigitalDiagnost, Philips Medical Systems, Best, The Netherlands) as part of the standard diagnostic procedure. This is the local standard radiographic examination preferred by the rheumatology department because it displays the SI joints with less superimposition than the anterior–posterior beam path.
Thereafter, all patients underwent a CT scan of the SI joints on a 64-row dual-source scanner (Somatom Definition Flash, Siemens, Erlangen, Germany) using a low-dose protocol with a tube voltage of 100 kVp, tube current of 60 mAs, a collimation of 0.6 mm and a spiral pitch factor of 0.8. Dose modulation during scanning was performed to allow the lowest radiation dose possible with acceptable image quality. The ldCT volume dataset was reconstructed using a standard soft tissue and bone kernel. Additional reconstructions with a soft tissue kernel were done in an oblique coronal view parallel to the axis of the second sacral vertebra at 0.6 mm slice thickness.
Directly after the ldCT, all patients underwent MRI at 3.0 Tesla (Magnetom Skyra, Siemens, Erlangen, Germany) using a spine coil. The MRI protocol included a conventional T1-weighted spin echo and STIR sequence in oblique coronal slice orientation. The parameters for the T1-weighted sequence were: repetition time 652.0 ms, echo time 11.0 ms, slice thickness 3 mm, flip angle 156° and spatial resolution of 410×512.
Radiation exposure
The estimated effective dose was calculated from the dose–area product using a conversion factor of 0.339 for the radiographs20 and from the dose–length product for ldCT, applying a conversion coefficient of 0.011.21 The accuracy of this method was tested in a random sample of 15 patients using a special software for radiation exposure calculation (CT-Expo; SASCRAD, Buchholz, Germany).
Image scoring
Imaging data were anonymised separately for radiography, ldCT and MRI using OsiriX 6.4 (Pixmeo SARL, Bernex, Switzerland) and scored on a workstation with a high-resolution monitor. The three readers had different experience in musculoskeletal image interpretation (reader 1: a research student (JG) with 1 year of experience in SI joint reading; reader 2: a junior radiologist (TD) with 5 years of experience; reader 3: a senior radiologist (K-GAH) with 15 years of image interpretation experience, specialised in rheumatology imaging). All readers performed a specific training including a teaching session and consensus scoring of test cases. The readers were blinded to patient characteristics, clinical data and the findings of other imaging modalities. Radiographs were scored independently by all three readers; however, ldCT and MRI reading were done by readers 1 and 2, while reader 3 scored only a random sample of 20 cases to test for inter-rater reliability.
We used a scoring system based on previous work of our group.12 Scoring of the radiographs included erosions (0–3), joint space alterations (0–4), sclerosis (0–2)—as shown in table 1 and figure 1—and grading of sacroiliitis according to the modified New York criteria (mNYC) (0–4). In the evaluation of ldCT and MRI, special care was taken to record the location of lesions within the SI joint. This was done by dividing each joint into four quadrants and three positions (anterior, middle, posterior). Thus, each SI joint was divided into 12 locations to accurately localise lesions in three dimensions (see figure 2). The scoring of ldCT and MRI included the same score for erosions, joint space alterations and sclerosis that was used in radiography. In a consensus scoring exercise, a set of 10 randomly selected test cases was used to train the three readers, test the preliminary definitions and adjust the scoring system. Thereafter, five randomly selected samples were assessed independently to further refine agreement between the readers. A scoring atlas was established based on those 15 cases (see figure 1).
Scoring system for joint space, erosions and sclerosis
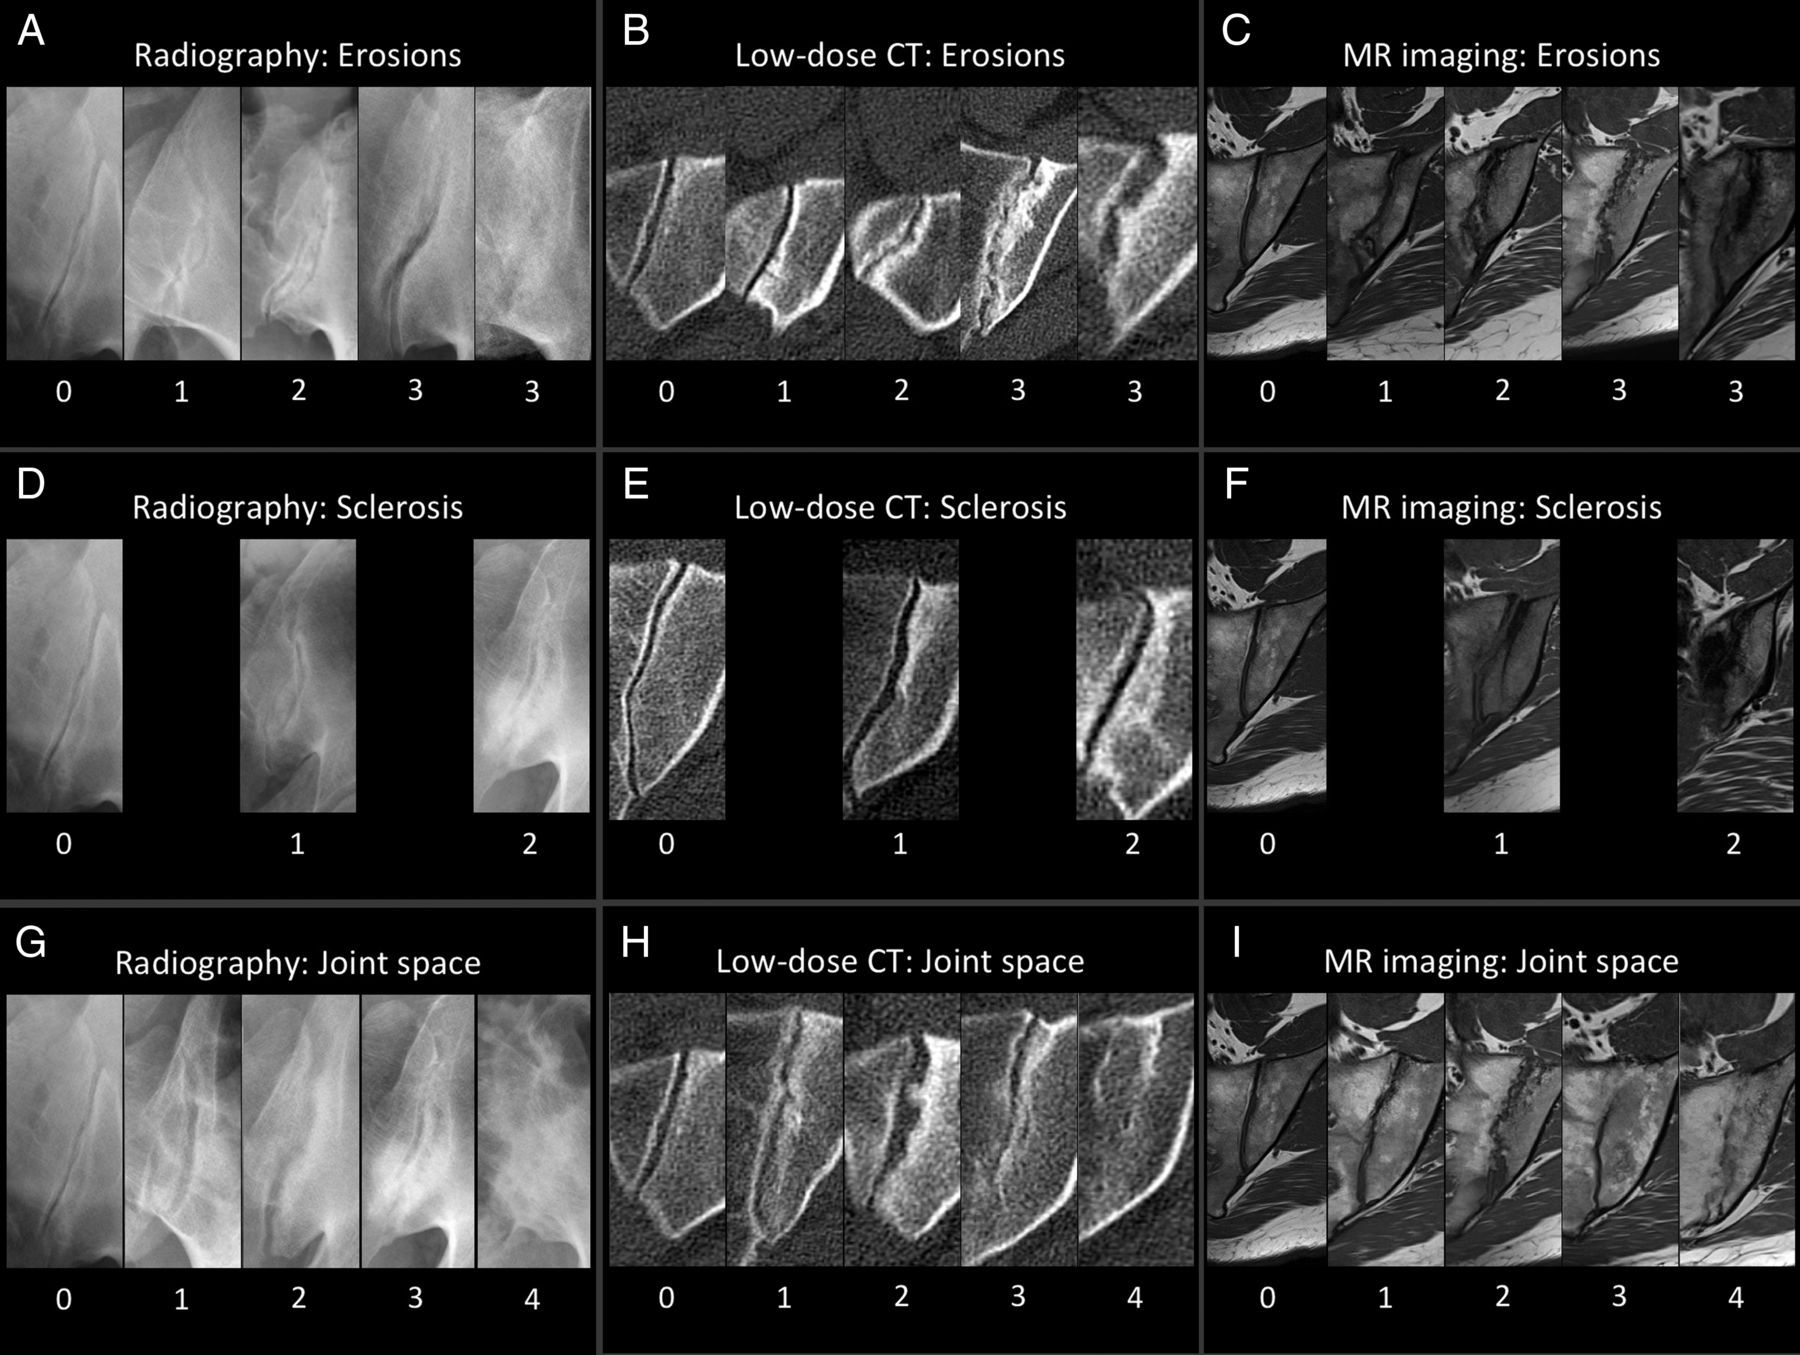
Scoring atlas for erosions (A–C), sclerosis (D–F) and joint space alterations (G–I) seen on radiography (A, D and G), low-dose CT (B, E and H) and MRI (C, F and I). A detailed description of the different scoring items is shown in table 1.

Three-dimensional localisation of all 24 regions. The first eight quadrants capture changes in the anterior aspects of both sacroiliac joints, which are anterior to the slices depicting the sacral neuroforamina (<180° of the circumference of S2 is visualised). The true pelvis is seen in the centre of the image. The second eight quadrants (numbered 9–16) subdivide the central portion of both sacroiliac joints, defined by the depiction of the anterior sacral foramina. The remaining quadrants (numbered 17–24) represent the posterior part of the joints, which is recognised by visualisation of the entheseal joint compartment in the middle, and stretching to the posterior and inferior aspect of the joint. Proper oblique coronal slice orientation (parallel to the axis of the S2 vertebra) is crucial for this scoring system. Also, normal anatomical variants must be considered when using it.
The scoring results of the different readers were not averaged for statistical purposes: radiographs were scored by all three readers, and thus agreement of two out of the three readers was used for the statistical analysis. MRI and ldCT were scored by only two readers. Therefore, agreement of both readers for an imaging finding was necessary to count for the analysis (see also below).
Definitions of structural lesions
An erosion was defined as a focal, usually ill-defined lucency on radiographs of the cancellous bone with a clear interruption of the cortical bone in the cartilaginous compartment. This type of lesion appears hypodense relative to trabecular bone on ldCT and hypointense relative to normal bone marrow signal on T1-weighted images. A small erosion was defined as having a diameter below 3 mm, and a large erosion as equal or above 3 mm. Confluent erosions were defined as a loss of the normal cortical border over a length of at least 6 mm parallel to the joint space (see figure 1A–C).
Sclerosis was defined as a sharply or ill-defined opacity on radiographs, a hyperdense—clearly more dense than normal cancellous bone—lesion on ldCT, or a very hypointense (black) lesion on all MRI sequences of the cancellous bone adjacent to the joint space with a minimum diameter of 5 mm measured perpendicular to the joint (see figure 1D–F).
Pseudowidening was defined for radiography as increased bone-to-bone distance clearly attributable to joint destruction due to confluent erosions affecting at least a quarter of the joint. For ldCT or MRI, the bone-to-bone distance had to be increased in the major part of a region (see figure 1 for definition of regions). Ankylosis was defined as an opacity within the joint space suggesting complete bony bridging on radiography. For ldCT, ankylosis was defined as a dense lesion within the joint space consistent with the bone. For T1-weighted MRI, ankylosis was defined as a lesion in the joint space bridging the joint with an increased signal intensity equal to or greater than that of normal bone marrow. Extensive ankylosis was defined as affecting at least half of the joint. Imaging examples of pseudowidening and ankylosis are shown in figure 1G–I.
Definition of positive imaging findings
A scoring item (ie, erosions, sclerosis and joint space changes) with a score of 2 or higher was defined as unequivocally positive for all modalities (see table 1). On the joint level, mNYC grade II or higher was defined as a positive radiograph. Global positivity on ldCT was defined as having an erosion score and/or joint space score of 2 or higher in any of the 12 regions. This definition complies with a grade II, according to the mNYC with unequivocal erosive changes or pseudowidening/ankyloses. Sclerosis was considered non-specific, because it is also frequently present in other conditions such as osteoarthritis or osteitis condensans. Therefore, it was not included in our definition of a positive SI joint for ldCT or MRI. On the patient level, grade II bilaterally or grade III–IV unilaterally, according to the mNYC, was defined as a positive radiograph. For ldCT and MRI, we defined an erosion score and/or joint space score of 2 or higher in any of the 24 regions of both joints as positive.
For statistical analysis, joints and items were counted as positive only if both readers agreed about the presence of the pathological imaging finding.
Statistical analysis
We performed a Kruskal-Wallis and χ2 test for significant differences in patient characteristics between the groups of patients with axSpA and non-axSpA. A contingency table analysis was conducted to compare overall positivity of radiographs and MRI with ldCT, calculating sensitivity and specificity on a joint-based level and a patient level using ldCT as standard of reference (SOR). Furthermore, the McNemar test was used to search for significant differences in correct and incorrect findings on radiography and MRI. The same analysis was performed for each structural scoring item (erosions, sclerosis and joint space alterations). Cohen's κ was calculated comparing ldCT with MRI and radiography and each reader pair separately. Cohen's κ was interpreted according to Landis and Koch.20 The Spearman correlation coefficient was calculated for sum scores of radiography, ldCT and MRI. The Wilcoxon signed-rank test was performed to test for significant differences of sum scores of ldCT and MRI. A value of p<0.05 was considered significant.
Analyses were performed with SAS V.9.2 (SAS Institute, Cary, North Carolina, USA) and GraphPad Prism (V.6.0 for MacOS, GraphPad Software, La Jolla, California USA).
Results
Subjects
A total of 110 patients presenting with unclear low back pain from September 2012 to January 2014 were included. CT and MRI were tolerated well by all patients.
A total of 58 patients were finally diagnosed with axSpA (AS and nr-axSpA) by the expert rheumatologist (35 men and 23 women; mean age, 34.8 years; 46 human leukocyte antigen (HLA)-B27 positive; mean symptom duration, 94 months), 52 with other diagnoses, for example, osteitis condensans or osteoarthritis (18 men and 34 women; mean age, 37.4 years; 24 HLA-B27 positive; mean symptom duration, 70.2 months). In the axSpA group, 35 patients were diagnosed with nr-axSpA and 23 patients with AS based on a centralised and standardised reading of the radiographs as described above.
Radiation exposure
The mean radiation exposure of radiography was calculated as 0.52 mSv (SD 0.48) with a maximum of 3.44 mSv. For 10 examinations performed elsewhere, exposure could not be calculated because the parameters of the X-ray machines were not available. The mean radiation exposure of ldCT was calculated to be 0.51 mSv (SD 0.18) with a maximum of 1.46 mSv, including the topogram for planning the examination.
Scoring results
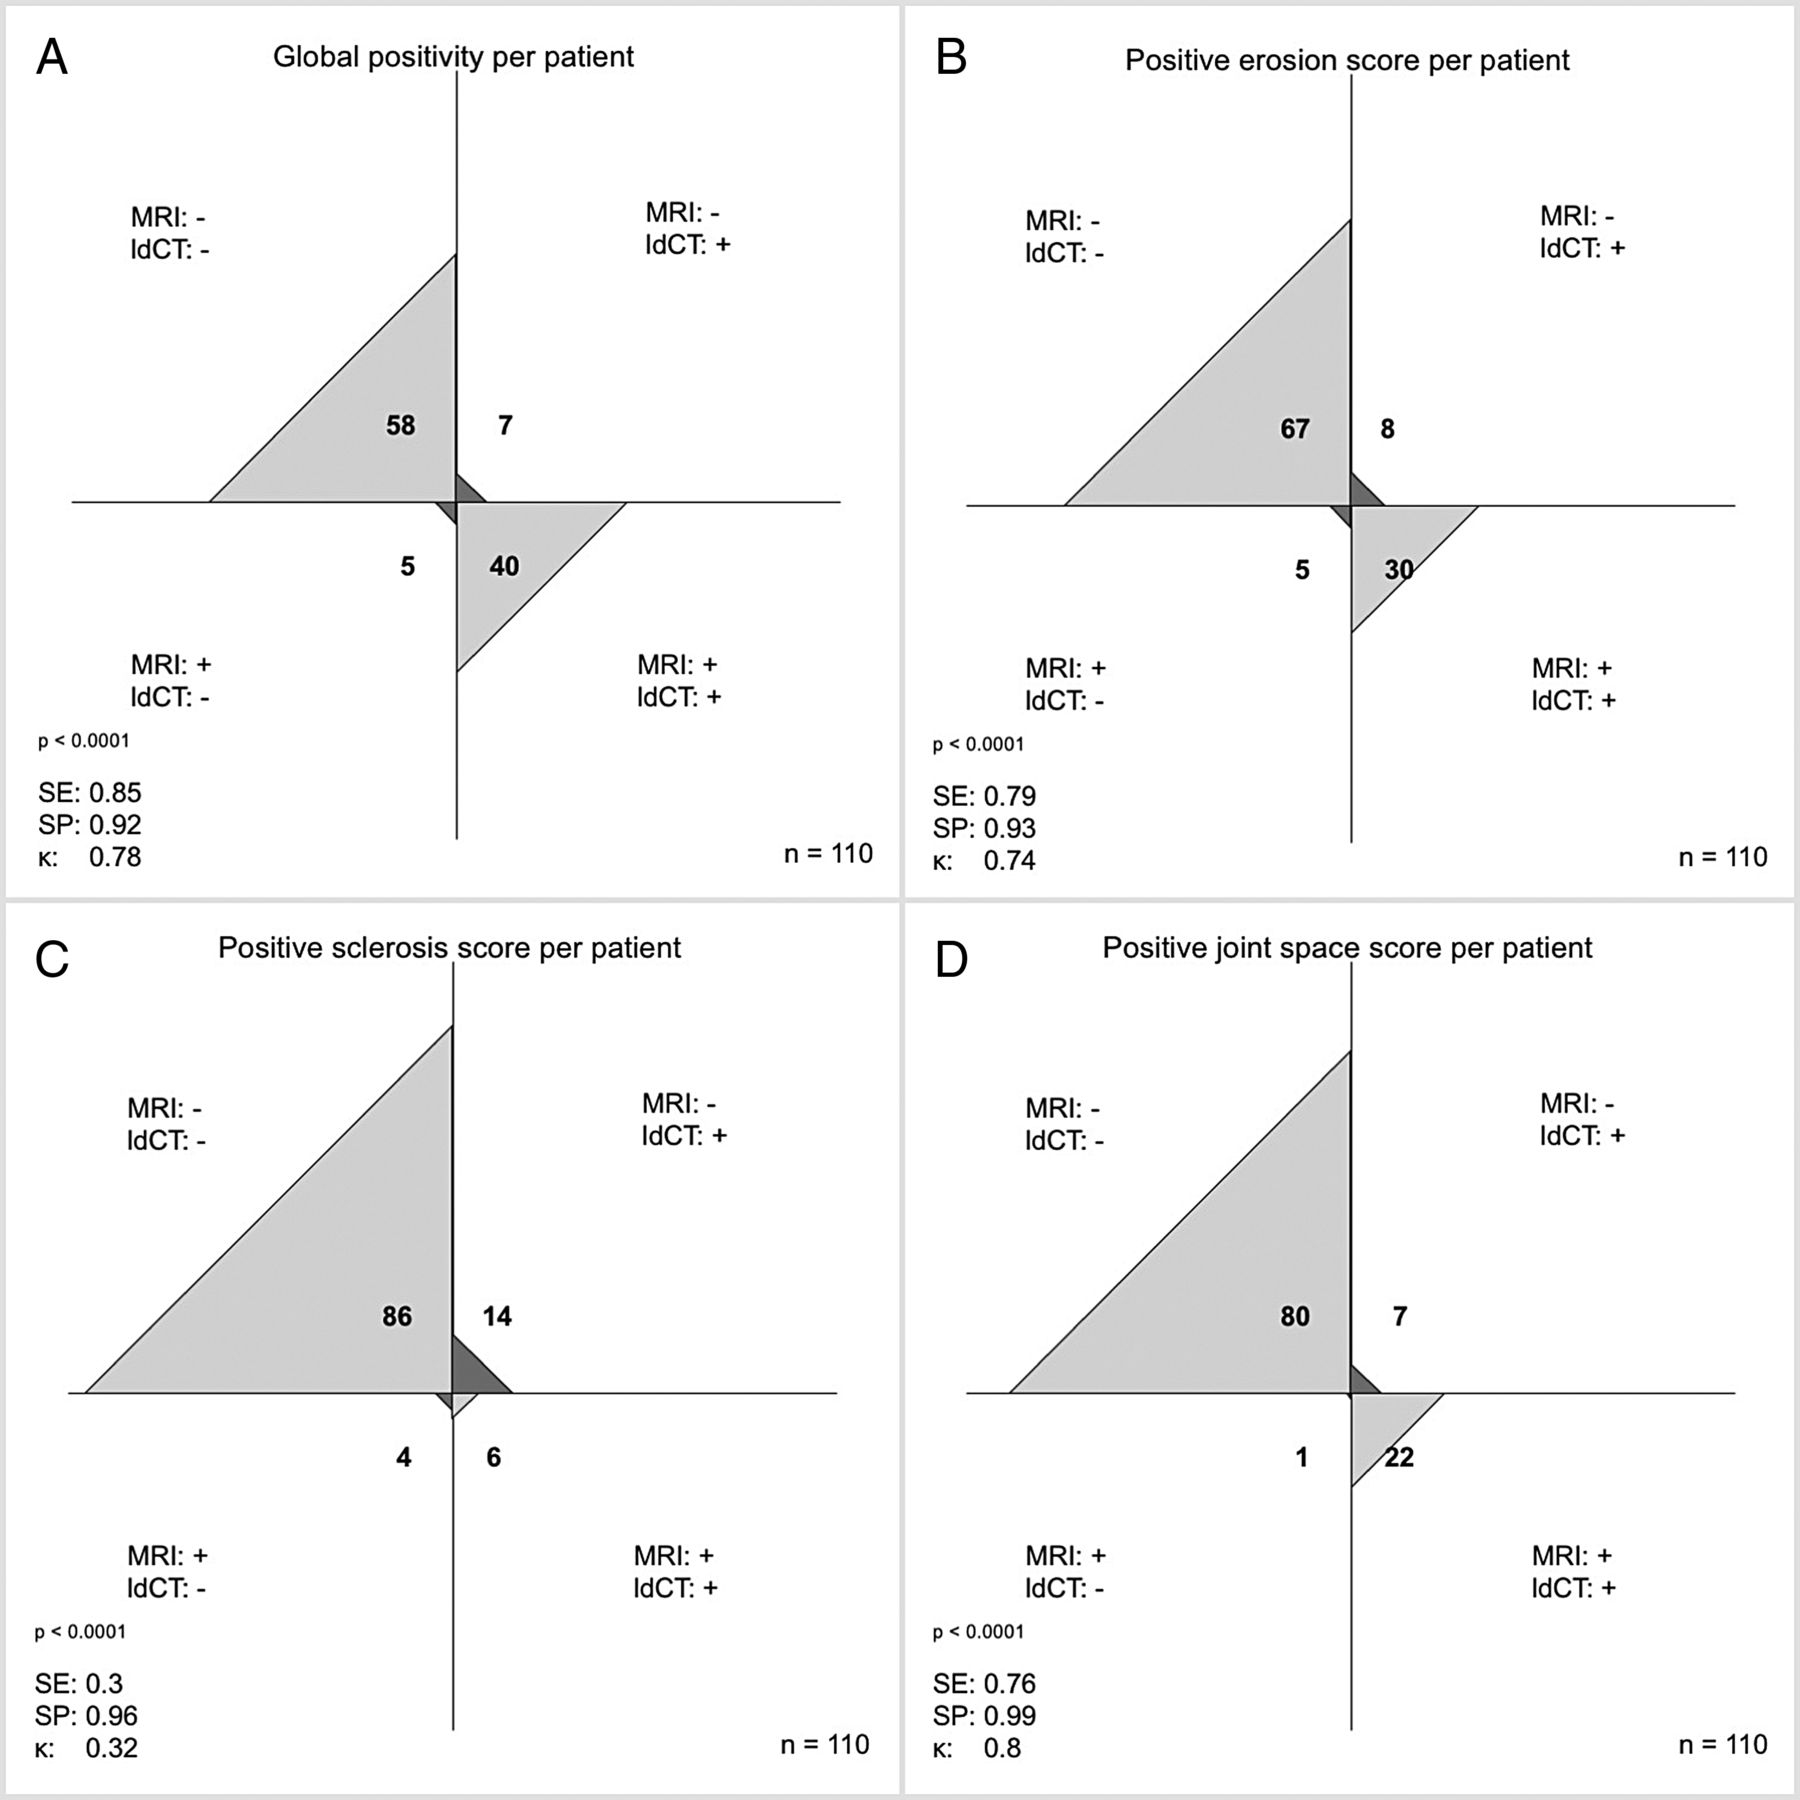
Applying the definition of positivity for structural changes, 31 patients were positive on radiography, 50 on ldCT and 45 on MRI. Figure 3 provides the contingency graph for the comparison of radiography and ldCT on the joint level based on the contingency table. It also includes sensitivities and specificities and Cohen's κ for positive findings and each scoring item. Figure 4 presents the same information for the comparison of MRI and ldCT. All values were calculated using ldCT as SOR. Figure 5 provides an overview of sensitivities and specificities comparing radiography and MRI, showing that the sensitivity is clearly better for MRI compared with radiography for most of the variables investigated, with the exception of sclerosis for which radiography performed better. However, there was no clear difference in the specificity. Using ldCT as SOR, overall positivity was correct in 70.0% (60.8%–77.8%) of cases in radiography and 89.1% (81.9%–93.7%) in MRI (p=0.0005). We found also a significant difference for erosions with 70.9% (61.8%–78.6%) correct findings on radiography and 88.2% (80.8%–93.0%) on MRI with a p value of 0.0023 and for joint space alterations with 80.9% (72.6%–87.2%) correct findings on radiography and 92.7% (86.3%–96.3%) on MRI with a p value of 0.0019, respectively (see also figure 5). However, for sclerosis, the difference with 86.4% (78.7%–91.6%) correct findings on radiography and 83.6% (75.6%–89.4%) on MRI was not significantly different (p=0.6625).
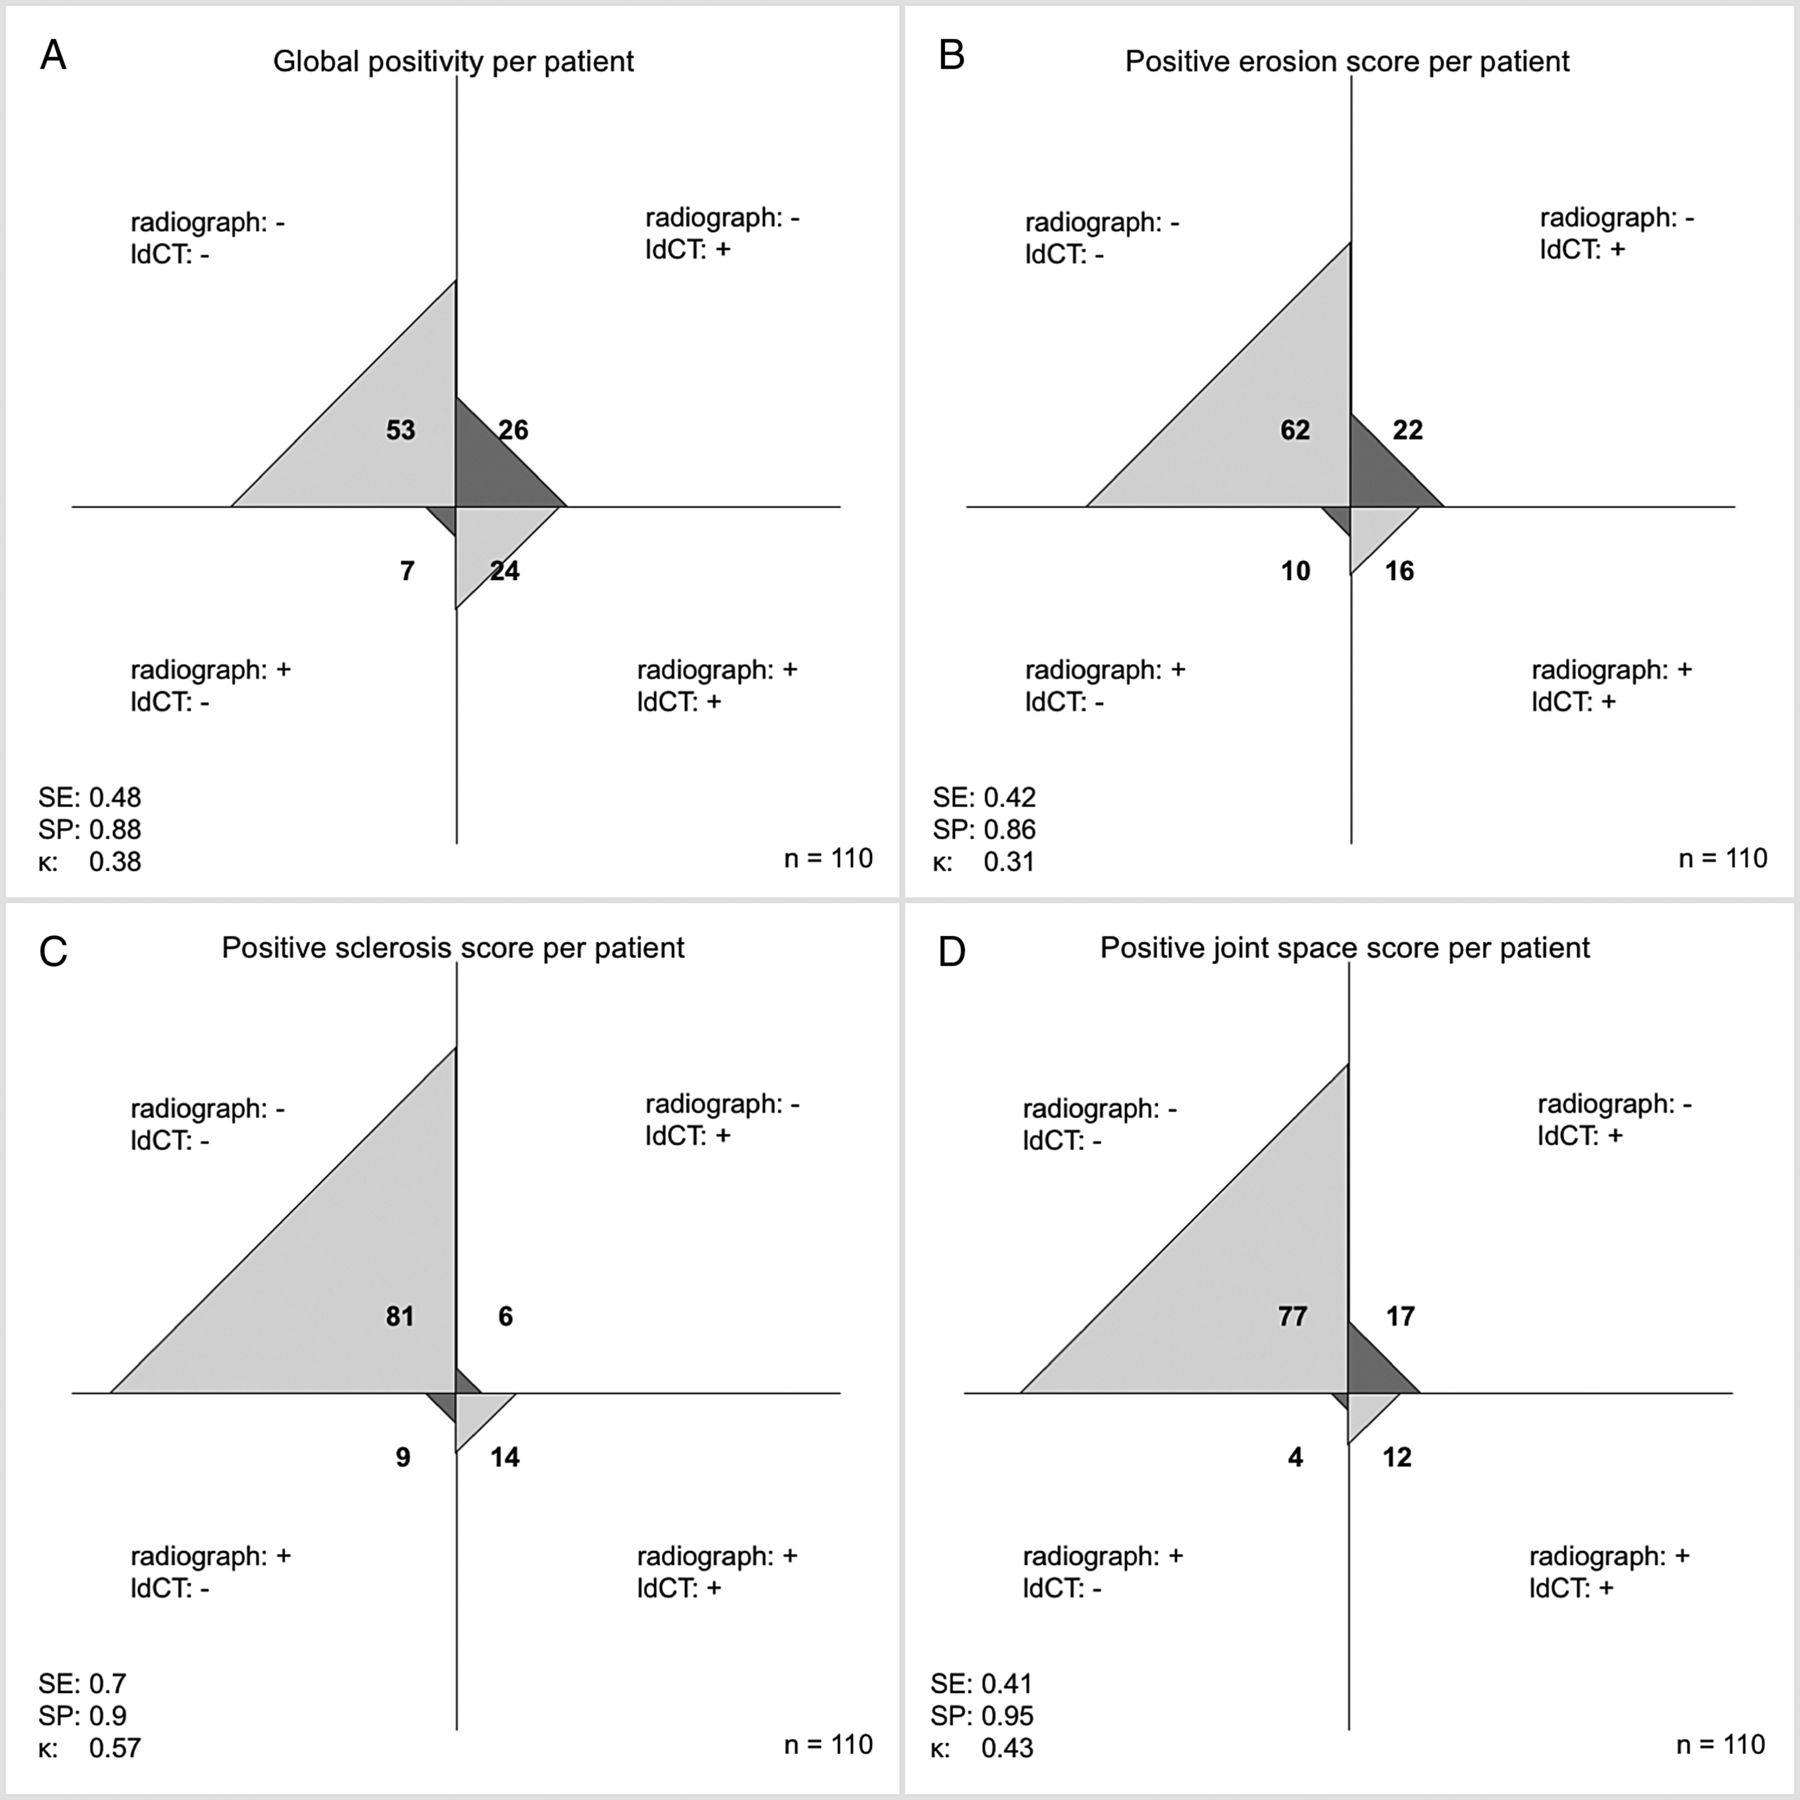
Contingency analysis radiography versus low-dose CT (ldCT) on the patient level. (A) Global positivity as defined for radiography and ldCT (erosion and/or joint space score >1). (B) Positive erosion score. (C) Positive sclerosis score. (D) Positive joint space score. For definitions of positive findings and scoring items, see Methods section of the text. κ, Cohen's κ for agreement of the two modalities; SE, sensitivity; SP, specificity, using ldCT as the standard of reference.

Contingency analysis. MRI versus low-dose CT (ldCT) on the patient level. (A) Global positivity as defined for radiography and MRI (erosion and/or joint space score >1). (B) Positive erosion score. (C) Positive sclerosis score. (D) Positive joint space score. For definitions of positive findings and scoring items, see Methods section of the text. κ, Cohen's κ for agreement of the two modalities; SE, sensitivity; SP, specificity, using ldCT as the standard of reference.

Summary and comparison of the sensitivity (A), specificity (B) and agreement with low-dose CT (ldCT) on the presence/absence of findings displayed as parts of the whole patients’ collective (C) for radiography and MRI for global impression and structural scoring items using ldCT as standard of reference. The p values (C) are calculated using McNemar test. Radiography shows lower sensitivities for all scoring items except sclerosis when compared with MRI. Specificities for radiography are comparable with those for MRI, however, slightly inferior for each item. MRI shows a significantly better agreement to ldCT than radiography for global impression—as defined in the Methods section—erosions and joint space alterations.
Regarding inter-rater reliability of readers 1 and 2 for global positivity, we found fair agreement for radiography (κ=0.36 on the joint level and 0.33 on the patient level) and substantial agreement for both ldCT (κ=0.69 on the joint level and 0.62 on the patient level) and MRI (0.68 on the joint level and 0.62 on the patient level).
Analysing the results for each reader separately, we found for the erosion score weak correlation between radiography and ldCT for reader 1 (Spearman correlation coefficient of 0.33) and moderate correlation for reader 2 (0.56). The correlation of the erosion sum scores between MRI and ldCT was strong for reader 1 (0.74) and reader 2 (0.79). Inter-rater agreement for the presence of an erosion score >1 was fair for radiography (κ=0.34 on the patient level), but substantial for ldCT (κ=0.77) and moderate for MRI (κ=0.54).
For sclerosis, we found moderate correlation between radiography and ldCT for reader 1 (Spearman correlation coefficient of 0.51) and moderate correlation for reader 2 (0.58). The correlation of ldCT and MRI was moderate for reader 1 (0.42) and reader 2 (0.6).
Inter-rater agreement for the presence of a sclerosis score of 2 was fair for radiography (κ=0.4 on the patient level) and MRI (κ=0.35). However, for ldCT, agreement was moderate (κ=0.49).
There was no significant pattern regarding distribution of lesions in the different locations for either sclerosis (p=0.72) or erosions (p=0.88), that is, no single region was affected more frequently than others.
Analysing joint space changes, we found moderate correlation for reader 1 (Spearman correlation coefficient of 0.47) and for reader 2 (0.54) between radiography and ldCT, and very strong correlation between ldCT and MRI for reader 1 (0.83) and strong correlation for reader 2 (0.73). Inter-rater agreement of a joint space score >1 was fair for radiography (κ=0.32), substantial for ldCT (κ=0.7) and moderate for MRI (κ=0.55).
Comparison of the sum scores for structural lesions on the patient level found MRI and ldCT to be equivalent for erosions when tolerating a 15% mismatch. Reader 2, but not reader 1, scored joint space alterations significantly different in MRI and ldCT. Nonetheless, both readers assigned lower scores to MRI for sclerosis detection (see online supplementary figure S1).
supplementary figure
Correlation of the sum scores in MRI and ldCT.
All healthy controls were negative for erosions, sclerosis and joint space, as defined for our study.
Discussion
In comparison with low-dose CT as the gold standard, conventional radiography missed more than half of the patients and two-thirds of the joints with structural changes indicating (radiographic) axSpA on low-dose CT. Especially erosions—considered the most characteristic structural damage21 ,22—were not detected reliably on radiographs, confirming earlier studies demonstrating higher sensitivity of CT.14 Interestingly, only a few cases of false-positive results were obtained with radiography using ldCT as the gold standard. This is the first study comparing conventional radiographs with ldCT performed with a radiation exposure comparable with that of radiography. Previous studies report good diagnostic accuracy for ldCT of the bones in the detection of fractures and malignant infiltration.23–25 However, for ethical reasons (radiation exposure), a comparison with conventional CT was not performed by us and—to our knowledge—has not been performed by other investigators.
Most importantly, however, our results show that the sensitivity of T1-weighted MRI for the detection of structural lesions, especially erosions and joint space changes (including ankylosis), is similar to that of ldCT and better than that of radiography. Inter-rater agreement about imaging findings was also significantly inferior for radiography compared with both ldCT and MRI, again confirming earlier reports.3 Not surprisingly, T1-weighted MRI was inferior to radiography in the detection of sclerosis. In terms of our definition of positive sacroiliitis (structural damage) on the patient level, T1-weighted MRI again performed quite well with a sensitivity of approximately 85% vs 48% for radiography, while specificity was approximately 90% for both MRI and radiographs in comparison with ldCT. Thus, based on our study, the major problem with radiography, besides high inter-reader variability, seems to be underdiagnosis rather than overdiagnosis of structural lesions in the SI joints (figure 3). Also, when T1-weighted MRI is compared with ldCT on the individual patient level (see figure 5), false-positive MRI findings seem to be less of a concern than false-negative findings. But, our results also show that some patients with radiographic axSpA might be missed when T1-weighted MRI is used alone. Therefore, in patients with inconclusive T1-weighted MRI findings, ldCT of the SI joints seems to be a suitable supplementary option for the detection of structural lesions.
Eighteen age-matched and sex-matched healthy subjects who underwent MRI were included as controls. Applying our definition of positivity for structural lesions of the SI joints, none of these controls were positive on MRI. Nonetheless, the increasing evidence showing that T1-weighted MRI might be an alternative (or supplement) to radiography warrants agreement about a generally accepted definition of MRI positivity for structural lesions. Other definitions have been proposed and investigated in patients and controls using the clinical diagnosis as gold standard such as either ≥3 erosions, ≥3 fatty lesions, and/or ≥5 fatty lesions and/or erosions,26 or just ≥2 erosions.10 We also analysed our data in relation to the clinical diagnosis of the expert rheumatologist and, here again, T1-weighted MRI performed better than radiography (data not shown). However, this result of our analysis should be treated with caution, because the rheumatologist was aware of the imaging results when making the final diagnosis and therefore might have been biased.
Some earlier studies comparing the performance of MRI, CT and radiography in the detection of sacroiliitis in smaller patient populations already indicate that MRI comes close to CT, especially in the detection of erosions, and is superior to radiographs.27 While our results are in line with these studies, they also show that cross-sectional techniques are superior in patients with advanced SpA and in identifying structural lesion patterns in patients diagnosed with axial SpA for the first time.
Thus, the next step should probably be to test the sensitivity and specificity of the different definitions of MRI positivity for structural lesions in patients from previous and future studies and to find a generally accepted definition. It is unlikely that T1-weighted MRI will fully replace radiography in the diagnosis of radiographic sacroiliitis in the near future because of the wide availability of this test and the still relatively high costs of MRI. However, patients in whom an MRI is available might not require an additional radiographic examination.
Acknowledgments
The authors thank Mrs Bettina Herwig for editorial assistance and Mr Nikolay N. Tonkoff for creating figure 2.
References
Footnotes
Handling editor Tore K Kvien
Contributors TD: conception and design of the study, design of scoring system, image scoring, data evaluation, statistical calculations, article draft, critical revision of the manuscript for important intellectual content. K-GAH: conception and design of the study, design of scoring system, image scoring, data evaluation, with critical revision of the manuscript for important intellectual content and final approval of the version to be published. JG: patient acquisition, data management, image scoring, critical revision of the manuscript for important intellectual content. CS: analysis and interpretation of data, statistical calculations. DP: patient acquisition, critical revision of the manuscript for important intellectual content. BH: conception of the study, critical revision of the manuscript for important intellectual content. JS: patient acquisition, conception and design of the study with critical revision of the manuscript for important intellectual content.
Funding This study was funded by the Assessment of Spondyloarthritis International Society.
Competing interests None declared.
Patient consent Obtained.
Ethics approval Charité Ethics Review Board.
Provenance and peer review Not commissioned; externally peer reviewed.