Article Text

Abstract
Objectives The aim of this work was to examine the relationship between joint damage and monosodium urate (MSU) crystal deposition in gout.
Methods Plain radiographs and dual-energy CT (DECT) scans of the feet were prospectively obtained from 92 people with tophaceous gout. Subcutaneous tophus count was recorded. The ten metatarsophalangeal joints were scored on plain radiography for Sharp–van der Heijde erosion and joint space narrowing (JSN) scores, and presence of spur, osteophyte, periosteal new bone and sclerosis (920 total joints). DECT scans were analysed for the presence of MSU crystal deposition at the same joints.
Results DECT MSU crystal deposition was more frequently observed in joints with erosion (OR (95% CI) 8.5 (5.5 to 13.1)), JSN (4.2 (2.7 to 6.7%)), spur (7.9 (4.9 to 12.8)), osteophyte (3.9 (2.5 to 6.0)), periosteal new bone (7.0 (4.0 to 12.2)) and sclerosis (6.9 (4.6 to 10.2)), p<0.0001 for all. A strong linear relationship was observed in the frequency of joints affected by MSU crystals with radiographic erosion score (p<0.0001). The number of joints at each site with MSU crystal deposition correlated with all features of radiographic joint damage (r>0.88, p<0.05 for all). In linear regression models, the relationship between MSU crystal deposition and all radiographic changes except JSN and osteophytes persisted after adjusting for subcutaneous tophus count, serum urate concentration and disease duration.
Conclusions MSU crystals are frequently present in joints affected by radiographic damage in gout. These findings support the concept that MSU crystals interact with articular tissues to influence the development of structural joint damage in this disease.
- Gout
- Bone Mineral Density
- Inflammation
Statistics from Altmetric.com
Introduction
Structural joint damage is frequently observed in people with advanced gout.1 Both catabolic changes such as bone erosion and cartilage loss, and anabolic new bone formation (NBF) occur in affected joints.2–5 The mechanisms of structural joint damage in this condition are not well understood. Imaging studies have implicated the tophus in the development of bone changes, with conventional CT studies demonstrating a close relationship between tophus, bone erosion and NBF.6 ,7 The tophus represents a chronic granulomatous tissue response to monosodium urate (MSU) crystals.8 Dual-energy CT (DECT) is a recently developed imaging method that allows non-invasive detection of the elementary chemical composition of urate.9 This method has been used to analyse the composition of tophi, with highly variable MSU crystal content observed within lesions of similar physical size.10
The marked variation in MSU crystal content within tophi means that it cannot be assumed that the previously observed relationship between tophi and structural joint damage is directly due to the effects of MSU crystal deposition. Laboratory and imaging studies have demonstrated that MSU crystals are in contact with articular structures.11 ,12 In vitro, MSU crystals have profound catabolic effects on stromal cells of the joint, such as chondrocytes and osteoblasts.13 ,14 However, the relationship between MSU crystal deposition and structural joint damage has not been examined systematically in patients with gout. The aim of this study was to examine the relationship between radiographic joint damage and MSU crystal deposition using DECT in patients with tophaceous gout.
Patients and methods
Ninety-two people with tophaceous gout were prospectively recruited from rheumatology clinics in Auckland, New Zealand. All participants had gout according to American College of Rheumatology classification criteria15 and at least one subcutaneous tophus on clinical examination. The Northern Regional Ethics Committee approved this study. All participants provided written informed consent before inclusion into the study.
Clinical assessment, plain radiographs of feet and DECT scan of both feet were obtained at a study visit on the same day. Clinical data recorded include demographic details (age, sex, ethnicity), gout history, medications, physical examination (including subcutaneous tophus count) and laboratory tests, including serum urate (SU) concentration.
The plain radiographs were assessed by a rheumatologist (ND) with experience in scoring of gout radiographs. The 10 metatarsophalangeal joints (MTPJs) were scored for each participant (920 total joints). Each joint was scored for the presence and extent of erosion and joint space narrowing according to the Sharp–van der Heijde scoring method for rheumatoid arthritis (erosion 0–10, narrowing 0–4) previously validated for gout.16 The presence of NBF features was also recorded using the following definitions: spur (a sharp spicule of dense bone proliferation extending at an acute angle from the cortex), osteophyte (bone projection arising along the joint margin and associated with cartilage17), periosteal NBF (bone proliferation arising from the periosteum), ankylosis (fusion of the bones of a joint, with trabeculae crossing the joint space) and sclerosis (increased density of medullary or subcortical bone).7 The reader was blinded to the clinical features (including subcutaneous tophus counts) and DECT results.
DECT scans of the feet were performed at the same study visit on a dual X-ray tube 128 detector row scanner (Somatom Definition Flash, Siemens Medical, Erlangen, Germany) as previously described (see online supplementary text).10 A proprietary workstation (MultiModality Workspace, Siemens Medical) was used with proprietary software (syngo MMWP VE 36A 2009, Siemens Medical). For the 80 kV images, fluid was set at 50 Hounsfield units (HU), the ratio for urate at 1.28, minimum HU 150 and smoothing range 5. For the 140 kV images, fluid was set at 50 HU and maximum HU at 500. Two readers (RK and OA) scored the DECT scans for the presence of MSU crystals at the 10 MTPJ (920 total joints). The readers were blinded to the clinical features (including subcutaneous tophus counts), plain radiographic scores and each other's scores. Inter-reader agreement was 94.2%, and Cohen's κ was 0.82. For a stringent analysis, urate deposition was considered present at each site only if reported by both readers.
Data were analysed using Prism (V.5, GraphPad, San Diego, California, USA) and SPPS (V.21, SPSS Inc., Chicago, Illinois, USA). Means with SDs and percentages were used to describe the clinical and imaging characteristics of patients. CIs for proportions were calculated by mid-P exact using http://www.OpenEpi.com.18 Reliability was assessed using agreement statistics, including κ values. Differences between groups were analysed using t tests and χ2 analysis with calculation of ORs with 95% CIs. For the purposes of the site-by-site analysis, each joint was initially considered an independent unit for analysis. A general estimating equations (GEE) approach was also undertaken using the GENMOD package of SAS (SAS V.9.2, SAS Institute Inc) to provide adjustment for the likely closer agreement between bones in the same individual than agreement between the bones of other participants (ie, each of the 92 individuals contributed 10 bones to the analysis). Both sites of involvement and individuals were included in the GEE analysis. To further address the possibility that lesions were nested within individuals, the sum of affected joints and scores per patient were also analysed (patient-level analysis). Pearson's correlation tests were used to describe the associations between variables. Linear regression models were used to examination the relationship between DECT MSU crystal deposition, subcutaneous tophus burden, SU and disease duration on the plain radiographic features. All tests were two tailed, and p values less than 0.05 were considered statistically significant.
Results
Clinical characteristics
Participants were predominantly male (93%) with a mean (SD) age 58 (40) years. Mean disease duration was 22 (14) years, and mean total number of subcutaneous tophi was 7.3 (7.1). There were 44 (48%) patients with microscopically proven disease. Urate-lowering therapy was prescribed in 85 (92%) participants and mean SU was 0.37 (0.11) mmol/L (6.2 (1.8) mg/dL). There were 50 (54%) patients with SU below 0.36 mmol/L (6 mg/dL).
Frequency of DECT MSU crystal deposition and structural joint damage changes
Table 1 shows the frequency of each imaging feature at individual joints and in all joints. All patients had at least one DECT urate deposit present on the foot CT scans. There were 153/920 (16.6% (95% CI 14.3 to 19.1%)) MTPJs with DECT urate deposition. Erosion was the most commonly observed feature of structural joint damage. For all MTPJs, the mean (SD) Sharp–van der Heijde erosion score was 1.17 (2.30) (range 0–10) and joint space narrowing score was 0.25 (0.76) (range 0–4). Sclerosis was the most commonly observed features of NBF, and ankylosis was not observed in any joints. Given the absence of ankylosis, no further analysis regarding this imaging feature is presented. Examples of corresponding plain radiographic and DECT images of affected first MTP joints are shown in figure 1.
Frequency of each imaging feature at individual sites and in all joints and patients

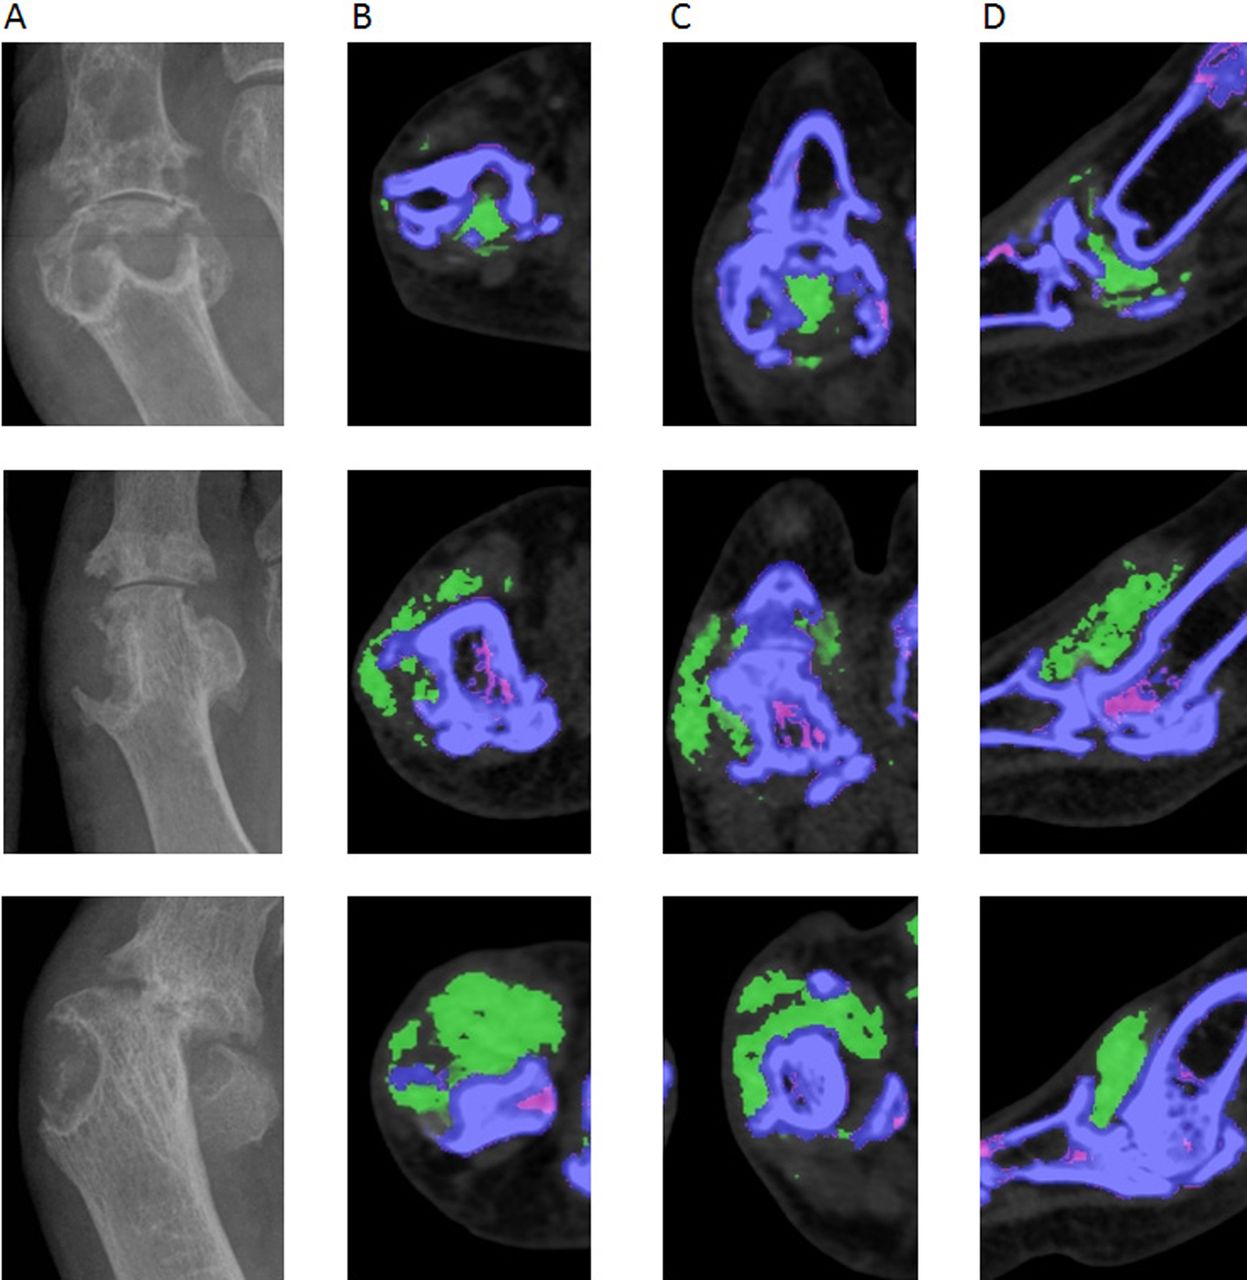
Examples of plain radiographs (A) and corresponding axial (B), coronal (C) and sagittal (D) dual-energy CT (DECT) images of affected first metatarsophalangeal joints from three separate participants, showing the close relationship between monosodium urate (MSU) crystal deposition and radiographic structural damage (erosion, joint space narrowing and new bone formation features). MSU crystals are shown as green in the DECT images.
Relationship between DECT MSU crystal deposition and structural joint damage changes: site-by-site analysis
The site-by-site analysis demonstrated that MSU crystals detected by DECT were more likely to be present in joints affected by all features of radiographic structural damage (table 2). This relationship was strongest for bone erosion and spur formation, and lowest for joint space narrowing and osteophyte formation. These findings persisted after stratifying patients for SU concentrations below and above therapeutic target (0.36 mmol/L) (see online supplementary table 1) and for disease duration below and above the median duration (20 years) (see online supplementary table 2). For those joints with any erosion, Sharp–van der Heijde erosion scores were higher in joints with DECT MSU crystal deposition compared with those without MSU crystals (mean (SD) erosion scores 5.2 (2.7) and 3.3 (2.1), respectively, p<0.0001). However, for those joints with any joint space narrowing, there was no difference in Sharp–van der Heijde joint space narrowing scores in joints with DECT MSU crystal deposition compared with those without MSU crystals (mean (SD) narrowing scores 2.1 (0.89) and 2.2 (0.97), respectively, p=0.75). A strong linear relationship was observed in the percentage of joints affected by DECT MSU crystal deposition with increasing Sharp–van der Heijde erosion scores (p for trend <0.0001) (figure 2).
Relationship of DECT MSU crystal deposition with structural joint damage on plain radiography: site-by-site analysis (n=920 joints)

Relationship between radiographic erosion scores and dual-energy CT monosodium urate crystal deposition in individual joints. Data are presented as percentage (95% CI).
Relationship between DECT MSU crystal deposition and structural joint damage changes: joint-site analysis
There was wide variation in the frequency of affected joints, with all imaging features occurring most frequently at the first MTPJ and least frequently at the third and fourth MTPJs (p<0.0001 for comparison between all joint sites) (table 1). There was a very high correlation between number of joints affected by DECT and all features of structural joint damage at each of the five joint sites; for erosion, r=0.99, p=0.0007; for joint space narrowing, r=0.95, p=0.01; for spur, r=0.98, p=0.004; for osteophyte, r=0.89, p=0.045; for periosteal NBF, r=0.99, p=0.001; and for sclerosis, r=0.99, p=0.001.
Relationship between DECT MSU crystal deposition and structural joint damage changes: patient-level analysis
The mean number of affected joints per patient is shown in table 1. The mean (SD) number of MTPJ affected by DECT MSU crystal deposition per patient was 2.0 (2.4). There were 31/92 (34% (95% CI 24.6 to 43.8%)) patients with no deposits observed in the assessed joints (MTPJs); of these, 10 had MSU crystal deposition at one or more other joints (five ankle, five hindfoot, three midfoot), and the rest had soft tissue deposition only. Those patients without DECT MSU crystal deposits at the MTPJs had lower SU (mean (SD) 0.32 (0.09) vs 0.40 (0.12) mmol/L, respectively, p=0.001) and lower subcutaneous tophus count (mean (SD) 4.8 (6.2) vs 8.2 (7.3), respectively, p=0.02), but no difference in disease duration (mean (SD) 21.7 (11.7) vs 21.5 (10.7) years, respectively, p=0.93) compared with those with DECT deposits at the MTPJs.
As with the individual joint analysis, erosion and sclerosis were the most commonly observed feature of structural joint damage on plain radiography in the patient-level analysis. The mean (SD) Sharp–van der Heijde erosion score per patient was 11.7 (11.2) (range 0–60), and joint space narrowing score per patient was 2.5 (3.6) (range 0–20). There were 11/92 (12%) participants without erosion at the MTPJ. The number of subcutaneous tophi and joints with DECT MSU crystal deposition was lower in these patients compared with those with MTPJ erosions (p=0.002 for both). There was no difference between these groups in SU or disease duration (p>0.15 for both).
In the patient-level analysis, positive correlations were observed between the number of joints with DECT MSU crystal deposition and the number of joints affected by all features of structural joint damage on plain radiography (table 3). The highest correlations were observed with the number of joints affected by erosion, spur and sclerosis, and total erosion scores. There was no correlation between disease duration and structural joint damage. SU correlated with total erosion score and the number of joints affected by DECT MSU crystal deposition, spurs and osteophytes.
Pearson's correlation coefficients examining the relationships between DECT MSU crystal deposition and subcutaneous tophus count with structural joint damage on plain radiography: patient-level analysis (n=92)
A positive correlation was also observed between the number of subcutaneous tophi on physical examination and the number of joints with DECT MSU crystal deposition (table 3). Furthermore, correlations were observed between the subcutaneous tophus count and the number of joints affected by all features of structural joint damage. Linear regression analysis of the patient-level data showed that for all features of structural joint damage except joint space narrowing and osteophytes, the relationship with DECT MSU crystal deposition persisted after including the number of subcutaneous tophus count in the models (table 4). In the regression models, neither SU nor disease duration was independently associated with features of features of structural joint damage. Similar results were observed when SU target (<0.36 mmol/L) was included in the regression models (data not shown).
Linear regression analysis showing the relationships between DECT MSU crystal deposition, subcutaneous tophus count, serum urate and disease duration with structural joint damage on plain radiography: patient-level analysis (n=92)
Discussion
This study has demonstrated that MSU crystals are frequently present in joints affected by structural joint damage in people with gout. The study design attempted to explore the independent relationships between MSU crystal deposition, tophus formation and structural joint damage. MSU crystal deposition by DECT, structural joint disease by plain radiography and subcutaneous tophus count by physical examination were assessed independently by different assessors (who were blinded to the results of the other assessments) and using different methods, allowing us to analyse the interactions between these variations in a manner that reduced bias. The regression analysis showed that MSU crystal deposition was an independent predictor of all features of structural bone disease, except osteophytes.
Although we observed a strong relationship between DECT MSU crystal deposition and radiographic structural joint damage, the cross-sectional nature of the analysis does not allow us to be certain about the direction of the relationship. We did not observe a relationship between disease duration and radiographic damage. This result is surprising, as we might expect that the association between crystal deposition and damage would be strongest in those who had had gout for the longest. However, it should be noted that these were all patients with established tophaceous disease and that the mean disease duration was 22 years. While it seems likely that MSU crystals are interacting with joint tissue to promote joint damage, it is possible that joint damage itself promotes formation of MSU crystals, perhaps acting as a nidus for crystal formation.19 ,20 Prospective imaging studies are now needed to clarify the direction of these relationships. The study design using different assessors for structural joint disease using plain radiography and MSU crystal deposition using DECT did not allow us to systematically examine whether MSU crystals identified at sites of damage were in direct contact with the bone or cartilage structures. However, inspection of the CT images shown in figure 1 demonstrates that, at some erosion sites, soft tissue is present between MSU crystals and the bone surface. It is well recognised that the tophus consists of MSU crystals and the host tissue response to these crystals.8 Further analysis is now required to dissect the relationship between MSU crystals, the host tissue response and joint damage.
MSU crystals were observed by DECT scanning in only 16.6% of all joints and 38% of first MTPJs. Furthermore, MSU crystals were not observed in all joints with bone erosion and other changes of structural damage. The linear relationship between erosion size and DECT MSU crystal deposition suggests that the resolution of DECT may not be sufficient to identify very small, microscopic areas of MSU crystal deposition associated with small erosions. Recent comparisons of DECT scanning and microscopic analysis have shown that colour-coded DECT scanning identifies areas of densely packed MSU crystals, but has lower sensitivity for sites where MSU crystals are less dense.21 ,22 The incomplete relationship between structural joint damage and DECT MSU crystal deposition may also be partly related to the DECT settings selected for this study. We used the widely reported ratio of 1.28. This ratio is associated with low rates of non-specific artefact, but may have lower sensitivity to detect all urate deposits.23 Most of the participants were taking urate-lowering therapy, and it is also possible that the lack of MSU crystals in some joints with radiographic damage reflects the effects of treatment in those on long-term effective urate-lowering therapy rather than the absence of MSU crystals at the time that joint damage occurred. The finding that SU concentrations correlated with the number of joints with DECT urate deposition supports this possibility. However, the relationship between DECT MSU crystal deposition and structural joint damage persisted after SU concentrations and SU targets were included in the analysis models.
Consistent with the clinical presentation of acute gout flares, MSU crystal deposition and structural joint disease was most frequently observed at the first MTPJ and least frequently at the third and fourth MTPJs. The cause of this pattern of joint involvement is unclear, but may relate to reduced physical stress or biomechanical load during the gait cycle in these joints, compared with the other MTPJs.24 A further noteworthy finding from this study was that certain features of radiographic damage were less strongly associated with DECT MSU crystal deposition. This was particularly the case for joint space narrowing and osteophytes. It is well recognised that gout flares frequently occur in joints affected by osteoarthritis.25 However, osteoarthritis is frequently observed in people without gout and cannot be considered specific for this condition. In contrast, the presence of bone erosion and spurs is less common in the general population. The stronger relationship between DECT MSU crystal deposition and the more specific features of gout provides further support for the possibility that MSU crystals directly influence development of structural damage in gout.
Our analysis of bone sclerosis showed a strong relationship between sclerosis and DECT urate deposition, but that many joints with bone sclerosis did not have DECT urate deposition. Bone sclerosis may occur as part of the healing of erosions in the context of urate-lowering therapy.26 However, the current analysis did not show important differences in the relationship between sclerosis and DECT urate deposition following stratification to SU target. Furthermore, we did not observe a significant inverse relationship between SU and bone sclerosis in the correlation analysis, and the relationship between sclerosis and DECT urate deposition persisted in the regression analysis after SU was added to the models.
The findings from this imaging study raise the possibility that intensive urate-lowering therapy may have clinical benefits in the prevention or healing of structural joint damage in people with gout. To date, very few studies have addressed this concept. In a 10-year study of 39 patients with gout, these was no relationship between SU concentrations and radiographic change (assessed in a qualitative manner).27 More recently, we have reported the effects of pegloticase in a small series of patients with tophaceous gout over a 1-year period.26 In these patients, who all had profound reduction in their SU concentrations (<1 mg/dL during treatment), improvements were observed in Sharp–van der Heijde bone erosion scores, but not joint space narrowing scores on plain radiography. Increased bone sclerosis was also observed in those bones with filling-in of erosion.26 The current study provides further rationale for well-controlled clinical trials examining the effects of therapies that reduce the SU concentration to subsaturation levels on structural joint damage in people with early and advanced disease.
References
Supplementary materials
Supplementary Data
This web only file has been produced by the BMJ Publishing Group from an electronic file supplied by the author(s) and has not been edited for content.
Files in this Data Supplement:
- Data supplement 1 - Online supplement
- Data supplement 2 - Online tables
Footnotes
Handling editor Tore K Kvien
Contributors ND (the guarantor) accepts full responsibility for the work and the conduct of the study, had access to the data and controlled the decision to publish. ND conceived of the study, scored the plain radiographs, contributed to the data interpretation and drafted the manuscript. OA recruited patients, scored the DECT scans and managed the data entry. RK contributed to study design and scored the DECT scans. GDG assisted with data analysis. AH contributed to patient recruitment and data management. FMM and AJD contributed to study design, data interpretation and manuscript drafting. All authors read and approved the final manuscript.
Funding This project was funded by the Health Research Council of New Zealand (grant number 09/111D).
Competing interests None.
Patient consent Obtained.
Ethics approval Northern X Regional Ethics Committee.
Provenance and peer review Not commissioned; externally peer reviewed.