Article Text

Abstract
Objective To identify differentially expressed genes in peripheral blood mononuclear cells (PBMCs) from patients with ankylosing spondylitis (AS) compared with healthy individuals.
Methods RNA was extracted from PBMCs collected from 18 patients with active disease and 18 gender-matched and age-matched controls. Expression profiles of these cells were determined using microarray. Candidate genes with differential expressions were confirmed in the same samples using quantitative reverse transcription-PCR (qRT-PCR). These genes were then validated in a different sample cohort of 35 patients with AS and 18 controls by qRT-PCR.
Results Microarray analysis identified 452 genes detected with 485 probes which were differentially expressed between patients with AS and controls. Underexpression of NR4A2, tumour necrosis factor AIP3 (TNFAIP3) and CD69 was confirmed. These genes were further validated in a different sample group in which the patients with AS had a wider range of disease activity. Predictive algorithms were also developed from the expression data using receiver-operating characteristic curves, which demonstrated that the three candidate genes have ∼80% power to predict AS according to their expression levels.
Conclusions The findings show differences in global gene expression patterns between patients with AS and controls, suggesting an immunosuppressive phenotype in the patients. Furthermore, downregulated expression of three immune-related genes was confirmed. These candidate genes were also shown to be strong predictive markers for AS.
Statistics from Altmetric.com
Introduction
Ankylosing spondylitis (AS) is characterised by inflammatory arthritis with a characteristic distribution affecting primarily the sacroiliac joints and spine, which leads to new bone formation in affected joints and their ultimate fusion. The underlying causes of both the inflammation and the progression to uncontrolled bone formation are poorly understood.
One approach to identifying the changes underlying the initiation and progression of the disease is to undertake a genome-wide expression analysis to identify genes whose expression is altered in affected individuals. A number of microarray-based studies have previously been undertaken in AS. These include studies of response to treatment within a patient group,1 or of gene expression profiles of specific cell and tissue types such as macrophages2 or gut biopsies.3 Two previous case–control studies of gene expression profiles in AS peripheral blood samples have used small gene subsets4 5 which do not allow whole-genome expression analysis.
The inflammatory nature of AS suggests that gene changes will occur in the white blood cell population that forms the basis for the immune system. We therefore undertook a genome-wide microarray expression analysis using Illumina chips covering 48 000 known genes and expressed sequence tags on peripheral blood mononuclear cells (PBMCs) from 18 patients with active AS and 18 age-matched and gender-matched controls. This study identified several candidate genes, which we then confirmed by quantitative reverse transcription-PCR (qRT-PCR) in a different sample population. The immunological nature of the candidate genes highlights likely immune processes altered in the development of AS. Further, identification of gene expression patterns corresponding to disease status can be used to develop predictive algorithms.
Materials and methods
Detailed experimental protocols can be found online in supplemental methods.
Study subjects
For the microarray experiment, we studied 18 patients classified as having AS according to the modified New York criteria and 18 gender-matched and age-matched healthy controls (±5 years).6 Cases were selected for relatively active disease, with Bath Ankylosing Spondylitis Disease Index scores of >4.0, and/or raised C-reactive protein concentrations >10 mg/l and/or erythrocyte sedimentation rates >25 mm/h. Other characteristics of the study subjects are given online in supplementary table 1.
Candidate genes were validated in a second larger cohort of another 35 patients with AS and 18 healthy controls (full details included in supplementary table 2 online).
Peripheral blood samples were collected into heparinised tubes, and PBMCs immediately isolated by Ficoll-Paque density gradient centrifugation.7
RNA processing and array analysis
Total RNA was extracted from 107 PBMCs, quantified and assessed with an Agilent 2100 BioAnalyser (Agilent, Santa Clara, California, USA), with only samples with a RNA integrity number above 7.5 used. cRNA was generated from 500 ng total RNA using the Illumina TotalPrep cRNA Amplification Kit and hybridised to Human HT-12 V3 Expression BeadChips (Illumina, San Diego, California, USA). Array data were processed using the Illumina BeadStudio software and then transformed by variance stabilisation transformation8 and normalised by robust spline normalisation9 using Lumi.10 Gene expression analyses were performed using BRB-ArrayTools developed by Dr Richard Simon and the BRB-ArrayTools Development Team at the National Cancer Institute, Bethesda, Maryland, USA.11 Differentially expressed genes were identified by unpaired t test with multivariate permutation correction. The predictive power of the differentially expressed genes from the array data was calculated with a receiver-operating characteristic (ROC) curve based on a Bayesian Compound Covariate Predictor in BRB-ArrayTools. ROC curves from the qRT-PCR data for the individual candidate genes were calculated in SPSSv17.0. ROC curves were also generated to calculate the predictive power for the combined qRT-PCR data from the three candidate genes by calculating the optimal gene expression level delineating AS from controls for each gene (Youden Index, J).12 A ROC curve was then calculated based on these data using Jrocfit.13 Network analysis was carried out using Ingenuity Pathways Analysis v7 (Ingenuity Systems, http://www.ingenuity.com).
Candidate gene validation
Candidate genes identified from the array studies were confirmed by qRT-PCR in the array samples, then validated in the second sample cohort. Candidate genes were assayed using predesigned TaqMan assays and were normalised using the housekeeping gene, RPL32, by SYBR green-based qRT-PCR.14 Data were analysed with the Mann–Whitney test, and p values <0.05 were considered significant.
Results
Differential gene expression in patients with AS and controls
Of the 48 000 probes on the array, 17 308 were found to be expressed in at least one sample and were thus included for analysis. Unsupervised hierarchical clustering using this probeset showed good delineation between patients with AS and healthy controls; only two patients and three controls were misclassified (figure 1). Supervised clustering showed that samples did not cluster according to gender, age, or their treatment regimen (whether receiving anti-tumour necrosis factor (anti-TNF) agents or corticosteroids) (data not shown), suggesting that affection status was in fact the major determinant of expression patterns.

Unsupervised hierarchical clustering of 34 samples based on expression levels detected in the microarray experiment using 17308 probes flagged as present. Samples are clustered on the horizontal axis, with the vertical axis representing the degree of correlation between samples. The lengths of the branches are indicative of the similarities between samples or genes. Note that only two ankylosing spondylitis samples and three controls are misclassified.
To identify the genes determining the clustering, we carried out an unpaired t test corrected for multiple comparisons. A total of 485 probes representing 452 genes were identified as being significantly different between patients and controls with a p value ≤0.0005 (corrected for false discovery rate) (online supplementary table 3). The magnitude of differential expression observed was generally low, with only eight genes showing a significant fold-change >2 (with the maximum fold-change being 2.7) and 42 genes >1.5-fold. Interestingly, all the genes showing >2-fold change and 31 of the 42 genes showing >1.5-fold-change were downregulated. To confirm the validity of this probeset, it was then used to recluster the samples, resulting in an improved delineation between the AS and control samples, with only two controls being misclassified (figure 2).

Unsupervised hierarchical clustering of 34 samples based on expression levels detected in the microarray experiment using the 485 probes differentially expressed between ankylosing spondylitis (AS) and control samples. AS samples are in red and control samples are blue. Samples are clustered on the horizontal axis and genes clustered on the vertical axis. The lengths of the branches in the dendrograms represent the degrees of correlation between samples or genesets. For expression levels, yellow represents overexpressed genes and red underexpressed genes. Note that only two control samples were misclassified in this analysis.
Candidate genes for further analysis were selected on the basis of their p value, fold-change and biological relevance (assisted by pathways analysis). Four genes were selected for confirmation studies: nuclear receptor subfamily 4, group A, member 2 (NR4A2) (AS/control=0.54, p<0.00002); TNFα-induced protein 3 (TNFAIP3, also known as A20) (AS/control=0.57, p=0.0003); CD69 (AS/control=0.53, p<0.0005); RAR-related orphan receptor A (RORA) (AS/control=0.63, p=1.2×10⁻⁶) for further validation by qRT-PCR.
qRT-PCR validation and confirmation
The four selected genes were initially validated by qRT-PCR in the RNA samples used for the microarrays, termed the discovery set. As expected, the qRT-PCR data showed significant differences between the controls and patients and confirmed the direction of the fold-changes (figure 3A). For NR4A2 (0.54-fold to 0.17-fold) and TNFAIP3 (0.57-fold to 0.22-fold), these fold-changes also increased significantly.
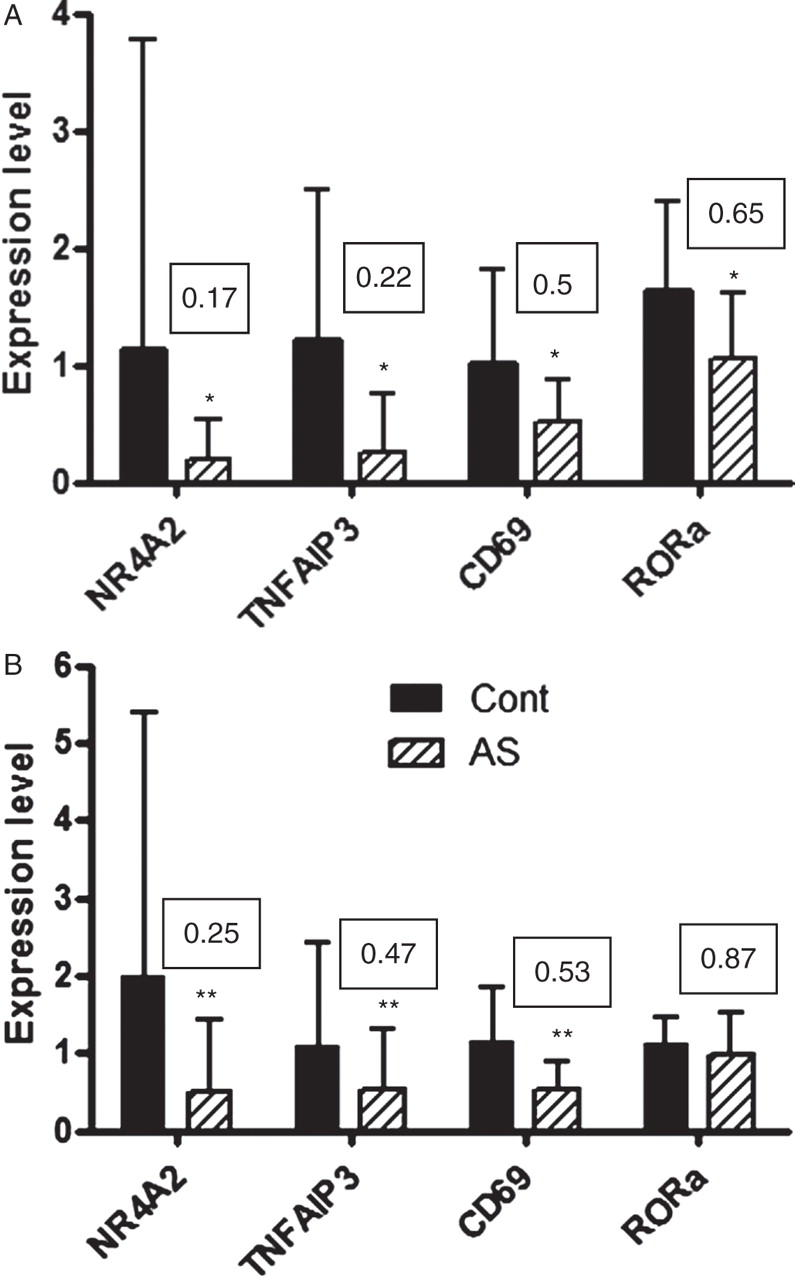
Quantitative reverse transcription-PCR data from discovery and confirmation sample sets. NR4A2, TNFAIP3 and CD69 expression levels were significantly reduced in patients with ankylosing spondylitis (AS) in both (A) the samples used for the array analysis (n=17 AS and 17 controls) and (B) a second population of patients and controls with wider disease severity and non-age matched and sex matched (n=35 AS and 18 controls). RAR-related orphan receptor A (RORA) expression levels were only reduced in the array samples (A). Boxed numbers represent fold-changes in expression, AS/control. *p<0.05, **p<0.01, AS versus control.
Expression levels of the candidate genes were then measured in a confirmation sample set consisting of a further 35 patient samples which were not selected for disease activity and 18 control samples. NR4A2, TNFAIP3 and CD69 were significantly downregulated in the AS samples in this dataset as well (figure 3B). RORA showed only a small non-significant decrease in this dataset (0.87-fold, p=0.08).
To assess the power of the differentially expressed genesets to predict AS, we generated ROC curves. As would be expected, using the expression levels from the array data for the 452 genes differentially expressed between AS and control samples, the ROC curve generated was an almost perfect classifier with an area under the curve (AUC) of 97% (figure 4A). The individual predictive power for the three validated candidate genes was then tested within the discovery array set and also showed good predictive power, with AUCs ∼74% (figure 4B, inset). When these three genes were combined, the AUC was 81%, a strong classifier (figure 4B). The predictive power of the three candidate genes was then applied to the confirmation dataset. With this less selective and more diverse group, the three genes generated individual AUCs of 72–78% (figure 4B, inset) and a combined AUC of 77% (figure 4B).

Receiver-operating curves (ROC) showing predictive power of identified genesets. (A) ROC curve generated from array expression values for the 452 genes significantly different between ankylosing spondylitis and control samples. (B) ROC curves generated from the combined quantitative reverse transcription-PCR data for the three candidate genes from the discovery and confirmation sample sets. Area under curve (AUC) represents prediction power. Inset in (B) are the AUC values from the ROC curves for the individual candidate genes.
Using Ingenuity Pathways Analysis (Ingenuity Systems, Redwood City, California, USA), in silico associations between candidate gene datasets and documented biological pathways and disease conditions can be assessed. Using our 452 differentially expressed gene dataset, subsets of genes within this dataset were identified as being significantly associated with juvenile rheumatoid arthritis (RA) (p<1×10⁻⁶), RA (p=2.8×10⁻⁵), rheumatic disease and arthritis (p<1×10⁻³), immunological disorders (p=1.8×10⁻⁵) and autoimmune disease (p=9×10⁻⁶). A further association of this 452 differentially expressed gene dataset with the JAK/STAT canonical signalling pathway (p=2.5×10⁻⁵) was also seen.
Discussion
Identification of the underlying gene expression changes that mediate AS will provide valuable insights into the pathological changes leading to disease. In this study, we have delineated the changes in the peripheral blood population to reflect changes that might occur at the systemic level rather than locally at affected joints. By targeting this population, we hope to elucidate changes that may reflect changes in the immune cell population that lead to the susceptibility, initiation and progression of AS.
The study described here showed 452 genes to be differentially expressed between AS patients and controls. This is somewhat higher than other comparable analyses carried out in patients with AS or spondyloarthropy (SpA).2 3 15 This may well reflect the powerful dataset used (34 gender-matched and age-matched patients and controls) and the more diverse geneset present in PBMCs rather than selected cell and tissue subsets.2 3 The magnitudes of the changes in gene expression were not large. This might be expected since, although studying the PBMC population presents a large number of cell types and associated genes, it must be assumed that the changes underlying the disease status are probably contributed by a relatively small subset of circulating cells. Thus a ‘gene dilution’ effect may be in evidence where this small subset of cells may be showing substantial gene expression changes, but these are buffered by the much larger unaffected cell population.
Within the 452 genes that were differentially expressed, there were a number of strong candidate genes for further study. In this report, we have selected four of the strongest candidates for further analysis. The validation of the array data followed by confirmation in another separate set of patients and controls strongly underlines the validity of the candidate genes, and is the first such study in AS/SpA to adopt such a vigorous genome-wide approach with a case–control design. As expected, qRT-PCR validated the array findings with increased fold-changes in NR4A2 and TNFAIP3. Such increases in fold-change in validation studies are often seen, reflecting the greater sensitivity of this technique.
NR4A2 is an orphan nuclear receptor with an unknown ligand. Previously, it has been associated with a number of neurological conditions as well as vascular disease. Immunologically, NR4A2 has been associated with T cell subset communication16 and the macrophage inflammatory response.17 Increased NR4A2 expression has also been seen in psoriasis with a corresponding decrease after anti-TNF treatment.18 Upregulation of NR4A2 expression has also been reported in another autoimmune disease, multiple sclerosis19 and the mouse model, experimental autoimmune encephalomyelitis.20 A protective role in cartilage homoeostasis has also been proposed for NR4A2,21 and increased levels have also been documented in RA synovium, perhaps as a repair response to inflammation.22 In this study, NR4A2 expression was decreased in patients with AS, possibly reflecting differences in the pathogenesis of AS to these other autoimmune conditions; however, clearly NR4A2 plays a role in inflammation.
TNFAIP3 (A20) production is induced by the proinflammatory cytokine, TNFα, serving as a negative feedback system in the TNFα-induced nuclear factor κB activation and apoptosis.23 Knockout mice for this gene develop multiorgan inflammation, including inflammation of the joints.24 Genetic association of TNFAIP3 with RA,25 psoriasis,26 systemic lupus erythematosus27 28 and type 1 diabetes29 has also been demonstrated. Thus TNFAIP3 has been proposed to be a critical anti-inflammatory molecule acting to control prolonged inflammation. We observed markedly decreased levels of TNFAIP3 expression in patients with AS, which may contribute to the chronic invasive immune processes in these patients, resulting from an initial aberrant inflammation. Our results are consistent with those from a previous gene expression profiling study in macrophages derived from AS patients,2 which also found decreased TNFAIP3 expression in patients with AS.
CD69 is an early leucocyte activation cell surface molecule expressed at sites of active inflammation.30 31 Its exact role or mechanisms of action are not at present known, with no ligand having been identified. Similarly to NR4A2 and TNFAIP3, we saw a downregulation of this molecule. This is in contrast with the observation of upregulation of CD69 protein expression in a smaller study, where CD69 cell surface expression was compared in natural killer cells from seven patients with AS and six healthy controls.32 These differences may reflect that natural killer cells were specifically selected for this study compared with our full range of PBMC populations. Whether CD69 molecules act in a proinflammatory33 34 or immunoregulatory31 34 fashion is still not clear.
Both CD69 and NR4A2 have been proposed to have a proinflammatory role, with TNFAIP3 hypothesised in an anti-inflammatory role. This suggests that downregulation of these three genes may reflect a reduced inflammatory response. It has been hypothesised in the pathogenesis of Crohn's disease, which is a condition that is often concurrent with AS,35 that patients develop the disease because they have primary defects in their ability to clear pathogens from the gastrointestinal tract. This leads to other entities in the immune system, such as T helper 1 (TH1) cells, becoming hyperactive in order to compensate for the defects, and disease pathology results.36 37 AS pathology might develop by similar mechanisms. However, a causal relationship between differential gene expression patterns and AS cannot be concluded from genomic studies such as this. The immunosuppressive phenotype may be a secondary effect induced by inflammation to control the excessive immune response.
The fact that the Ingenuity Pathways Analysis confirmed the strong association of the differentially expressed geneset with a number of arthrites and immune disorders supports the use of PBMCs as a suitable tissue source to investigate gene expression changes in AS. A further interesting finding was the identification of the JAK/STAT signalling pathway as the most strongly associated ‘canonical pathway’ with the AS cohort. The recently discovered proinflammatory TH17 pathway38 has been associated with AS, with a key component of the pathway, the interleukin 23 (IL-23) receptor (IL-23R), showing a strong genetic association with AS.39 Subsequently, increased numbers of TH17 cells have also been identified in the peripheral blood of patients with AS.40 Key downstream signalling molecules of IL-23 in TH17 cells are STAT3 and JAK2 in the JAK/STAT signalling pathway.41 Both STAT3 and JAK2 have also been shown to be genetically associated with inflammatory bowel disease.42 Interestingly, a key transcription factor in TH17 differentiation, RORα,43 was also significantly downregulated in the active AS samples (although in the more diverse confirmation cohort the difference between cases and controls was marked with only borderline significance). However, neither IL-23R nor IL-17 were expressed at significant levels in either AS or control samples, so no changes in these TH17 markers were seen.
A number of previous studies have undertaken expression profiling in PBMCs from patients with inflammatory arthrites, such as juvenile idiopathic arthritis,15 44 psoriatic arthritis,45 RA46 47 and ‘autoimmune arthritis’ (a combination of RA and systemic lupus erythematosus),48 and one study that assessed a pool of autoimmune conditions including cases with early and established RA.49 CD69 expression was shown to be increased in psoriatic arthritis PBMCs.45 Regarding NR4A2, further analysis of the raw data from the study of PBMC gene expression in juvenile idiopathic arthritis suggests that, in this condition, it is also upregulated.15 No significant changes in any of our three candidate genes were documented in the other studies.44 46,–,50 This suggests that, although NR4A2, CD69 and TNFAIP3 are inflammation-associated genes, they are not standard inflammatory markers in the PBMC population and the fact that we see downregulation of these markers supports a unique AS-associated profile. Another study analysed the effect of anti-TNF therapy in PBMCs only from patients with AS, but did not document any changes in any of our candidate genes in response to therapy.1
Identification of gene expression patterns correlating with disease states also presents the opportunity to develop predictive algorithms. Using ROC curves, we have shown that as few as three genes can provide a good predictive classification for AS, with 81% power in the original discovery array dataset and 77% in the confirmation set. This presents good opportunities to expand the currently limited diagnostic options for AS, such as radiographic imaging and inflammatory markers. Further studies investigating the predictive capacity of these tests in different populations and in cases with a broader range of clinical phenotypes will be required. It will also be interesting to see if these genes can be used to identify early AS cases before radiographic progression. Nonetheless, the confirmation of our findings in the validation set, which is representative of the general AS population in terms of disease activity and duration, suggests that this approach has significant potential.
The results of the study described here validate a microarray approach in the circulating PBMC population to identify potentially key genes in the pathogenesis of AS. Such an approach may also lead to new diagnostic indicators that may increase early detection of AS. Such an approach is valuable because of the scarcity of sample availability from inflammatory sites for this disease, as well as illustrating early global changes that may help elucidate the establishment of AS, which is currently poorly understood.
References
Supplementary materials
Web Only Data ard.2009.111690
Files in this Data Supplement:
Footnotes
-
Funding We thank the Rebecca L Cooper Medical Research Foundation, the Australian Cancer Research Foundation and Arthritis Australia for funding this project. GT is the recipient of a Lions Medical Research Foundation Senior Research Fellowship, and MB is the recipient of a NHMRC Principal Research Fellowship No 455836.
-
Competing interests None.
-
Ethics approval This study was conducted with the approval of the University of Queensland Human Ethics Committee.
-
Provenance and peer review Not commissioned; externally peer reviewed.