Article Text

Abstract
Objectives: Studying post-infliximab gene expression changes could provide insights into the pathogenesis of ankylosing spondylitis (AS).
Methods: Gene expression changes were screened by microarray on peripheral blood RNA of 16 AS patients at baseline and 2 weeks post-infliximab, and selected results were confirmed by quantitative real-time (qRT)–PCR. Corresponding serum-soluble LIGHT (sLIGHT) was estimated by ELISA and the fold change in sLIGHT was correlated to the fold change in erythrocyte sedimentation rate (ESR), C-reactive protein (CRP) and the Bath AS disease activity index.
Results: Post-infliximab, 69% of the patients (11/16) achieved an ASAS20 response. Six candidate genes were differentially expressed by microarray; four of which were validated by qRT–PCR. sLIGHT showed the most significant difference. There was good correlation of baseline sLIGHT with CRP (R = 0.60; p = 0.01) and ESR (R = 0.51; p = 0.04). The fold change in sLIGHT correlated with change in both CRP (R = 0.71, p = 0.002) and ESR (R = 0.77, p<0.001).
Conclusion: LIGHT is significantly downregulated by infliximab. sLIGHT correlated well with changes in inflammatory markers.
Statistics from Altmetric.com
Ankylosing spondylitis (AS), the prototypic form of spondylarthritis, can lead to significant disability and impairment in quality of life.1 The pathogenesis of AS is not well understood. The traditional search for pathogenic factors involves a hypothesis-driven “directed search” for critical biological events and carries with it an inherent danger of overlooking unanticipated links. In contrast, a broad screening approach could identify novel factors that are pathogenically important.
Distinctive gene expression signatures have been identified in a number of diseases.2 3 4 A recent genome-wide single nucleotide polymorphism association study confirmed the association of IL23 receptor and aminopeptidase-regulating tumour necrosis factor (TNF) receptor-shedding 1 polymophisms with AS.5 Microarray studies have also shown differences between AS patients compared with rheumatoid arthritis and normal controls.4 Gene expression analysis of peripheral blood macrophages from patients with spondyloarthritis revealed a reverse interferon signature.6
As a result of disease heterogeneity, it is a challenge to capture the salient differences in gene expression on comparing AS patients with normal or disease controls. One way to overcome this complexity would be to compare the same patient before and after effective treatment. Significant and rapid improvements in disease activity and functional status have been documented in patients receiving anti-TNF agents.7 8 The effects of anti-TNF agents go beyond the suppression of TNF alone.9 Therefore, studying the changes that parallel the clinical improvement could provide a means to unravel the fundamental mechanisms underlying AS. In this study, we used the microarray technique to track gene expression changes in the peripheral blood of patients with AS before and after anti-TNF therapy. LIGHT (lymphotoxins exhibiting inducible expression and competing with herpes simplex virus glycoprotein D for herpesvirus entry mediator (HVEM), a receptor expressed by T lymphocytes) was found to be the most significantly affected gene.
Patients and methods
Patients satisfying the modified New York criteria for AS were selected from participants of the Canadian Low-dose Efficacy (CANDLE) study (study P04352; clinicaltrials.org identifier NCT00202865). The CANDLE study involved examining the effect of low-dose infliximab (3 mg/kg) in AS therapy and all 16 patients (three women) seen in a single centre, were included. At baseline and at week 2 post-infliximab, a detailed clinical examination was done. The Bath ankylosing spondylitis disease activity index (BASDAI) and the Bath ankylosing spondylitis functional index (BASFI) were recorded. Peripheral blood samples were collected for laboratory studies. Patients achieving an ASAS20 response were considered responders. The study was approved by the University Health Network ethics board and all patients gave written informed consent.
Microarray analysis
For the microarray analysis, RNA profiling was done using Affymetrix U133Plus 2.0 GeneChip on peripheral blood RNA collected using TRIzol reagent (Invitrogen Corp, Carlsbad, California, USA) from seven patients before and after infliximab infusion. RNA samples were reverse transcribed to complementary DNA and labelled with Cy3 or Cy-dUTP fluorescent dye (Amersham Biosciences, Piscataway, New Jersey, USA) and applied to the microarray slides and incubated at 37°C overnight. Cy3-labelled universal human reference RNA (Stratagene, La Jolla, California, USA) was used as the reference control for hybridisation.
The GMS 428 Array Scanner (Affymatrix, Santa Clara, California, USA) was used. Lowes normalisation was performed to remove dye bias and unreliable low intensity genes were removed (GeneSpring v6.0; Silicon Genetics, Redwood City, California, USA).
Quantitative polymerase chain reaction
Confirmation of the microarray results was done using quantitative real time PCR (qRT-PCR; SYBR green PCR kit; Qiagen, Ontario, Canada) if the genes showed at least a 1.2-fold change post-infliximab. RNA was available from 14 patients. qRT-PCR results could not be obtained in two patient samples due to technical reasons (poor quality or suboptimal yield of RNA).
Estimation of serum sLIGHT level
Based on the results of the microarray and quantitative PCR analyses and the recognition that LIGHT (TNFSF14) is an important member of the TNF superfamily, soluble LIGHT (sLIGHT) was assayed on the sequential serum samples from all 16 patients by ELISA (R&D Quantikine kit; R&D, Minneapolis, USA).
Statistics
Differentially expressed genes in microarray were identified by the Welch t test and paired t test. Fold difference in messenger RNA expression was calculated by dividing the post-treatment value by the baseline value. The Wilcoxon signed rank test and Fisher’s exact test were used when relevant.
Results
Significant improvement in clinical parameters following infliximab
Sixteen patients receiving an infliximab infusion had baseline and week 2 samples available for analysis (table 1). The median age (interquartile range; IQR) of the patients was 42.5 years (32–52.5) and the median duration (IQR) of the disease was 12 years (9–24). 81.25% (13/16) of the patients were positive for HLA B27.
Baseline demographic features and post-infliximab changes in inflammatory parameters
The median (IQR) pre-infusion BASDAI and BASFI were 7.1 (5.4–8.1) and 6.9 (5.8–8.3), respectively. The median (IQR) baseline CRP and ESR were 21 mg/l (5–38) and 12 mm/h (5.3–35.8), respectively. At 2 weeks, 69% (11/16) of the patients achieved ASAS20 response criteria and 38% (6/16) of the patients achieved ASAS40 response criteria. At 2 weeks following the infliximab infusion, there was a significant improvement in BASDAI, BASFI, spinal pain, CRP and ESR (table 1).
Differential expression of genes following infliximab identified by microarray
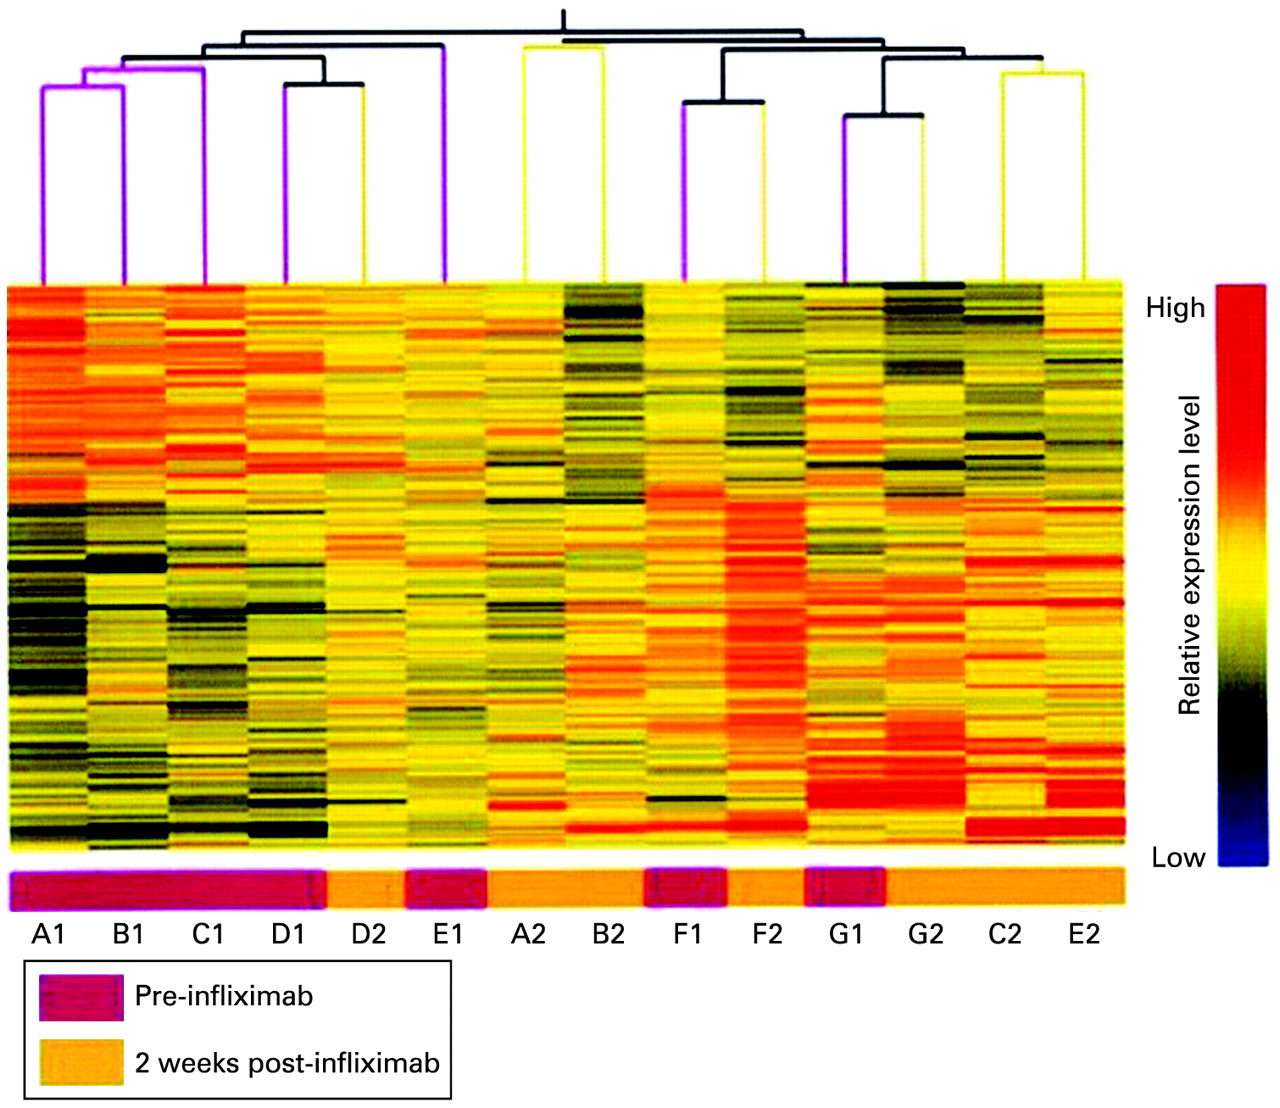
Out of 47 000 transcripts in the Affy U133plus2.0 GeneChip, 25 000 transcripts were detectable in our cohort. Among them, 1428 genes were differentially expressed in the post-infliximab samples (p<0.05) in comparison with baseline (fig 1). Six candidate genes were selected for validation by quantitative PCR on the basis of a significant change of at least 1.2-fold in gene expression and their involvement in TNF signalling pathways.

Fourteen blood RNA samples from seven subjects (A–G) with active ankylosing spondylitis were profiled on Affymetrix GeneChip U133plus2.0. A total of 1428 probe sets was identified as significant with paired t test and Welch t test (p<0.05). Pre-infliximab (A1 to G1) and 2 weeks post-infliximab (A2 to G2).
Quantitative PCR confirmed the results of microarray
Significant change in gene expression following infliximab therapy was seen for the following candidate genes: LIGHT, interferon α receptor 1 (IFNAR1), IL17R, erythropoietin receptor (EPOR), TNFα-induced protein 1 (TNFAIP1) and IL21R. By quantitative PCR, we confirmed significant changes in only four of these genes (expressed as fold decrease in parenthesis) LIGHT (1.64), IFNAR1 (1.49), IL17R (1.40) and EPOR (1.52). LIGHT was the most significantly downregulated gene.
As LIGHT is a new addition to the TNF superfamily and has never been studied in AS, sLIGHT was selected for further study by ELISA.
sLIGHT correlates with inflammatory markers
The median (IQR) sLIGHT level, estimated by ELISA, in the patients at baseline was 259.5 pg/ml (113–332). There was good correlation (fig 2 A and B) of baseline sLIGHT with baseline CRP and ESR but not with BASDAI. The post-infliximab reduction in sLIGHT was not statistically significant. There was good correlation between the fold change in sLIGHT (fig 2 C and D) with that of both CRP (R = 0.71, p = 0.002) and ESR (R = 0.71, p = 0.002), but not with the fold change in BASDAI.

Pre-infusion levels of sLIGHT were well correlated with the levels of C-reactive protein (CRP) (A) and erythrocyte sedimentation rate (ESR) (B). The fold change in sLIGHT post-infusion had good correlation with the change in CRP (C) and ESR (D).
Out of the 14 patients in whom qRT-PCR for LIGHT mRNA expression was analysed, 11 were clinical responders (table 1). There was no significant difference between responders and non-responders, with respect to the number of patients with a decrease in either sLIGHT serum levels or LIGHT mRNA expression.
Discussion
Our findings indicate that there is a rapid gene expression profile change in blood samples after anti-TNF treatment in AS patients. LIGHT was the most significantly downregulated gene. The fall in sLIGHT levels and inflammatory markers was strongly correlated. This is the first report to implicate LIGHT as a possible inflammatory mediator in AS.
LIGHT is a newly identified member of the TNF superfamily, affecting the development and functioning of a wide range of cells.10 It is expressed by activated T lymphocytes, monocytes, granulocytes, splenic cells and immature dendritic cells. LIGHT interacts with three different receptors, the lymphotoxin β receptor, the HVEM and the soluble decoy receptor. The LIGHT–HVEM interaction recruits TRAF2 and TRAF5, which in turn results in the release of nuclear factor kappa B and activator protein 1.11 There is some evidence that LIGHT may play a role in rheumatoid arthritis and inflammatory bowel disease.12 13
The LIGHT–HVEM axis is considered co-stimulatory for T cells.14 Our results showed a concurrent fall in LIGHT and laboratory parameters of inflammation. The absolute sLIGHT levels were not significantly different before and after infliximab. This might be partly due to the lability of sLIGHT, and we have not measured the changes in intracellular and cell surface LIGHT. It is now accepted that even composite measures such as BASDAI also do not reflect disease activity in AS completely and lack face and construct validity.15 Unlike objective criteria such as the disease activity score for rheumatoid arthritis, clinical response in AS is assessed by subjective criteria such as ASAS response. In our study, sLIGHT had excellent correlations with ESR and CRP, yet proved to be dissociated with the clinical response. There might be a time gap between the changes in inflammatory mediators and the appearance of a subjective feeling of improvement. Our sample size is modest as this was a hypothesis generating pilot study.
Anti-TNF treatment thus leads to a significant alteration of gene expression, and systematic gene expression analysis can shed new light on pathogenic pathways that are important in the chronic inflammation of AS. LIGHT is the most significantly downregulated gene following infliximab infusion and serum sLIGHT levels correlate well with inflammatory markers.
REFERENCES
Footnotes
Competing interests None.
Ethics approval The study was approved by the University Health Network ethics board.
Patient consent Obtained.