Article Text

Abstract
Objective: To investigate the relationship of the polymorphic enhancer HS1,2 central to the 3′ enhancer complex regulatory region (IgH3′EC) of the immunoglobulin heavy chain genes with systemic sclerosis (SSc) disease and compare it with HLA-DR and DQ associations.
Methods: A total of 116 patients with SSc were classified as diffuse (dSSc) or limited (lSSc), and as carriers of antitopoisomerase I (anti-Scl70) or anticentromere (ACA) antibodies. Allele and genotype frequencies were assessed in the population as a whole and in the two major subsets, dSSc and lSSc. The concentration of peripheral blood immunoglobulin levels was also determined and analysed according to the genotypes.
Results: The analysis of genotypes for the four alleles of the HS1,2A enhancer showed an increased frequency of allele *2 in the SSc cohort highly significant versus controls (57% vs. 40%, p<0.0001). Considering the autoantibody pattern, we found that the frequency of the 2/2 genotype was increased in ACA+ patients (42%) and anti-Scl70+ patients (31%) compared with the control group (15%). The differences of allelic frequencies among dSSc versus lSSc or ACA+ versus anti-Scl70+ patients were not significant, although highly significant when comparing each subgroup with the control group. HLA-DRB1*11 and DQB1*03 associated with SSc. No association was seen between HS1,2A enhancer polymorphism and HLA alleles.
Conclusions: These data confirm there was an increased risk of having SSc in carriers of allele *2, suggesting an intriguing function of this polymorphism for B-cell regulation.
- CI, confidence interval
- DLCO, diffusion capacity for carbon monoxide
- FVC, forced vital capacity
- HRCT, high resolution computed tomography
- OR, odds ratio
- PCR, polymerase chain reaction
Statistics from Altmetric.com
- CI, confidence interval
- DLCO, diffusion capacity for carbon monoxide
- FVC, forced vital capacity
- HRCT, high resolution computed tomography
- OR, odds ratio
- PCR, polymerase chain reaction
All autoimmune diseases are characterised by organ damage due to inflammation and/or tissues fibrosis. Two fundamental aspects of these diseases are the loss of tolerance as the primary event conditioning the autoreactivity and the production of autoantibodies directed against self antigens.1,2 Autoimmune diseases differ each from the other in terms of organ involvement, systemic inflammation, long-term prognosis regarding survival and/or disability.
Systemic sclerosis (SSc) is a fibrotic vasculopathy; phenotypically it is characterised by two subsets that differ in involvement of the skin: a limited form (lSSc) and a diffuse form (dSSc). The two subsets are characterised by the production of two almost specific autoantibodies, the anticentromere antibodies (ACA) in lSSc, and the antitopoisomerase I (anti-Scl70) in dSSc.3 The disease is therefore characterised by important B-cell activation. B-cell activation is thought to be T related, and sometimes it appears to be T independent.4,5 Recent findings suggest that B cells could be essential for disease expression by acting as antigen-presenting cells, or by contributing to local inflammation through the secretion of cytokines.6,7
A crucial step in evaluating any possible future molecular or pharmacological control of autoantibody synthesis could be the understanding of the function of genes controlling the synthesis of immunoglobulins, of polymorphic genes enhancing the function of immunoglobulin genes and of genes controlling isotype switching. In this regard SSc, an autoimmune disease characterised by the synthesis of certain autoantibodies, could offer clues to understand which molecules and genes are involved in the activation or silencing of the immunoglobulin switching mechanism.
One of the regulatory complexes of B-cell maturation and production of immunoglobulin lies in the immunoglobulin Heavy 3′ Enhancer Complex (IgH3′EC) at the 3′ of the Constant α (C-α) genes highly conserved in mammals.8 The enhancer complex consists of three enhancers in humans, whereas in mouse and rat the complex functions like a locus control region (LCR)9 with the enhancer HS3 duplicated in a palindromic form on both sides of the central enhancer HS1,2.10 The regulatory complex is active in the transcription of the heavy constant genes for class switch recombination and in the immunoglobulin transcription.11 Nevertheless the synergic activity of the three or four enhancers is different in the various stages of late B-cell maturation.12 The central human enhancer HS1,2 of the IgH3′EC1 resulted polymorphic for the presence of a minisatellite repeated from one to four times,13,14 and the polymorphism of the HS1,2 at the C-α 3′ of both human loci, has been recently shown by Giambra et al.15
Preliminary evidence in IgA nephritis16 and in coeliac disease17 suggest that some polymorphisms of the HS1,2 enhancer of immunoglobulin heavy chain gene are linked with these illnesses, which suggests that there is a role for these alleles in the predisposition of these diseases. These data prompted us to verify whether the presence of specific alleles could be related to the induction and development of SSc. We addressed this study in a cohort of well characterised patients with SSc. Our data suggest that allele *2 is linked with the disease.
METHODS
Patients
One hundred and sixteen (105 females and 11 males; age: mean ± SD, 54.0 ± 12.2 years) patients with SSc attending the outpatient clinic of the Division of Rheumatology of the Catholic University (Rome, Italy) and II University of Naples were included in the study. The median disease duration was 7 years (range 3.5–13); duration of disease was calculated from the time of onset of the first clinical event (other than Raynaud’s phenomenon) that was a clear manifestation of SSc. All patients fulfilled the criteria proposed by the American College of Rheumatology18 and were grouped according to the classification system proposed by LeRoy et al19 into patients with limited and diffuse skin involvement. All patients’ sera were tested for ANA, ACA, anti-Scl70, anti-RNP and antinucleolus antibodies following standard techniques.
DNA samples collection
Peripheral venous blood from patients and controls was collected in a Vacutainer tube containing 0.129 M sodium citrate (final blood/anticoagulant ratio of 9:1) and stored at –80°C. Genomic DNA was extracted from the blood samples using the salting out method according to previously published methodologies.20 The control sample comprises unrelated, healthy donors of both sexes, who gave their informed consent. Each donor was asked to supply name, birthplace, language and ethnicity for three generations in order to exclude recent admixture. The patients and healthy blood donors were from the same geographical area.
HS1,2 A genotyping
Alleles of the HS1,2A enhancer were determined through two polymerase chain reactions (PCRs); the first on genomic DNA, selective for the IgH3′EC-1 at the 3′ of C-α1 gene and amplified a fragment of 5402 bp, whereas the second was a nested PCR to amplify the fragment among 465–287 bp encompassing the enhancer with the polymorphic part. The first PCR was performed on genomic DNA (≈50 ng) with the primers and conditions described previously,15 PCRs were carried out in a 50-μl reaction volume containing: 2 μl extracted DNA (≈50 ng), 1.5 U Platinum Taq DNA Polymerase High Fidelity (Invitrogen, Carlsbad, California, USA), 15 pmol of each primer, 1.5 mM MgSO4, 50 μM each of dNTP and 1× buffer High Fidelity (600 mM Tris-SO4 pH 8.9, 180 mM [(NH4)2SO4] (Invitrogen), by using GeneAmp PCR System 9700 (Applied Biosystems, Foster City, California, USA). The cycle conditions were: first denaturation step 94°C 2 min, then 94°C 30 s, 61°C 30 s, 68°C 5 min for 10 cycles and 94°C 30 s, 59°C 30 s, 68°C 5 min for 20 cycles, finally 72°C 10 min. Negative and positive controls, without a DNA template or with a control DNA of a heterozygote, were always included. The nested second PCR, to amplify the polymorphic core of the enhancer HS1,2 was performed using the primers described in Giambra et al15 and with 1/25 of the volume of the first PCR, avoiding the carry-over of the genomic DNA of the first reaction; control reactions were performed with 4 and 10 ng total genomic DNA, giving no visible amplification on gel agarose electrophoresis. The second PCR was carried on with the same volumes of the first PCR reaction and the same concentrations, except for the enzyme that was 1 U of Platinum Taq DNA polymerase (Invitrogen). The cycle conditions were changed to 94°C 2 min for a first step, then 94°C 30 s, 56°C 30 s, 68°C 1 min for 30 cycles; after the final extension step 72°C 5 min. PCR products were analysed on 3.0% agarose gel stained with ethidium bromide.
HLA-DQB1 and HLA-DRB1 genotyping
HLA genotyping of patients with SSc was performed with a commercially available kit (Inno-Lipa HLA; Innogenetics, Zwijndrecht, Belgium) following the manufacturer’s protocol as described before. Briefly, exon 2 of the HLA-DQB1 or HLA-DRB1 gene was amplified by PCR using biotin-labelled primers. The labelled PCR products were hybridised to a set of sequence-specific oligonucleotides immobilised in ordered arrays on filter membrane strips, and the sequence-specific PCR products were visualised by colorimetric biotin detection. This principally gives information about the sequence at a distinct position of the exon under investigation. By combining the data from all oligonucleotides on the strip, the genotype of the donor could be defined. HLA-DQB1 and HLA-DRB1 typing was performed in 75 of the 116 patients with SSc.
Organ involvement evaluation
All patients underwent the following.
-
Interstitial lung involvement evaluation: pulmonary function tests to define the diffusion capacity for carbon monoxide (DLCO) and forced vital capacity (FVC) expressed as per cent of predicted values based on age, sex and height21 and lung high resolution computed tomography (HRCT) to evaluate the presence of ground glass opacity and/or reticular pattern/honeycombing (fibrosis).22 Lung involvement was considered absent when DLCO and FVC were ⩾80%23 and HRCT was normal; restrictive lung disease was defined when patients had FVC ⩽79% with normal FEV1/FVC; isolated reduction in DLCO was defined when DLCO was ⩽79% and FVC ⩾80% without fibrotic changes on HRCT.
-
Vascular lung involvement evaluation: echocardiography to define pulmonary artery systolic pressure calculated with the simplified Bernoulli equation.24 Pulmonary arterial hypertension was considered present if pulmonary artery systolic pressure exceeded 35 mmHg23 and defined as isolated if FVC and HRCT were normal and secondary to fibrosis in case of restrictive lung disease or presence of lung fibrosis on HRCT.
-
Heart involvement evaluation: early (E) and late (A) peak mitral inflow velocities ratio (E/A) was measured by echocardiography to define diastolic dysfunction (E/A<1); electrocardiography was performed to evaluate myocardial infarction signs and arrhythmias.
-
Oesophageal involvement evaluation: oesophageal manometry was assessed to define the presence of oesophageal dysmotility.
-
Kidney involvement evaluation: glomerular filtration rate was evaluated using the Cockcroft and Gault formula and defined as mild (89–60 ml/min), moderate (59–30 ml/min) and severe (⩽29 ml/min).25
-
Skin involvement evaluation: patients were grouped based on the presence of skin ulcers and Rodnan’s skin score >14.23
Statistical analysis
Data were analysed using SPSS 13.0 (SPSS. Chicago, Illinois, USA) and Prism software (Graph-Pad, San Diego, California, USA). Categorical and quantitative variables were respectively described as numbers, percentage (%) and mean ± SD or median and IQ range, according to data distribution. The Mann–Whitney U test was used to compare continuous variables. Categorical variables were analysed using a χ2 test or Fisher’s test, depending on sample size restrictions and the odds ratio (OR) with 95% confidence interval (95% CIs) were calculated. Bonferroni correction was performed for multiple comparisons between different autoantibody subsets of SSc (anti-Scl70+ patients versus ACA+ patients, anti-Scl70+ patients versus anti-Scl70- patients, ACA+ patients versus ACA patients; n = 3 comparisons). The equilibrium for the Hardy–Weinberg test was observed in the cohort of patients with SSc. A value of p<0.05 was considered statistically significant.
RESULTS
Characterisation of study participants
The main demographic, clinical and serological features of the 116 patients with SSc studied are shown in table 1. Sex distribution, age and disease duration at the last evaluation were not significantly different between the patients with the lSSc or dSSc phenotype and within the autoantibodies subgroups (data not shown).
Demographic, clinical and immunological characteristics of 116 patients with SSc
HLA-DRB1 and HLA-DQB1 allele frequencies in SSc and association with autoantibodies
As seen in table 2, the frequency of DRB1*11 was higher in our cohort of patients with SSc (43.3%) compared with the frequency among control individuals of the same geographical area as reported previously (27.0%, p = 0.004).26
Frequencies of HLA-DRB1 and HLA-DQB1 alleles in SSc samples, according to the autoantibody pattern
HLA-DQB1*03 was detected in 56.0% of patients with SSc and the frequency was significantly higher compared with healthy individuals (42.1%, p = 0.0003). The distribution of DQB1*05 in anti-Scl70+ patients (11.8%) was lower compared with anti-Scl70− (31.1%, Pcorr = 0.01) and ACA+ (31.3%, Pcorr = 0.03) patients.
Genotype distribution in patients with SSc and in healthy blood donors
The distribution of the investigated genotypes (HS1,2A) and the estimation of allele frequencies in 116 patients with SSc and in 248 healthy blood donors are shown in table 3. Both in the control and SSc group, the observed genotypes are in agreement with those expected under the Hardy–Weinberg equilibrium. The genotype distribution was significantly different between patients with SSc and controls (χ2ν = 1 = 13.0, p = 0.0003). As shown in table 4, the frequency of allele *2 was increased in patients with SSc (57%) as compared with the control group (40%; OR = 1.99, 95% CI: 1.45 to 2.72). Moreover we found a lower representation of alleles *3 (1%) and *4 (3%) in patients with SSc when compared with the controls (6% for allele *3; OR = 0.14, 95% CI: 0.03 to 0.57; 11% for allele *4; OR = 0.31, 95% CI: 0.14 to 0.65), respectively), while allele *1 conserved the same frequency in patients with SSc and controls.
Number of observed genotypes of the HS1,2 enhancer’s polymorphism in control and SSc samples
Frequencies of alleles of the HS1,2 enhancer’s polymorphism in controls and patients with SSc
Genotype distribution for patient’s phenotypes and relation with the autoantibody pattern
As shown in table 3, the HS1,2 polymorphism did not associate with patients’ phenotypes regarding skin involvement (dSSc or lSSc; p = ns). When we analysed the association between genotype distributions of dSSc and lSSc phenotypes, we found an increased frequency of allele *2 both in dSSc (55%, p = 0.005 versus controls) and in lSSc (57%, p<0.0001 versus controls). Crude OR showed that subjects carrying the 2/2 genotype had a significantly higher risk for developing SSc and this genotype associated with the dSSc (OR = 2.85, 95% CI: 1.34 to 6.05) and more with the lSSc phenotype (OR = 3.45, 95% CI: 1.93 to 6.15).
In our cohort of patients, as already reported in the literature,3 SSc disease phenotype associated with the presence of specific autoantibodies. In dividing patients with SSc into two subsets according to skin involvement, we found a clear segregation of ACA with lSSc (98% with lSSc compared with 2% with the dSSc, χ2ν = 1 = 29.99, p<0.0001) and anti-Scl 70 with the dSSc phenotype (59% with dSSc compared with 41% with lSSc form; χ2ν = 1 = 25.90, p<0.0001).
The comparison between subgroups of patients with major immunological findings (anti-Scl70+, ACA+, anti-Scl70−/ACA−) revealed no significant association between different genotypes and autoantibodies presence (table 5). In one patient with SSc, the frequency of the homozygosity for allele *2 was 42% in ACA+ (OR = 4.11, 95% CI: 2.04 to 8.26 versus controls), and 31% in anti-Scl70+ (OR = 2.61, 95% CI: 1.31 to 5.18 versus controls) showing no significant difference for allelic frequencies. This is expected for groups showing equilibrium for the Hardy–Weinberg test but significant differences of allelic frequencies are maintained when the comparison is made with the control group. Moreover there was no difference in HLA-DR and HLA-DQ allele frequencies between patients with SSc with and without allele *2 of the HS1,2A (data not shown). We found that 55.3% of patients carrying the contemporary allele *2 for the HS1,2A and HLA-DR*11 (n = 38) presented autoantibodies anti-Scl70 versus 12.5% of patients without both allele*2 of the HS1,2 A and HLA-DR*11 allele (n = 8; p = 0.048) (data not shown).
Number of observed genotypes of the HS1,2 enhancer’s polymorphism in control and SSc samples, according to the autoantibody pattern
Genotype distribution in SSc and relation with organ involvement
The SSc population was studied for their organ involvement. Forty-four (60.3%) of the 73 patients carrying allele*2 presented gastro-oesophageal involvement versus eight (34.8%) of 23 patients without allele 2 (OR (95%CI): 2.84, 95% CI: 1.07 to 7.56). There was no association between genotype and lung, renal and heart involvement (data not shown).
Immunoglobulin levels
We also tested the influence of the polymorphism in the immunoglobulin enhancer HS1,2 on total serum IgG, IgM and IgA levels. As shown in fig 1, no significant associations were detected between HS1,2 polymorphism and IgG and IgA levels. HS1,2 polymorphism showed a significant association with total serum IgM levels. Patients carrying allele *2 had lower levels of serum IgM (123.0±81.3 mg/dl) than the other group (161.5±68.8 mg/dl; p = 0.01 versus patients with SSc with allele 2).

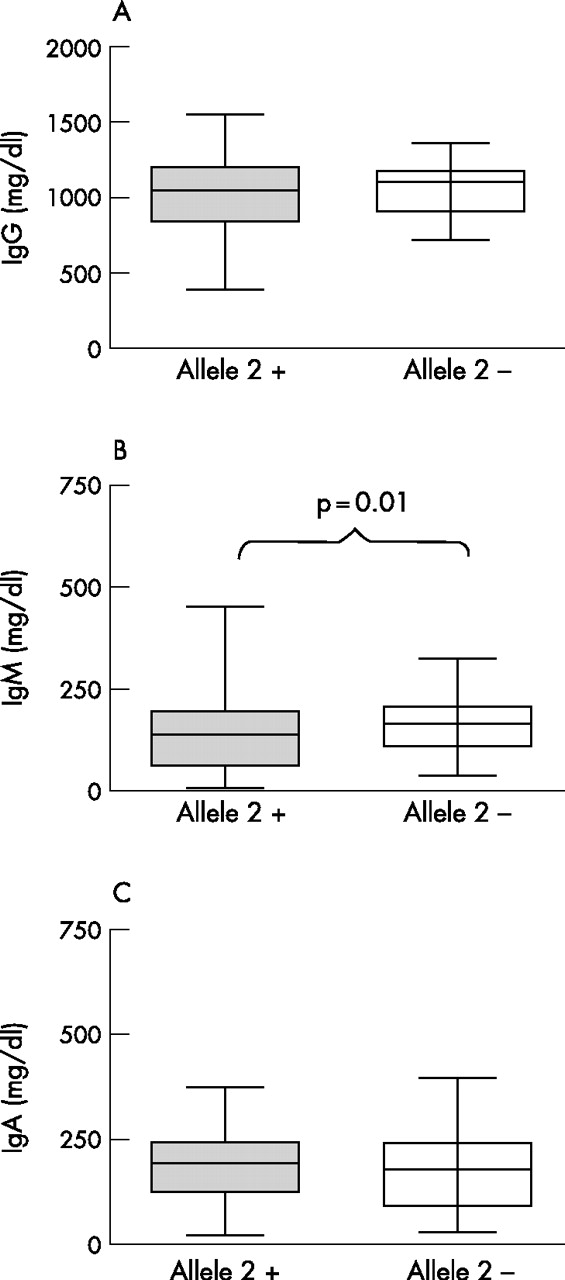
(A) IgG, (B) IgM and (C) IgA serum levels in patients with (grey box) and without (white box) allele*2 in the enhancer HS1,2A. Box plots show the 10th, 25th, 50th (median), 75th and 90th percentiles of a variable.
DISCUSSION
This study supports the hypothesis that inheritance of allele *2 of the enhancer HS1,2A of the IgH3′EC may contribute to the development of SSc disease. We found that allele *2 of the HS1,2A enhancer was significantly more frequent in patients with SSc than in healthy controls. The contribution of the genetic factor to the onset of SSc, offered by the presence of allele *2 is similar when the subsets of patients are considered separately or when the whole cohort is compared with controls. The significance of the variation of the allelic frequencies is high with a probability of 0.001 for a casual correlation when compared with the control group. The validity of the direct comparison of the allelic frequencies with the control group is confirmed by the presence of the Hardy–Weinberg equilibrium in the cohort of patients with SSc. Allele *2 is not associated directly with a variation of immunoglobulin production. Previous studies of HLA alleles in American and European Caucasoids, African-American and Japanese patients with SSc have shown disease associations of SSc with certain HLA class II alleles;27–29 moreover, HLA-DR and DQ allelic correlations have been found in SSc with autoantibodies. As already reported, we confirm the strong correlation between HLA-DRB1*11 and HLA-DQB1*03 with the SSc.26
Recent findings have shed light on the role of B cells in human SSc pointing to the presence of an altered B-cell homeostasis and suggesting that B cells have pathogenic roles other than autoantibody production. Bona et al30,31, studying the tight-skin (TSK) mouse, a genetic model for human SSc characterised by cutaneous fibrosis and autoantibodies against SSc-specific target autoantigens, demonstrated that B cells are critical for the development of skin fibrosis;32 TSK/+ displayed an hyper-responsive phenotype characterised by downregulated surface IgM expression, a consequence of augmented signalling, and upregulated CD23 expression, indicator of B-cell activation, constitutive enhanced surface CD19 expression and hyper-γ-globulinaemia. Moreover, CD19 is expressed in naïve B cells and, to a greater extent, in memory B cells in patients with SSc.33 This overexpression of CD19 may render memory B cells more responsive to transmembrane signals, as CD19 interacts with multiple signalling pathways crucial for modulating intrinsic and antigen receptor-induced signals.34,35
We chose SSc as the prototype autoimmune systemic disease because of the biological background that appeared to involve B-cell interactions in the complex network as described by many studies. We considered SSc an appropriate model to assess whether the polymorphisms of the HS1,2-A enhancer really played a part. Indeed, our data strongly suggest that allele *2 confers a risk to develop SSc. It associates strongly with the subset variants as well as with the specific autoantibody. These data suggest that B cells and the biological milieu (T cells, cytokines, co-stimulatory molecules) could be co-activated with the regulatory regions harbouring the enhancers of the IgH constant gene cluster and lead to the fully manifested phenotype generated accordingly to this genotype. New insight could be given by the analysis of the full pattern of polymorphisms present in the whole 3′RR by determining the more frequent haplotypes in this pathology. In vitro experiments with lymphoblastoid B-cell lines, in the presence of cytokines and co-stimulatory molecules, are in progress to highlight whether we can devise a possible pathway. The full knowledge of the activating complexes specific for the interaction with the polymorphic region of the enhancer could lead to new therapeutic approaches. Until then our data support a role for B cells in SSc.
REFERENCES
Footnotes
-
Published Online First 28 March 2007