Article Text

Abstract
Objective: To assess the changes in inflammatory lesions of the spine and the sacroiliac (SI) joints as detected by magnetic resonance imaging (MRI) in patients with ankylosing spondylitis (AS) and undifferentiated spondyloarthritis (uSpA) with predominant axial symptoms during treatment with etanercept.
Methods: MRI of the spine and/or the SI joints of patients with active AS or axial uSpA was performed at baseline (TP0, n = 25), after 6 weeks (TP1, n = 20), and after 24 weeks of continuous treatment with etanercept (TP2, n = 12). T1 weighted spin echo pre -(T1), post-gadolinium (T1/Gd-DTPA) and short tau inversion recovery (STIR) MRI sequences were used to assess chronic and active spinal lesions using the scoring system ASspiMRI. Active and chronic SI lesions were assessed using a simple scoring system.
Results: By use of the definite STIR sequence, significant regression of spinal inflammation was already seen already after 6 weeks in the patients treated with etanercept (mean (SD) 11.2 (13.8) at TP0 v 6.8 (7.9) at TP1; p = 0.023) but not in patients treated with placebo. Continuous treatment with etanercept for 24 weeks reduced active spinal changes by 69% (p = 0.012). T1/Gd-DTPA sequences gave similar results. There was only a trend for a decrease of active inflammatory lesions of the SI joints.
Conclusions: Etanercept treatment in patients with active AS and uSpA leads to regression of active inflammatory lesions of the spine as depicted by MRI. The potential role of etanercept on deceleration of chronic spinal changes needs further study.
- AS, ankylosing spondylitis
- Gd-DTPA, gadolinium-diethylenetriamine-pentaacetic acid
- MRI, magnetic resonance imaging
- SI, sacroiliac
- SpA, spondyloarthritides
- STIR, short tau inversion recovery
- TNF, tumour necrosis factor
- uSpA, undifferentiated spondyloarthritis
- ankylosing spondylitis
- undifferentiated spondyloarthritis
- etanercept
- magnetic resonance imaging
- ASspiMRI score
Statistics from Altmetric.com
- AS, ankylosing spondylitis
- Gd-DTPA, gadolinium-diethylenetriamine-pentaacetic acid
- MRI, magnetic resonance imaging
- SI, sacroiliac
- SpA, spondyloarthritides
- STIR, short tau inversion recovery
- TNF, tumour necrosis factor
- uSpA, undifferentiated spondyloarthritis
- ankylosing spondylitis
- undifferentiated spondyloarthritis
- etanercept
- magnetic resonance imaging
- ASspiMRI score
The spondyloarthritides (SpA) comprise five subtypes: ankylosing spondylitis (AS), reactive SpA, major parts of the arthritis/spondylitis spectrum associated with psoriasis and inflammatory bowel disease, and undifferentiated spondyloarthritis (uSpA).1 Ankylosing spondylitis (AS), the prototype of the SpA, is a common chronic inflammatory disease. The main clinical symptom is inflammatory back pain, which may result from inflammation of the sacroiliac (SI) joints2–4 and the spine. This may manifest as spondylitis, spondylodiscitis, and/or arthritis of the zygapophysial joints,5 followed frequently by new bone formation. Typical radiographic findings in AS are erosions, sclerosis, syndesmophytes, vertebral fusion, and ankylosis. Patients with SpA and signs and symptoms of AS who have no radiographic sacroiliitis are classified as uSpA with predominant axial symptoms.6 A large proportion of these patients will develop AS over time.7
Anti-tumour necrosis factor (TNF) α agents, such as the recombinant 75 kDa TNF receptor IgG1 fusion protein etanercept (Enbrel), have changed the therapeutic options in AS considerably, by showing strong clinical efficacy in the short term and also in the long term.8,9,10
Conventional radiography reflects the consequences of inflammation, but by itself cannot detect active inflammatory lesions. In contrast, active (acute) inflammatory lesions of the spine and the SI joints are well detected by magnetic resonance imaging (MRI).11 In patients with active AS treated with anti-TNFα, MRI can quantify active spinal inflammatory lesions over short periods of time.12
This study aimed at assessing changes of active inflammatory and chronic lesions primarily in the spine but also in the SI joints as detected by MRI in patients with active AS and uSpA undergoing etanercept treatment.
PATIENTS AND METHODS
Patient characteristics and study protocol
Eighteen patients with active AS and seven with active uSpA who participated in a recent clinical trial with etanercept9,10,13 were investigated by MRI of the spine or the SI joints, or both. The initial trial included 40 patients from two sites (Berlin and Herne, Germany). At baseline, 30 patients with AS were randomly allocated to either etanercept (n = 14) or placebo (n = 16), whereas all 10 patients with uSpA were treated with etanercept. Patients who were included in the Berlin cohort (n = 30) were asked to undergo additional MRI examinations voluntarily. Overall, MRI examinations during the study period were carried out in 25 patients. The 25 patients receiving an MRI examination did not differ from those not examined by MRI (n = 15) in their clinical data at baseline and response to treatment.
The clinical trial was designed as a 6 week placebo controlled, double blind trial followed by open treatment with etanercept (2×25 mg/week subcutaneously) for another 6 weeks in the verum group, and for another 12 weeks in the placebo group, respectively, resulting in an overall period with etanercept of 12 weeks in all patients.9 Thereafter, etanercept was discontinued in all patients for several weeks (observational phase) and then started again for 54 weeks (open label phase of the trial) in all patients.13
Magnetic resonance imaging (MRI)
MRI was executed with a 1.5 T Magnetom vision (Siemens, Germany), using a spine coil and/or a body array coil. To investigate SI and spinal inflammation, MRI was performed as described earlier.14 Sagittal views of the spine and semicoronal views of the SI joints were obtained by using the following sequences:
-
T1 weighted spin echo sequences (repetition time/echo time 500/14–20 ms, slice thickness 3–4 mm, two acquisitions) before, and
-
Using the same sequence with fat saturation after application of gadolinium-diethylenetriamine-pentaacetic acid (T1/Gd-DTPA). Evaluation of the spine was performed in two parts, taking C2 and L5 as orientation points, always starting with the upper part.
-
Similarly, fat saturated short tau inversion recovery (STIR) sequences (repetition time/inversion time/echo time 4000/150/60 ms, slice thickness 3–4 mm, one acquisition) were performed. Subtraction images were electronically generated as a routine procedure.
MRI examinations were performed at three time points: at baseline of the initial placebo controlled phase of the trial (TP0), after 6 weeks of treatment with etanercept or placebo (TP1 = end of the placebo controlled phase), and after 24 weeks of continuous treatment with etanercept (TP2 = open label extension after discontinuation and re-treatment). Overall, at TP0 MRI was available in 20 patients (12 patients assigned to etanercept and eight to placebo), at TP1 in 22 patients (13 patients in the etanercept group, nine in the placebo group), and at TP2 in 12 patients. Because for various reasons not all patients had complete series of MRI investigations, comparisons between TP0 and TP1 were possible in 20 patients, between TP0 and TP2 in 10 patients, and between TP1 and TP2 in 12 patients. Therefore, the mean values of the scores assessed at the different time points depend on whether pairs of patients were available for evaluation. Thus, such scores may differ from the mean score of the total patient population.
Scoring systems applied in MRI readings
Spine
For the assessment of spinal lesions, vertebral units were evaluated. These are defined as the region between two virtual horizontal lines drawn through the middle of a vertebral body.12 Active (acute) inflammatory lesions of the spine were assessed by evaluation of T1/Gd-DTPA and STIR MRI by use of the recently evaluated “activity” version of the AS spine MRI scoring system (ASspiMRI-a).12 Chronic inflammatory lesions of the spine were evaluated using the “chronicity” version of the scoring system (ASspiMRI-c).12
Evaluation of the spinal MR images was performed by two readers (MR, XB). The mean scores of both readers for each region and at each time point were used for analysis. Both readers were unaware of the allocation of patients to the placebo or the verum group.
Sacroiliac joints
MRI examinations of the SI joints were performed in 21 patients (13 etanercept, eight placebo) at TP0, in 20 patients (14 etanercept, six placebo) at TP1, and in 15 patients (all etanercept) at TP2. Active inflammatory lesions of the SI joints were graded in the STIR technique by using a simple scoring system with a range of 0–3 for no inflammatory lesions (grade 0), little (<25% of the bone surface, grade 1), moderate (25–50% of the bone surface, grade 2), and severe (>50% of the bone surface, grade 3) inflammatory lesions. The iliac and sacral parts of each SI joint were assessed separately, resulting in a maximal score of 12.
Scoring of chronic changes of the SI joints was performed on the basis of the modified New York criteria15 but by scoring each SI joint separately, resulting in a chronicity score of 0–8. Scoring of SI joints (active and chronic changes) was only performed by one reader (MR), who was unaware of the treatment allocation (TP0 and TP1).
Statistical analysis
Non-parametric tests were used: Wilcoxon’s signed rank test for paired samples to assess differences of MRI scores between two time points, Wilcoxon’s rank sum test to compare mean/median values between groups, and Spearman’s test (rs) to calculate correlations of variables such as the different MRI techniques. Exact p values (two sided) were calculated.
RESULTS
Performance of STIR and T1/Gd-DTPA sequences in the detection of active inflammatory spinal lesions
There was a good to very good correlation between the STIR sequence and the T1/Gd-DTPA sequence in the detection of active inflammatory lesions of the spine, with rs = 0.84, rs = 0.58, and rs = 0.88 at TP0, TP1, and TP2, respectively (all p⩽0.005). For the change scores, significant correlations were seen between TP0 and TP2, with rs = 0.78 (p<0.01).
Mean scores were 10.9 (12.0) v 6.7 (6.7) at TP0, 7.6 (8.4) v 4.7 (6.6) at TP1, and 5.0 (6.7) v 4.5 (7.0) at TP2 for the STIR and the T1/Gd-DTPA sequences, respectively. There was no difference in the change between patients with AS and those with uSpA.
Similarly, good correlations of STIR and T1/Gd-DTPA were found when the three spinal segments were analysed separately (data not shown). Most active inflammatory lesions (STIR) at TP0 were found in the thoracic spine: 6.4 (7.9), followed by the lumbar spine: 2.4 (3.4) and the cervical spine: 2.3 (4.3). These data were similar for the T1/Gd-DTPA sequences (not shown). Overall, 4/5 patients with uSpA showed spinal inflammation at TP0 in both the STIR and the T1/Gd-DTPA technique, and this was the case in 14/15 patients with AS for the STIR and for the T1/Gd-DTPA technique.
Changes of active inflammatory lesions of the spine after 6 weeks of treatment
The mean ASspiMRI-a score for all patients (n = 20) was 11.5 (12.3) at TP0. In the STIR sequence, 18/20 (90%) of the patients showed active inflammatory lesions of the spine at baseline (ASspiMRI-a score ⩾1), and 15/20 (75%) showed active inflammatory lesions in combination with at least one erosion (ASspiMRI-a score ⩾4). There was no difference in the mean (SD) ASspiMRI-a scores between patients (n = 8) in the placebo group compared with patients (n = 12) in the etanercept group (10.4 (9.8) v 11.2 (13.8) at baseline; p = 0.7). The demographic and clinical parameters at baseline were similar in the two groups, except that patients in the placebo group were older than patients in the etanercept group (table 1).
Demographic data of the 20 patients with AS at baseline
In the evaluation of the STIR technique, patients treated with etanercept (n = 12) improved from a mean ASspiMRI-a of 11.2 (13.8) at TP0 to 6.8 (7.9) after 6 weeks of treatment (p = 0.023, fig 1). The mean change in the patients treated with placebo (n = 8) was not significant (10.4 (9.8) at TP0 to 9.8 (9.7) at TP1) (fig 1). Similarly, in the evaluation of the T1/Gd-DTPA MRI sequence, the mean ASspiMRI-a score in the etanercept group decreased from 6.8 (8.1) at TP0 to 4.0 (6.5) at TP1 (p = 0.016, figs 1 and 2), whereas the change in the placebo group was not significant (fig 1). Between-group comparisons showed significant differences for the changes of inflammatory spinal lesions during the placebo controlled phase of the study only for the T1/Gd-DTPA sequence (p = 0.02), but not for STIR (p = 0.21). There was no difference between patients with AS and those with uSpA in the changes between TP0 and TP1.

Mean improvement of active spinal lesions as assessed by MRI using the STIR and T1/Gd-DTPA technique and quantified by the ASspiMRI-a score at baseline and after 6 weeks of etanercept or placebo treatment, respectively. Significant differences were found for the patients treated with etanercept (in the STIR sequence and in the T1/Gd-DTPA sequence) but not for patients treated with placebo.
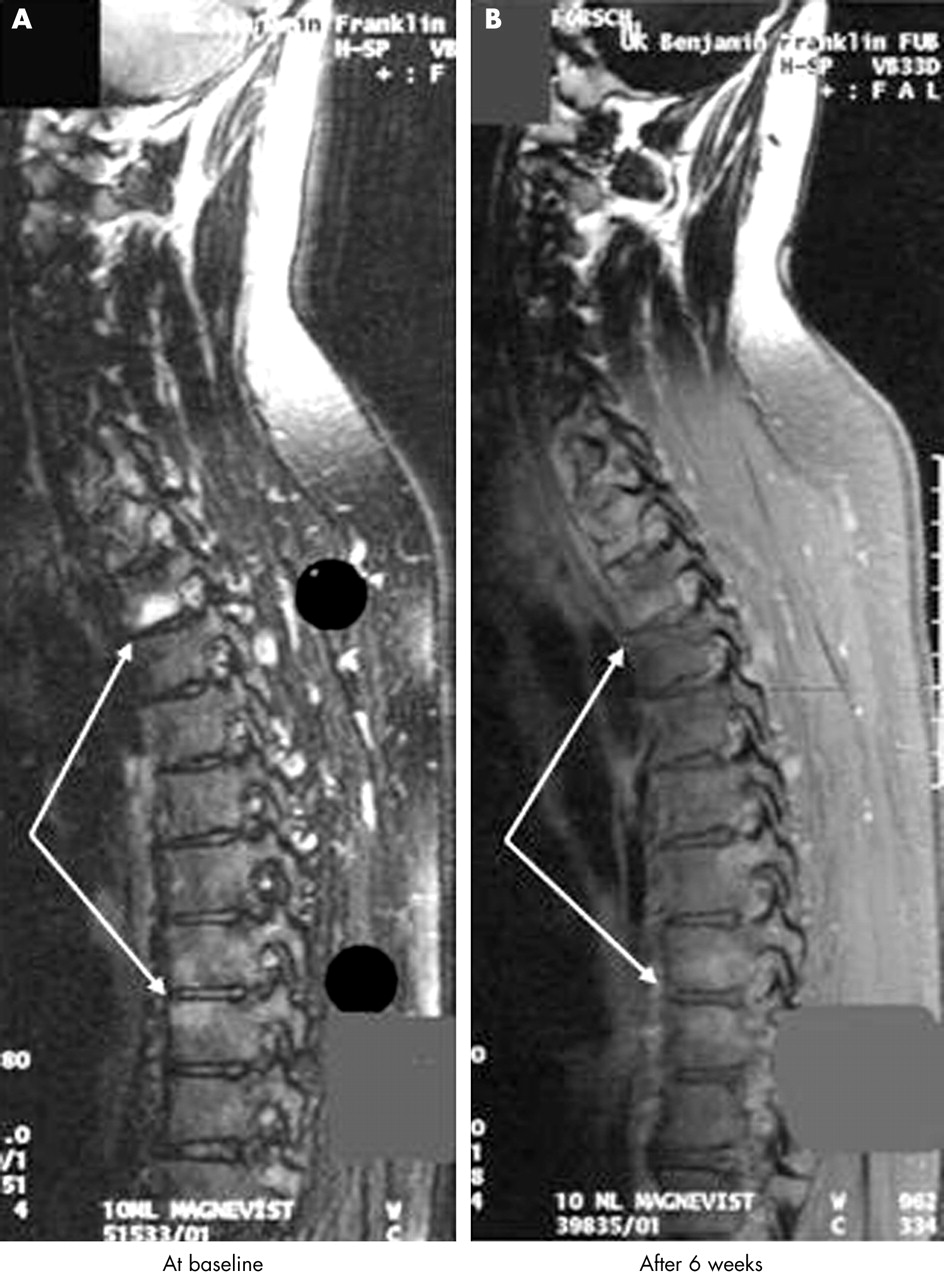
Improvement of inflammatory spinal lesions in a patient with AS before and after application of T1/Gd-DTPA. The hyperintensity of the signal in the vertebra is no longer detectable after 6 weeks of treatment with etanercept.
This means a reduction of active inflammatory changes of 39.3% when using the STIR technique and of 41.2% when using the T1/Gd-DTPA technique after 6 weeks of etanercept treatment.
Changes of active inflammatory lesions of the spine after 24 weeks
For the evaluation of changes of active spinal lesions between TP0 and TP2, MRI scans of 10 patients, and for the evaluation between TP1 and TP2, MRI scans of 12 patients were available. The mean ASspiMRI-a decreased from 16.4 (14.5) at TP0 to 5.0 (6.7) after 24 weeks of continuous treatment with etanercept, when STIR sequences were evaluated (p = 0.012) (fig 3). The analysis of T1/Gd-DTPA sequence scores showed a similar improvement of active spinal lesions: the mean ASspiMRI-a was 10.3 (9.7) at TP0, 6.4 (8.4) at TP1, and 4.5 (7.1) at TP2 (p = 0.027 for TP0 v TP2).

Active inflammatory lesions of the spine (n = 12) as assessed by MRI using the STIR sequence and as quantified by the ASspiMRI-a at baseline (TP0), after 6 weeks (TP1), and after 24 weeks of treatment (TP2). *p = 0.001 refers to the comparison between TP0 and TP2.
By using the STIR technique to assess spinal inflammation, a 69.5% reduction and by using the T1/Gd-DTPA technique, a 56.3% reduction of active inflammatory changes was seen after 24 weeks of treatment with etanercept.
Evaluation of chronic spinal changes
The mean ASspiMRI-c for chronic spinal lesions did not differ between the placebo group and the etanercept group at TP0: 18.8 (10.6) v 19.7 (13.8) (p = 0.9). In the 12 patients with MRI scans available after 24 weeks of treatment with etanercept there was no significant change of chronic spinal changes: 20.6 (12.6) at TP0 v 23.7 (9.2) at TP2 after 24 weeks (p = 0.58).
Evaluation of active and chronic lesions in the SI joints
Active inflammatory lesions, defined as a score ⩾1, were detected in 18/21 patients at TP0 who had MRI scans of the SI joints available. The mean score for active inflammatory lesions was 3.0 (2.2) at TP0 for all patients. There was no difference between the patients in the placebo group (n = 8) and the etanercept group (n = 13): 3.3 (2.1) v 2.8 (2.0); p = 0.6. At TP1, the placebo group (n = 6) had a mean score of 2.2 (1.3) (p = 0.25 for TP0 v TP1), whereas the etanercept group (n = 13) had a mean score of 2.6 (1.5) (p = NS for TP0 v TP1). The changes found in the etanercept group were not significantly different from those in the placebo group. Thus, using this scoring system for the SI joints, there was no significant change after 6 weeks of treatment.
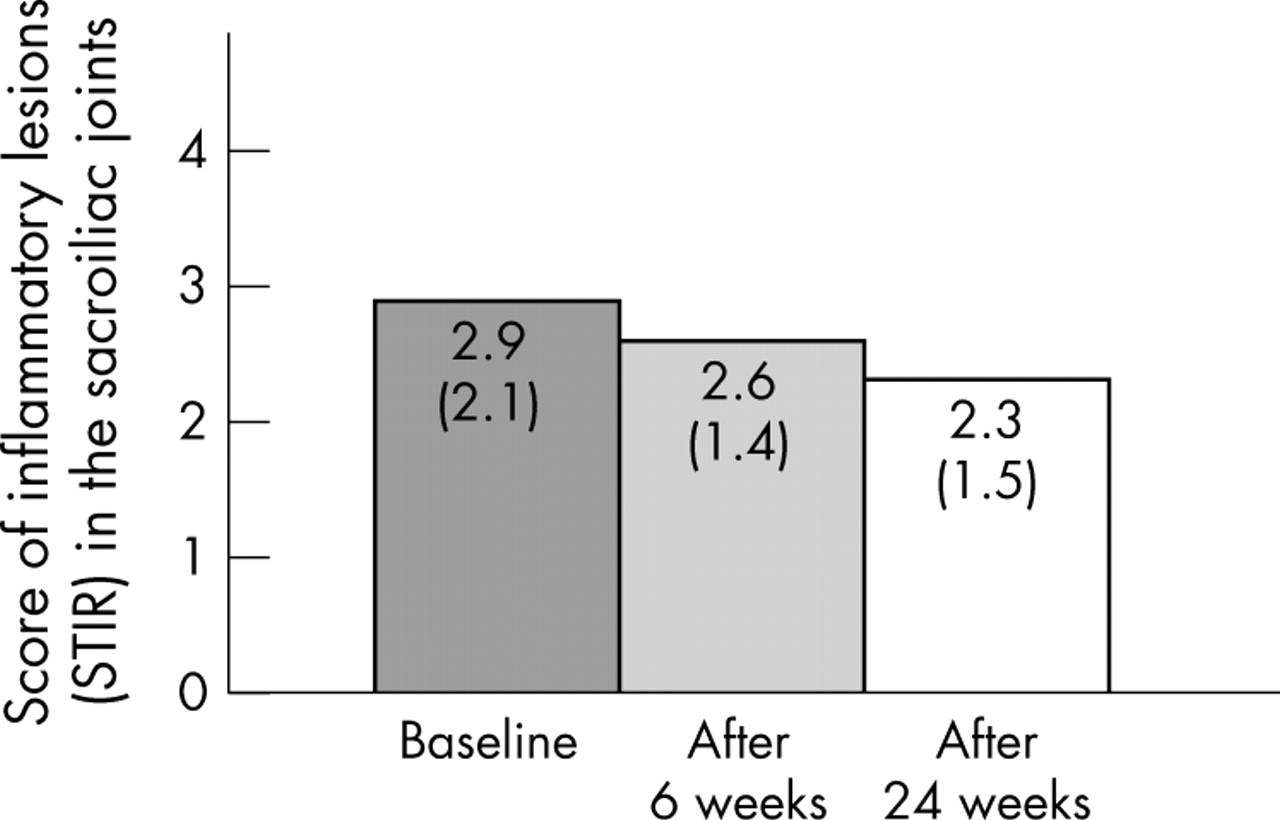
Furthermore, after 24 weeks of continuous treatment of 15 patients with AS with etanercept there was a slight but not significant decrease of the mean score for active inflammatory lesions in the SI joints (p = 0.12) (figs 4 and 5).

Active inflammatory lesions of the SI joints (n = 15) as assessed by MRI using the STIR sequence and a simple score at baseline (TP0), after 6 weeks of treatment (TP1), and after 24 weeks of treatment (TP2).

An example of a patient with significant improvement of active inflammatory lesions of the SI joints over the treatment period. Improvement was already seen after 6 weeks of treatment.
At the patient level, there was a decrease in the score of >1 scoring point in six patients between TP0 and TP2, whereas no change was found in seven patients and a worsening of at least one scoring point in two patients.
No difference in chronic changes was found among the 15 patients with AS between TP0 and TP2 after 24 weeks of continuous treatment with etanercept: 5.6 (1.5) v 5.8 (1.6) (p = 0.1).
DISCUSSION
This study shows that treatment of patients with active AS and active uSpA with etanercept is associated with a significant reduction of active inflammatory changes of the spine as depicted by MRI. Thus, etanercept not only leads to a considerable improvement of the clinical signs and symptoms in patients with active AS9,13 and uSpA10 but also decreases the extent of spinal inflammation as quantified by the recently evaluated scoring system, the ASspiMRI-a.12,16 The data presented here support the usefulness of this tool to document change of spinal inflammation in clinical studies. Another scoring system based on entheseal changes, which was used in an earlier study on etanercept in 10 patients with SpA, basically came to similar conclusions.17 Whether the regression of active inflammatory lesions will be associated with a deceleration of new bone formation or even halt its progression is unclear at present. Similarly, the question of whether bone formation and ankylosis, which may contribute substantially to the burden of disease in patients with AS,18 are the result of continuing inflammation is still unanswered. During the study, no progression occurred of chronic changes of the spine as depicted by MRI using the recently evaluated scoring system, the ASspiMRI-c.12,19 However, larger and longer follow up studies with appropriate control groups not treated with anti-TNF agents are needed to demonstrate any effect of etanercept on chronic lesions.
This is not the first study to examine patients with predominant axial symptoms classified as uSpA; the findings of the first report20 were similar to the findings in this study: Spondylitis at the level of the lower lumbar spine occasionally occurs in patients with uSpA with no major SI changes.20 It may be important to detect such patients early because, possibly, they may be more likely to develop a more severe and progressive course of AS in a short period of time.
Interestingly, a significant regression of active inflammatory lesions was already seen after 6 weeks of etanercept treatment as compared with placebo. This is the first report on improvement of spinal inflammation after such a short period of time. In other studies MRI examinations were performed after 12 weeks.12,21 The remarkably rapid improvement seen by MRI agrees with the suggestion that clinical improvement already occurs after only 2 weeks of treatment with etanercept.9 These data do not suggest that etanercept has an earlier effect than other anti-TNF agents, it just indicates that there are no such data available for other compounds.
A further reduction of active inflammatory spinal lesions was seen after continuous treatment with etanercept for 24 weeks. This indicates that longer periods of treatment are needed to see further effects of anti-TNF treatment on spinal inflammation as detected by MRI. Whether regression of inflammatory spinal lesions of more than 70% beyond 24 weeks of treatment with etanercept is to be expected cannot be answered by our study, but there is some evidence for lasting efficacy from a 1 year follow up.21 That study21 on another cohort of patients with AS using somewhat different MRI techniques was carried out in parallel with the one reported here and obtained very similar results. Taken together, the results of both trials strongly confirm the efficacy of etanercept on spinal lesions in AS.
As reported in a previous study,21 the STIR technique, which visualises oedema and hypervascularisation, was more sensitive for the detection of active inflammatory lesions than the T1/Gd-DTPA technique, which visualises inflammation by use of contrast agents that enhance areas of inflammation. Using the same two MRI techniques (STIR and T1/Gd-DTPA MRI sequences) as in the present study, we found that the STIR sequence always gave higher scores (higher sensitivity) than the T1/Gd-DTPA sequence. Similar results have been reported in another study.22 The magnitude of improvement of active lesions was similarly demonstrated by either technique (STIR or T1/Gd-DTPA), indicating a similar sensitivity to change. The finding that in the between-group comparison only the T1/Gd-DTPA showed a significant difference is likely to be explained by the sample size (type II error).
Scoring of active inflammatory lesions of the SI joints showed only moderate and non-significant regression of such lesions upon treatment with etanercept. In some patients without change according to the scoring method used, the reader noted some decrease of active inflammatory lesions after 24 weeks. Thus, one possible explanation is that the scoring method applied for the SI joints is not sufficiently sensitive to change. Whether semiaxial planes23 in addition to the conventional semicoronal planes of the SI joints would have added further information on the change in the SI joints is unknown, but unlikely. Further studies on MRI examination of the SI joints, such as those continuing under the auspices of OMERACT,24 will provide more information on this issue.
The chronicity score changed little for either the spine or the SI joints, suggesting that chronic changes did not progress in the rather short time period of the follow up. More changes may be detected in longer follow up studies. The sensitivity to change of the scoring system used12 has not been established to date.
In summary, etanercept has strong clinical efficacy on many aspects of active AS and leads to significant regression of active inflammatory lesions in the spine. MRI is a powerful tool for visualising and monitoring active spinal inflammation in patients with active AS and uSpA. It was confirmed that the ASspiMRI-a score can quantify active spinal lesions and is sensitive to change. Some effects on the SI joints were also detected, but this was not statistically significant, possibly indicating that the scoring method used lacks sensitivity to change.
Acknowledgments
This study was supported in part by an unrestricted grant from Wyeth, USA
REFERENCES
Supplementary materials
There is an error in the legend of figure 2 of this article. The legend should read:
Improvement of inflammatory spinal lesions in a patient with ankylosing spondylitis in the T1/Gd-DTPA MRI sequence before (A) and after (B) treatment with etanercept. The hyperintensity of the signal in the vertebra is no more detectable after 6 weeks of therapy with etanercept.
Footnotes
-
↵* The first two authors contributed equally to this paper.
-
Published Online First 18 March 2005
Linked Articles
- Correction