Article Text

Abstract
Objective Knee osteoarthritis commonly requires joint replacement, substantially reduces quality of life and increases healthcare utilisation and costs. This study aimed to identify whether quantitative measures of articular cartilage structure predict knee replacement, and to establish their utility as outcomes in clinical trials of disease-modifying therapy.
Methods A nested case–control study was performed in Osteoarthritis Initiative participants, a multicentre observational cohort of 4796 participants with or at risk of knee osteoarthritis. 127 knees were replaced between baseline and 4 years follow-up, and one control knee per case matched for baseline radiographic disease stage (Kellgren–Lawrence grade; KLG), gender and age. Quantitative cartilage measures were obtained from 3 T magnetic resonance images at the exam before knee replacement, and longitudinal change during the previous 12 months when available (n=110).
Results Cartilage thickness loss in the central and total medial femorotibial compartment (primary and secondary predictor variables) was significantly greater in case than control knees (AUC=0.59/0.58). Differences in cartilage loss were greater at earlier than later radiographic disease stages (p<0.01 for interaction with KLG). Cartilage thickness loss in the central tibia was the most predictive longitudinal measure (AUC=0.64). Denuded bone areas in the medial femur were the most predictive and discriminatory cross-sectional measure between case and control knees (AUC=0.66).
Conclusions This study demonstrates the predictive value of quantitative, MRI-based measures of cartilage for the clinically relevant endpoint of knee replacement, providing support for their utility in clinical trials to evaluate the effectiveness of structure-modifying intervention.
Statistics from Altmetric.com
Introduction
Knee osteoarthritis affects over 10% of the population,1 causes annual expenditures of US$185.5 billion in the USA,2 causes functional limitations to a similar extent as cardiovascular disease,3 reduces the quality of life4 and substantially increases healthcare utilisation.5 A major contributor to the costs is that of knee joint replacements (KR), of which 615 000 were performed in the USA in 2008 (http://www.hcupus.ahrq.gov/db/nation/nis/NIS_Introduction_2008.jsp).
Current treatment for osteoarthritis is mainly focused on controlling symptoms and replacing damaged joints. In the absence of approved disease-modifying therapy,6 ,7 KR are projected to increase to over 3 million annually in the USA by 2030.8 Current regulatory guidance for the approval of disease-modifying therapy recommends that therapy should also involve benefits in clinical outcomes.9 KR appears appropriate as a clinical outcome in this context, as it reflects the end stage of the disease that is generally associated with severe pain, functional limitation, reduction in quality of life and relevant healthcare expenditure.
MRI directly visualises synovial tissues and can provide quantitative measures of articular cartilage (qMRI), such as thickness, volume and denuded bone area.10–12 These qMRI measures have been validated versus external reference standards,13 but only few studies to date have evaluated imaging markers as predictors of clinical outcomes14 ,15 and specifically KR.16 ,17
There is no clear consensus on medical indications for KR. Identifying cut points for pain and functional disability that are indications for KR has proved challenging.18 ,19 Which patients actually receive a KR among those who are medially indicated also depends on other factors, such as patient willingness, comorbidity, socioeconomic status and others. However, the need for KR represents an important clinical outcome for knee osteoarthritis, with a substantial socioeconomic impact, against which the potential value of a structural therapeutic intervention will have to be evaluated. qMRI biomarkers capable of predicting KR may serve as promising prognostic markers for the efficacy of intervention,20 and may eventually replace the current reference standard of radiographic joint space width (JSW) for disease modification trials.9
The purpose of this study therefore was to test the hypothesis that longitudinal qMRI measures of cartilage loss predict osteoarthritic knees undergoing KR compared with control knees (with the same radiographic disease stage) that do not undergo KR. Furthermore, we explored whether cross-sectionally measured qMRI parameters of cartilage status are predictive of future KR. Whereas the first analysis looks at the ability of ‘change’ between cartilage measures to predict KR, the latter looks at the ability of a single measurement to predict KR.
Methods
The osteoarthritis initiative
This study is ancillary to the Osteoarthritis Initiative multi-centre longitudinal cohort study (OAI) (http://www.oai.ucsf.edu/), an ongoing multi-centre longitudinal cohort study designed to identify imaging, biochemical and genetic biomarkers of the onset and/or progression of knee osteoarthritis. Both knees of 4796 participants were studied annually using 3T MRI21 and fixed flexion radiography,22 ,23 between baseline, 1, 2, 3 and 4 years follow-up. OAI participants were 45–79 years old, with or at risk of symptomatic knee osteoarthritis in at least one knee. Patients were recruited at four clinical sites (http://www.oai.ucsf.edu/), the University of Maryland School of Medicine and the Johns Hopkins University (Baltimore), the Ohio State University (Columbus), the University of Pittsburgh and the Memorial Hospital of Rhode Island (Pawtucket). The study was approved by the institutional review boards at each of the sites, and all participants gave informed consent.
Case and control knee selection
OAI participants were examined and interviewed annually and asked about KR in the preceding interval. To be eligible as a case or control, a knee had to have a central reading of Kellgren–Lawrence grade (KLG) from baseline fixed flexion knee radiographs,22 ,23 so that cases and controls could be matched based on radiographic disease status (see below). Furthermore, cases had to have MRI acquisitions acceptable for quantitative analysis at the examination time point before KR (T0). The MRI acquisition 12 months before T0 was termed T−1. Cases were selected from those with a KR reported between baseline and the 4 year follow-up visit, confirmed by radiography and/or hospital records.
Control knees were selected from those with no self-reported KR, no evidence of KR on knee radiographs between baseline and 4-year follow-up, and MRI available at corresponding time points (T0/T−1). These were matched 1:1 to case knees for gender, age within 5 years, and baseline KLG (KLG 0–1, 2, 3, 4). In control knees without qMRI analysis at 3-year follow-up, 2-year follow-up was used as T0 and 1-year as T−1. Knees replaced between baseline and 1-year follow-up were only included in the cross-sectional analysis (T0).
Quantitative MRI analysis
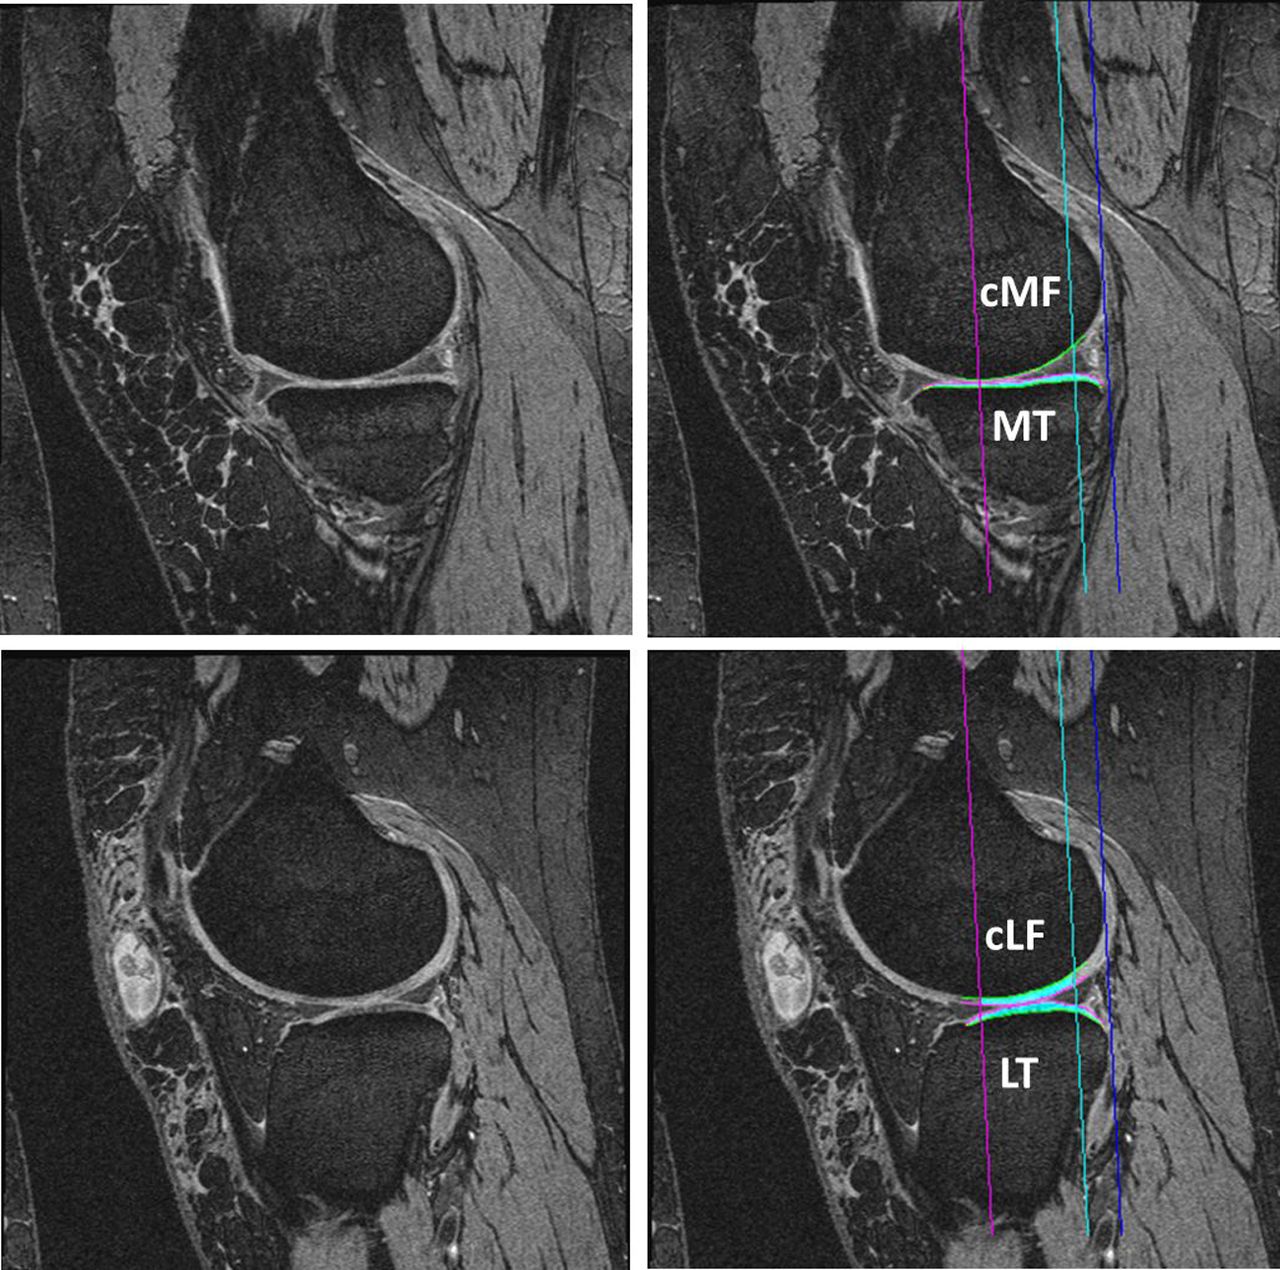
The image analysis of this study relied on the oblique sagittal double-echo steady-state water excitation sequence.21 24 25 Segmentation of the femorotibial cartilages was performed at the image analysis centre (Chondrometrics GmbH, Ainring, Germany) by 12 operators with formal training in cartilage segmentation, who were blinded to the time points of the image acquisitions. The total area of subchondral bone (tAB) and the cartilage surface area were segmented manually, excluding osteophytes and osteophyte cartilage. Segmentation was performed in the medial and lateral tibia, and in the weight-bearing (central) medial (cMF) and lateral femoral condyle (cLF).25 ,26 All segmentations were quality controlled by one of two experts. In one participant, segmentation could only be completed in the medial compartment because of an imaging artefact laterally.
qMRI measures of the cartilage were derived after three-dimensional surface reconstruction, using Chondrometrics software:27 specifically mean cartilage thickness over the total area of subchondral bone ThCtAB.Me, percentage denuded subchondral bone area dAB%, and the total subchondral bone area tAB,28 because these measures have been shown to provide independent and comprehensive information on cartilage change and status in healthy and in osteoarthritic knees.29 Cartilage thickness in the medial femorotibial compartment (MFTC) was determined as:
ThCtAB.Me was also determined in five tibial and three femoral anatomical subregions (figure 1) and in a combined central tibial and femoral subregion:27

Visual display of the femorotibial subregions and the predictive validity of longitudinal quantitative MRI measures of articular cartilage in context of knee replacement (KR). Posterior view of the femorotibial compartment of the knee (middle), inferior view of the weight-bearing femur (top), and superior view of the tibia (bottom). The values given are case–control adjusted areas under the receiver operating characteristic curves (ccAUC) for longitudinal change in cartilage thickness in regions where significant differences were observed between KR and control knees (Wilcoxon signed rank test); AUC adjusted for body mass index and pain status (aAUC) are given in brackets/italics: c, central subregions (red); cLFTC, central subregions of the lateral femorotibial compartment; cMF/cLF, weight-bearing medial/lateral femur; cMFTC, central aspect of the medial femorotibial compartment (primary endpoint); e, external subregions (green); I, internal subregions (blue); posterior subregions, yellow; anterior subegions, turquoise; LFTC, total lateral femorotibial compartment; MFTC, total medial femorotibial compartment (secondary endpoint); MT/LT, medial/lateral tibia. This figure is only reproduced in colour in the online version.
The same measures were obtained in the lateral compartment (total lateral femorotibial compartment (LFTC) and central subregions of the lateral femorotibial compartment (cLFTC)). In addition, cartilage volume (VC) of the femorotibial cartilage plates was determined to permit comparison with previous literature. The test–retest precision and sensitivity to change for the above measures have been reported previously.10 ,24 ,27 ,30–32
Statistical analysis
All tests were performed using SAS software (V.9.2).
Based on the sensitivity to change in knee osteoarthritis,25 ,31–34 longitudinal cartilage thickness change (ThCtAB) in the central medial femorotibial compartment (cMFTC; figure 1) was selected as the primary, and change in the total MFTC as the secondary predictor variable. Other regions of interest, qMRI measures and the cross-sectional comparisons were considered exploratory; no adjustment for multiple comparisons was therefore made.
As most qMRI parameters were not normally distributed, longitudinal and cross-sectional differences between case–control pairs were tested using the Wilcoxon signed-rank test. To confirm whether the results of the crude comparisons were robust, adjustment was added for baseline body mass index (BMI) (43) (normal/overweight/obese) and pain frequency status35 ,36 (no pain/any pain in the past year/pain on most days during any month in the past 12 months, at T−1 for longitudinal and T0 for cross-sectional analyses). For qMRI measures found significantly different between cases and controls, discrimination ability was determined using areas (AUC) under the receiver operation characteristic curve. Because crude AUC are biased towards the null in matched studies,37 case–control AUC37 (ccAUC) and their 95% CI were computed by weighting non-parametric AUC for sex-KLG categories combined with semiparametric quantile regression for age, and then by adjusting also for the BMI and pain status (aAUC). To test whether differences in the primary and secondary predictor variables between case and control knees differed between KLG strata, an analysis of variance was applied. Finally, possible bias from including bilateral (correlated) knees in the analyses were determined as negligible by a sensitivity analysis using adjusted paired t tests and linear mixed models. In particular, none of the longitudinal changes from T−1 to T0 (the primary predictor variables) were correlated between bilateral KR knees.
Results
Sample description
One hundred and ninety-one knees of 165 OAI participants had a confirmed KR between baseline and 4-year follow-up: Of these, 30 were excluded, because they did not have a central x-ray reading at the time of analysis, and four because no matched control (with central x-ray reading) was available. Of the remaining 157 knees, 30 did not have an MRI at the visit before KR, T0 (n=28) or inferior image quality (n=2); 17 knees had a KR between baseline and 1-year follow-up. Therefore, 110 knees from 97 participants were available for the longitudinal analysis (time between T0 and KR 171±107 days; mean±SD), and 127 knees (from 113 participants) were available for the cross-sectional analysis (time between T0 and KR 175±106 days). Demographic and clinical information on both samples are given in table 1.
Demographic information on subjects with knees undergoing KR and control knees not undergoing KR in the sample studied longitudinally (LO sample; n=110) and cross-sectionally (CS sample; n=127)
Longitudinal comparisons
The longitudinal change in cMFTC cartilage thickness between T−1 and T0 (primary predictor variable) was significantly (p=0.006) greater in KR cases (median −0.115 mm; 25%/75% IQR −0.380 mm/+0.010 mm) than in controls (median −0.060 mm; IQR −0.190 mm/+0.070 mm); ccAUC=0.59; 95% CI 0.52 to 0.67; table 2, figures 1 and 2). The difference remained significant (p=0.002) and the prediction became slightly greater (aAUC=0.64; 95% CI 0.57 to 0.71) when adjusting for BMI and pain status. Longitudinal differences between case and control knees differed by KLG strata (p=0.002); KLG 2 cases displayed substantially greater changes in cartilage thickness (median −0.145 mm; IQR −0.815/+0.045) than KLG 2 controls (+0.035 mm; IQR −0.130/+0.110; figure 3). KLG 3 cases (median −0.170 mm; IQR −0.410/+0.010) also showed greater change than KLG 3 controls (−0.120 mm; IQR −0.360/+0.040); in contrast, KLG 4 cases displayed relatively small changes (median −0.080 mm; IQR −0.200/+0.020) that were similar to those in KLG 4 controls (−0.085 mm; IQR −0.160/+0.030; figure 3).
Longitudinal change between T−1 and T0 in quantitative parameters of femorotibial cartilage structure in knees undergoing KR (KR cases; n=110) versus control knees (n=110)

Receiver operating characteristic curve for cartilage thickness (change) in the central aspect of the medial femorotibial compartment (primary endpoint). (A) Longitudinal discrimimination between knee replacement cases and controls between T−1 and T0. (B) Cross-sectional discrimimination between knee replacement cases and controls at T0. cLFTC, central subregions of the lateral femorotibial compartment; cMF/cLF, weight-bearing medial/lateral femur; cMFTC, central aspect of the medial femorotibial compartment (primary endpoint); cMT/cLT, central medial tibia/central lateral tibia; LFTC, total lateral femorotibial compartment; MFTC, total medial femorotibial compartment (secondary endpoint); MT/LT, medial/lateral tibia. This figure is only reproduced in colour in the online version.

Mean change in cartilage thickness in the central medial femorotibial compartment in knees with knee replacement (KR) compared with matched control knees of the same radiographic disease stage (Kellgren Lawrence grade; KLG), gender and age. All participants (n=110/110 cases and controls), KLG 2 stratum (n=20/20), KLG 3 stratum (n=39/39), KLG 4 stratum (n=46/46). SD are not shown; medians and IQR are given in the text.
The reduction in total MFTC cartilage thickness (secondary predictor variable) was also significantly (p=0.016) greater in cases (median −0.085 mm; IQR −0.220/+0.020) than in controls (−0.045 mm; IQR −0.150/+0.030; ccAUC=0.58; 95% CI 0.50 to 0.65; table 2). Again, the results remained significant (p=0.006) and the discrimination became slightly greater (aAUC=0.63; 95% CI 0.56 to 0.70) after adjusting for BMI and pain status. Similar differences between KLG strata were observed as for the primary outcome (p=0.004).
Significant differences of cartilage thickness changes were also observed in the central lateral tibia, the internal aspect of the medial femoral condyle, the (total) medial tibia and the central medial tibia (see supplementary table S1 (available online only); figure 1). The central medial tibia was the most predictive subregion (ccAUC=0.64; 95% CI 0.56 to 0.71; aAUC=0.66; 95% CI 0.59 to 0.73). Significant differences were also observed in changes of denuded areas in the MFTC, but not in those of VC (table 2).
Cross-sectional comparisons
At T0, central MFTC cartilage thickness was significantly less (median 2.00 vs 3.42 mm; p=0.0005; ccAUC=0.64; 95% CI 0.57 to 0.71; aAUC=0.74; 95% CI 0.68 to 0.80) in case versus control knees (figure 2; table 3). The external and central femoral subregions and the external tibial subregion showed the largest percentage differences (see supplementary table S2, available online only). Denuded areas and total subchondral bone areas, in the medial (but not in the lateral) compartment were significantly larger in case than in control knees (table 3). Denuded bone areas in the medial femur distinguished case and control knees most strongly (p<0.0001, ccAUC=0.66; 95% CI 0.59 to 0.73; aAUC=0.75; 95% CI 0.69 to 0.81) but VC did not, except for the medial weight-bearing femur (table 3). At T−1, p values of differences between KR knees and controls were less discriminatory than at T0, but were still significant for most medial compartment measures (see supplementary table S3, available online only).
Cross-sectional differences at T0 in quantitative parameters of femorotibial cartilage structure in knees undergoing KR (KR cases; n=127) versus control knees not undergoing KR (n=127)
Discussion
To be validated clinically, an imaging endpoint should show a natural course closely related to that of the relevant clinical endpoint,16 (ie, a loss in cartilage thickness should be linked to an increased incidence of KR). This represents the largest study to date to examine the relationship of longitudinal and cross-sectional qMRI measures of cartilage status with the risk of KR, and the first to control fully for radiographic disease stage (KLG). The rate of longitudinal cartilage thickness loss in the (central) MFTC was found to be significantly greater in knees before KR than in matched control knees, with AUC similar to those reported for a composite of pain and function.19 This supports the theory that ‘cartilage thickness loss’ represents a structural measure of tissue pathology that is directly or indirectly associated with joint ‘death’. Furthermore, the findings support the use of ‘cartilage thickness loss’ as an imaging endpoint in clinical trials, evaluating the effectiveness of structure-modifying intervention.
Cicuttini et al38 provided initial reports of a relationship between 2-year VC loss and KR in a prospective cohort of 113 participants with symptomatic knee osteoarthritis: Knees in the highest tertile of tibial cartilage loss had a higher odds (7.1; 95% CI 1.4 to 36.5) of being among the 18 receiving a KR between 2 and 4-year follow-up. In the same subjects, the risk of KR was shown to be increased when bone marrow lesions (BML) or subchondral bone cysts were present,39 consistent with other studies reporting a significant relationship between BML and KR,40–42 and others reporting an association between BML and pain43 and BML and rates of cartilage loss.44–47 Data from a recent interventional trial48 also suggested that 2-year VC change in the MFTC predicted KR (at 4–7 years follow-up; n=18). A limitation of the above studies, however, is that results were not adjusted for radiographic disease stage. Participants with joint space narrowing at baseline show a greater and or more uniform reduction of JSW49 ,50 and cartilage loss26 ,33 ,35 ,51 than those without, and severe joint space narrowing (KLG 4) knees display the greatest change.34 Because subjects at higher radiographic disease stages have more symptoms52 and are more likely to receive a KR, the findings of the above cohort studies therefore failed to prove a direct relationship between cartilage loss and the risk of KR. Furthermore, each of the above studies had less than 20 KR cases and was limited to (total plate) VC (change).
In the current study, markers and anatomical (sub)regions found to be most predictive longitudinally were those previously shown to be most sensitive to change, ie, the central femorotibial compartment.12 ,34 Measures in the medial compartment differentiated more strongly between cases and controls, consistent with the medial compartment being generally more highly loaded,53 and knee osteoarthritis affecting the medial compartment more often than the lateral.54 The observation that longitudinal differences between cases and controls appear greatest in KLG 0–2 knees suggests that at an early radiographic disease stage the dynamics of structural change must be exceptionally high for a patient to undergo KR. Although knees in that radiographic stratum that receive a KR have a very rapid cartilage loss, one must be aware that these constitute only a very small minority (n=25) of all 4796 OAI participants. Trying to identify these during enrolment would involve a huge screening effort and would be extremely costly and challenging.
The medial subregions that were most predictive longitudinally were not identical to those that discriminated best cross-sectionally, potentially because the cartilage may have already been lost completely at baseline, thus not providing sufficient dynamic range to observe longitudinal change. The most discriminative ‘prognostic’ cross-sectional, quantitative MRI measures included denuded bone areas, previously shown to be associated with pain severity and incident pain.55 As cartilage is aneural, its loss probably starts causing symptoms and functional impairment only at a stage when subchondral bone begins to be exposed. Cases also showed approximately 4% larger subchondral bone areas, potentially caused by increased metaphyseal expansion associated with knee osteoarthritis56 and/or by increased mechanical loading.57
Limitations of the current study include that changes in qMRI measures were evaluated more or less immediately preceding KR and were not directly compared with changes in radiographic JSW. Bruyere et al,16 for instance, reported an AUC for JSW of 0.73 between KR and non KR knees using a case–cohort design, but they did not use a case–control design that matched for baseline KLG; looked at 3-year (rather than 1-year) change; and only studied 11 KR knees (and five with joint debridement/meniscectomy). Future studies therefore need to explore whether change in cartilage thickness at earlier observation periods also predicts KR, and how qMRI measures compare with change in radiographic measures of disease progression. Whether control knees had a KR after the 4-year follow-up is unknown; however, this form of misclassification would probably blunt the differences observed between cases and controls. Finally, other structural features, such as BML, pain features other than frequency (eg, pain intensity and its impact on function), and further potential confounders, such as inflammation, alignment, abnormal joint mechanics etc were not included in this analysis. These may be co-linearly related to the cartilage thickness change and risk of KR; but the current study did not aim to assess causal relationships, but to evaluate qMRI cartilage measures as ‘prognostic’ or ‘efficacy of intervention’ markers.20 In future studies, the specific qMRI biomarkers examined here should be compared side-by side with other (clinical, radiographic, MRI-based, molecular) markers, to identify which (combination of) marker(s) is most efficient in predicting the risk of KR, and in evaluating the efficacy of structure-modifying therapy.
In conclusion, qMRI measures of cartilage are shown to predict KR longitudinally and cross-sectionally. Given that the prediction of KR based on clinical and radiographic measures has proved challenging, these novel structural measures may assist clinically in the decision of whether KR is indicated. The current findings support the concept that treatments that slow cartilage loss may delay or prevent KR. Longitudinal measures of cartilage structure may thus be used as ‘efficacy of intervention’ markers in clinical trials, to demonstrate the efficacy of structure-modifying intervention at shorter time intervals than possible when examining the clinical endpoint (KR) itself.
Acknowledgments
The authors thank the following operators at Chondrometrics GmbH: Gudrun Goldmann, Linda Jakobi, Manuela Kunz, Tanja Killer, Dr Susanne Maschek, Jana Matthes, Tina Matthes, Sabine Mühlsimer, Julia Niedermeier, Annette Thebis, Dr Barbara Wehr and D Gabriele Zeitelhack for the segmentation of the MRI data. Susanne Maschek is to be thanked for quality control readings of the segmentations. Furthermore, the authors would like to thank the readers of the fixed flexion radiographs at Boston University for the central KL grading, the OAI investigators, clinic staff and OAI participants at each of the OAI clinical centres for their contributions in acquiring the publicly available clinical and imaging data, the team at the OAI coordinating centre, particularly John Lynch, Maurice Dockrell and Jason Maeda, for their help in selecting images and verifying the KR radiographically, and Stephanie Green and Hilary Peterson at Pittsburgh for administrative support. This manuscript has received the approval of the OAI Publications Committee based on a review of its scientific content and data interpretation.
References
Supplementary materials
Supplementary Data
This web only file has been produced by the BMJ Publishing Group from an electronic file supplied by the author(s) and has not been edited for content.
Files in this Data Supplement:
- Data supplement - Online tables
Footnotes
-
Contributors Concept and design: FE, CKK, MCN, MRJ and DJH. Acquisition of data: CKK, SC, MIH, WW, MCN and DJH. Analysis and interpretation of data: FE, CKK, RMB, ZW, MJH, SC, MIH, WW, AG, MCN, MRJ and DJH. Drafting of the manuscript: FE, CKK, RMB and DJH. Critical revision of the manuscript and important intellectual content: FE, CKK, RMB, ZW, MJH, SC, MIH, WW, AG, MCN, MRJ and DJH. Statistical analysis: FE, CKK, RMB, ZW, MJH and DJH. Obtaining funding: FE, CKK, MCN, MRJ and DJH. Administrative, technical or material support: SC, MIH, WW and AG. Supervision: FE, CKK and DJH.
-
Funding The study and image acquisition was funded by the OAI, a public–private partnership composed of five contracts (N01-AR-2-2258; N01-AR-2-2259; N01-AR-2-2260; N01-AR-2-2261; N01-AR-2-2262) funded by the National Institutes of Health, a branch of the Department of Health and Human Services, and conducted by the OAI study investigators. Private funding partners of the OAI include Merck Research Laboratories; Novartis Pharmaceuticals Corporation, GlaxoSmithKline and Pfizer, Inc. Private sector funding for the OAI is managed by the Foundation for the National Institutes of Health. The image analysis of this study was partly funded by Novartis Pharma AG (Basel, Switzerland), in part by a contract with the University of Pittsburgh (Pivotal OAI MRI Analyses POMA: NIH/NHLBI contract no. HHSN2682010000 21C) and in part by a vendor contract from the OAI coordinating centre at University of California, San Francisco (N01-AR-2-2258). The statistical data analysis was funded by a contract with the University of Pittsburgh (Pivotal OAI MRI Analyses POMA: NIH/NHLBI contract no. HHSN2682010000 21C) and the University of Pittsburgh Multidisciplinary Clinical Research Center (MCRC) for Rheumatic and Musculoskeletal Diseases (P60 AR054731). The sponsors were not directly involved in the design and conduct of the study; collection, management, analysis, and interpretation of the data; and preparation, review, or approval of the manuscript. The statistical analysis of the data (based on the entire raw dataset and evaluation of the study protocol, and pre-specified plan for data analysis) was conducted by an independent statistical team at an academic institution (the University of Pittsburgh), which is independent of the commercial sponsor. No compensation or funding from a commercial sponsor was received for conducting the analyses.
-
Competing interests FE is CEO of Chondrometrics GmbH, a company providing magnetic resonance image analysis services to academic researchers and to industry. He provides consulting services to MerckSerono, Novartis, and Sanofi Aventis, has received speaker honoraria from Merck, GlaxoSmithKline, Genzyme, Medtronic, and Synthes, and has received research support from Pfizer, Eli Lilly, MerckSerono, Glaxo Smith Kline, Centocor R&D, Wyeth, Novartis and Stryker. SC, MIH and WW have part time employment with Chondrometrics GmbH; WW is a co-owner of Chondrometrics GmbH. MIH has provided consulting services to Perceptive. AG is president and co-owner of the Boston Core Imaging Lab (BICL), a company providing MRI reading services to academic researchers and to industry. He provides consulting services to Novartis, Genzyme, Stryker, MerckSerono and AstraZeneca. MRJ is an employee of Novartis Pharma AG. CKK has provided consulting services to Novartis and has received research support from Astra-Zeneca. RMB, ZW, MJH, MCN and DJH have no conflict of interest to declare.
-
Patient consent Obtained.
-
Ethics approval The study was approved by the institutional review boards at each of the sites.
-
Provenance and peer review Not commissioned; externally peer reviewed.
-
Data sharing statement The quantitative cartilage data published in this article will be made available after completion of the Pivotal OAI MRI Analyses [POMA] Study: NIH/NHLBI contract no. HHSN2682010000 21C).