Article Text

Abstract
Objective: To investigate development of radiographic damage in hands and feet of patients with early rheumatoid arthritis (RA) monitored prospectively for 10 years, and to search for prognostic factors.
Patients and methods: 181 patients with early RA (mean disease duration one year) were assessed annually with radiographs of hands and feet during years 0–5 and at year 10. Radiographs were evaluated according to Larsen (range 0–200). Predictive factors for progressive disease for years 0–5 and 5–10 were evaluated by logistic regression analyses.
Results: 82/168 (49%) patients had erosions at inclusion and almost all became erosive with time (90% after two years and 96% after 10 years). Radiographic progression was most rapid during the first two years and 75% of all damage occurred during the first five years. The median Larsen score increased from 6 at inclusion to 41 after five years and 54 after 10 years. Only 5.3% of all evaluated joints became maximally eroded, the second metacarpophalangeal joint being the most commonly affected. Mean ESR during the first three months and rheumatoid factor status were significant predictors for radiographic progressive disease, it was not possible to predict non-progressive disease.
Conclusions: Joint damage in hands and feet developed early and progression was most rapid during the first years of disease. The different rates of progression at different stages should be considered in the design of trials of drugs aimed at retarding joint damage. Disease activity at study start influenced the degree of joint damage during the entire 10 years.
- outcome
- radiographic damage
- rheumatoid arthritis
- CI, confidence interval
- DMARDs, disease modifying antirheumatic drugs
- ESR, erythrocyte sedimentation rate
- HAQ, Health Assessment Questionnaire
- ICC, intraclass correlation coefficient
- IP, interphalangeal
- IQ, interquartile
- JDS, joint damage score
- MCP, metacarpophalangeal
- MTP, metatarsophalangeal
- RA, rheumatoid arthritis
- RF, rheumatoid factor
- SHS, Sharp/van der Heijde
Statistics from Altmetric.com
- CI, confidence interval
- DMARDs, disease modifying antirheumatic drugs
- ESR, erythrocyte sedimentation rate
- HAQ, Health Assessment Questionnaire
- ICC, intraclass correlation coefficient
- IP, interphalangeal
- IQ, interquartile
- JDS, joint damage score
- MCP, metacarpophalangeal
- MTP, metatarsophalangeal
- RA, rheumatoid arthritis
- RF, rheumatoid factor
- SHS, Sharp/van der Heijde
Radiographic damage is one of the core sets in diagnosing and evaluating the course of rheumatoid arthritis (RA). Radiographic changes—for example, erosions and joint space narrowing, reflect the cumulative history of the disease. The changes are generally progressive and have until recently been considered irreversible. However, some evidence suggesting reparative or healing mechanisms has been presented,1–3 but complete reconstitution does not occur. The progressively affected joint damage has an important role in the development of impairment, disability, and handicap of patients with RA. Radiographic data can be re-evaluated, which is in contrast with most clinical variables, which are impossible to re-evaluate because they reflect a specific sign or symptom at a given moment. Thus, the radiographic outcome can be considered more objective, but nevertheless each radiographic evaluation relies on the skill and experience of the observers in the same way as clinical measures. Projection of the roentgen beam and technical issues like film quality and exposure also influence the scoring results.
Data on the rate of radiographic progression are not unanimous. Some studies have shown that radiographic progression is linear,4–6 whereas others,7,8 including our five year follow up,9 have shown that the progression rate is faster during the first 2–3 years of the disease. Yet other studies have identified up to five different progression types.10–12
Recent studies have shown that some treatment strategies retard the progression rate of radiographic damage,13–15 and in trials of new treatments in RA the development of radiographic joint damage is usually evaluated. A prerequisite for such studies is access to proper control groups, which may not be easy to recruit, because placebo controlled studies are more or less impossible to perform for ethical reasons. Thus longitudinal follow up studies of patients with RA such as this, recruited before the introduction of current treatment standards, may serve as a reference.
The purpose of this study was to describe the development of joint damage during the first 10 years in patients with RA diagnosed between 1985 and 1989. We also investigated whether it might be possible to predict radiographic outcome from clinical and laboratory baseline variables.
PATIENTS AND METHODS
Patients
The patients are taking part in an early RA study at Lund University Hospital in southern Sweden. All patients above the age of 18 years with a definite RA diagnosis between 1985 and 1989 were included.16 Most patients were referred from primary care as a result of a special campaign to recruit patients with recent onset of disease. The duration of symptoms had to be <24 months at inclusion. In total 183 patients, 116 women and 67 men, were included. The initial radiographs were lost in two patients (one woman and one man) who both died during the first year. This study therefore comprises 181 patients with a mean (SD) age of 51.2 (12.4) years and with a mean (SD) duration of symptoms of 11.1 (6.1) months at inclusion. One hundred and twenty eight of 181 (71%) were rheumatoid factor (RF) positive,17 145 of 170 (85%) genotyped patients carried the shared epitope,18 and 69 (38%) developed nodular disease. All patients, irrespective of disease activity, were included and followed up prospectively annually at a team care unit. Patients with active disease were offered treatment with disease modifying antirheumatic drugs (DMARDs) throughout the study. During the first years hydroxychloroquine and d-penicillamine were the most commonly used DMARDs whereas at the 10 year follow up methotrexate was the most frequently used drug. Altogether 136 (75%) of the patients were treated with DMARDS during 57% of the follow up time. Table 1 lists the different drugs used. Eighty three (46%) patients received low dose oral glucocorticoid treatment during some period of the study. Clinical outcome after 10 years is presented more extensively elsewhere.19
DMARDs used during the 10 years
Methods
Clinical and laboratory assessment
Joint inflammation was assessed by an active joint count (defined as swollen and either tender or painful on motion). The 50 joints evaluated included all but two from the Ritchie index—namely, the neck and subtalar joints. Disability was evaluated using a Swedish version of the Stanford Health Assessment Questionnaire (HAQ) disability index.20 The erythrocyte sedimentation rate (ESR) was analysed according to Westergren.
Radiographic assessment
Radiographs of hands and feet (standard film in anteroposterior projection) were taken annually from study start to year 5 and at year 10, comprising seven examinations for each patient. The first examination was performed at a mean (SD) of 9.4 (6.2) months after the onset of symptoms.
The radiographs were evaluated according to Larsen and Dale.21 Thirty two joints were assessed: metacarpophalangeal (MCP) I–V, interphalangeal (IP) I, proximal interphalangeal II–V, and the wrist in both hands, and IP I and metatarsophalangeal (MTP) II–V in both feet. Each joint was compared with a standard reference film. The changes were graded from 0 to 5; 0 being normal; 1, joint space narrowing, soft tissue swelling or periarticular osteoporosis; 2–5, increasing degree of erosions and destruction. A joint damage score (JDS) was calculated by adding all the scores, the wrist multiplied by five, resulting in a span of 0–200.22,23
The scoring was made by one of two assessors, one being an experienced rheumatologist (Eva Fex) who read the films from 106 of the patients from years 0–5 in chronological order. The other assessor was an experienced radiologist (KJ) who read the films from the remaining 75 patients from years 0–5 in chronological order. KJ evaluated all the 10 year evaluations separately. Clinical and laboratory information was not available at the time of radiological evaluation. The score for each joint was registered separately. Erosive disease was considered present if any individual joint had a Larsen score of ⩾2.
The rate of progression was calculated by subtracting the JDS year by year. The rate of progression during five years was calculated by subtracting the JDS at inclusion from that at year 5 and the JDS at year 5 from that at year 10. Progression was defined as an increase in the Larsen score of 11 units or more.24,25
Reliability of the radiological scoring was evaluated using the intraclass correlation coefficient (ICC). For determination of interobserver agreement both assessors scored 105 examinations chosen at random independently. ICC (95% confidence interval (CI)) was 0.97 (0.96 to 0.99). Owing to the death of EF no intraobserver agreement was performed on her readings. Intraobserver reproducibility for KJ was assessed on 58 examinations (three quarters with an interval of 3–6 months and a quarter with an interval of five years). The ICC (95% CI) was 0.95 (0.92 to 0.97). In 18 patients we also examined the agreement between the scores for the 10 year examination if read separately or if the whole series of radiographs from year 0–10 were available. The ICC (95% CI) was 0.96 (0.90 to 0.99).
Statistical analyses
Non-parametric tests were used for comparisons within and between groups (Wilcoxon’s test, Mann Whitney’s test, or χ2 test, when appropriate). Reliability testing of the radiographic scorings was performed using the ICC. The demographic data and different clinical variables at baseline were candidate predictive factors. Only variables producing significant associations (p<0.10) with radiographic progression during years 0–5 and 5–10, respectively, in bivariate analyses were entered into multivariate models. We performed regression analyses with radiographic outcome both as dichotomised (logistic regression) and continuous (linear regression) dependent variable. Analyses for progression from baseline to year 5 and from year 5 to 10 were performed separately. In the logistic regression analyses exponent B was considered an odds ratio and was calculated with 95% CI.
In the description of the development of structural changes over time all available radiographs each year were used. However, for the prediction we only included patients with complete data in the analyses (122 for years 0–5 and 121 for years 5–10).
RESULTS
The study comprised seven radiographic examinations for each patient. The median number of examinations obtained for each patient was 6 (range 3–7). All radiographs were available for 79 (44%) patients. Figure 1 shows the numbers of radiographs assessed each year. Ten year radiographs were available in 157 patients (87%). Of the 24 patients missing from the 10 year follow up, 15 had died, 5 had moved from the area, 3 were excluded because of old age or other diseases, and 1 refused the examination. There were no significant differences in RF positivity, shared epitope, HAQ, ESR, active joint count, or Larsen score at inclusion between the patient group with the missing 10 year radiographs and the evaluated group.

The Larsen scores at each year. The box plots show the median and 10th, 25th, 75th, and 90th centiles. All changes in Larsen scores were highly significant (p<0.001).
Table 2 shows the development of disease activity measures and the HAQ over time.
Clinical outcome during the study. Medians and interquartile ranges are presented
Radiographic progression
Erosive disease developed early and 82/168 (49%) of our patients had erosions already at baseline. After two years 151/167 (90%) of the patients had developed erosions. At the end of the study the number of patients with erosive disease had increased to 150/157 (96%).
At 10 years the median (interquartile (IQ) range) Larsen score was 54 (28–80) with a maximal score of 162/200. Nine patients (6%) had a Larsen score of 120 or higher. Figure 1 shows the median Larsen scores each year.
Figure 2 shows the annual progression rates for the first five years and from year 5 to 10. The progression rate was highest during the first two years with a median change of 5–7 Larsen units annually. From year 4 and onwards the median progression rate was 2–3 Larsen units a year.
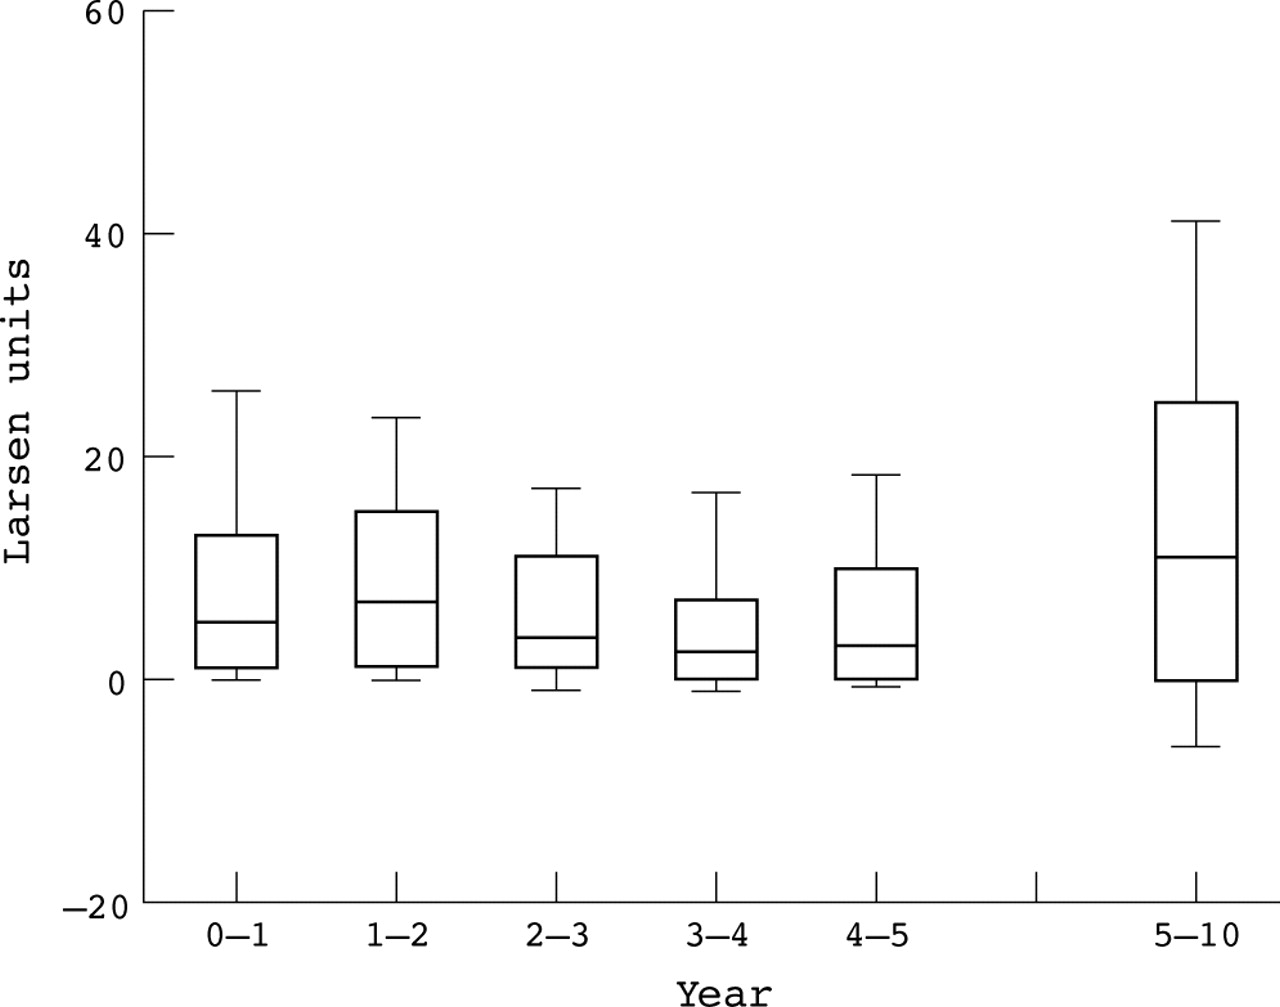
Progression rates of radiographic damage for each year during the first five years and from year 5–10. The box plots show the median and 10th, 25th, 75th, and 90th centiles.
The number of joints with erosive changes (that is, Larsen units 2–5) each year was recorded. Figure 3 shows the percentage of examined joints with erosions each year. After 10 years 39.4% of the examined joints showed erosive changes.
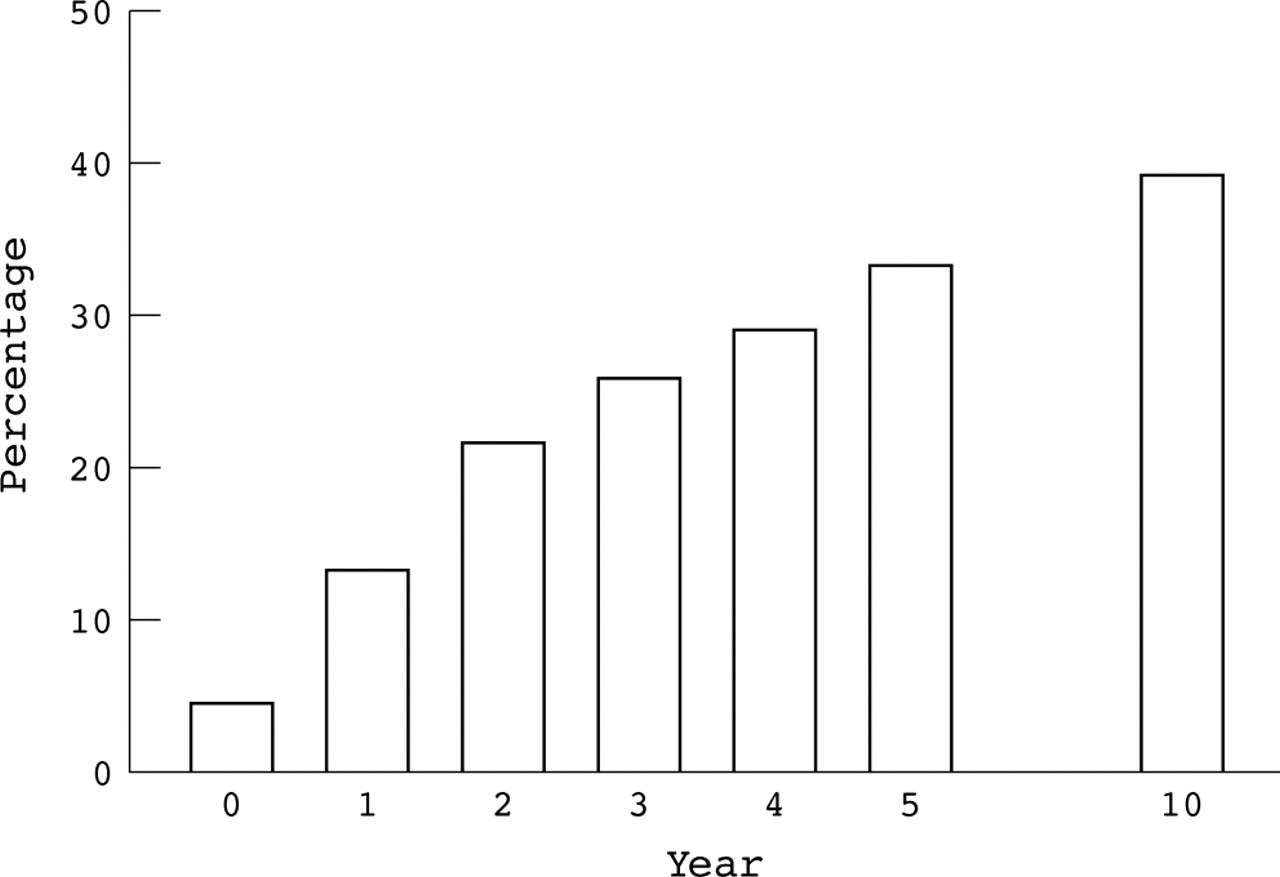
Percentage of examined joints with erosive changes (Larsen 2–5).
The median (IQ range) progression in Larsen score during the first five years of disease was 32 (10–55) and from year 5 to 10 it was 11 (0–26.5). Hence, three quarters of the radiographic progression occurred during the first five years and only a quarter during the following five years.
The patients were divided into two groups: those with or without radiographic progression during years 0–5 and 5–10, respectively (cut off value 11 Larsen units). During the first five years 75% of the patients had a progressive disease, while during the following five years the percentage of patients with radiographic progression had diminished to 50.4%.
Distribution of joint erosions
Early erosive changes were more common in the feet than in the hands. At inclusion 62/168 (37%) patients had erosive changes in the feet and 46/168 (27%) in the hands. From year 3 and onwards the hands and feet were equally affected with erosive changes in about 80% of the patients. At 10 years 142/157 (90%) patients had erosions in the hands and 136/157 (87%) in the feet.
The right hand had a higher Larsen score than the left at inclusion and during the first three years but thereafter the differences between right and left sides disappeared. In the feet, there were no differences in involvement between the left and right side.
At baseline the three most commonly eroded joints were MTP V (15.5%), wrists (7.4%), and the IP joints of the big toes (6.5%). At year 5 the order was MTP V (61.7%), wrists (58.5%), and MCP II (44.0%), and at 10 years the wrists (72.6%), the MTP V (65.6%) and the MCP II (51.9%).
Maximally eroded joints
Figure 4 presents the number of patients with at least one joint with maximal Larsen score (5), each year. After 10 years 62/157 (39%) patients had at least one maximally eroded joint. Among these patients the median (IQ range) number of maximally eroded joints was 3 (1–6). However, only 5.3% of all the evaluated joints reached the maximal score during the study. The MCP II joint most frequently reached a score of 5, which occurred in 36/157 (23%) patients.

Number of patients with at least one joint with maximal Larsen score (5).
Relation to treatment
The radiographic progression was significantly higher in the patient group treated with DMARDs (n=122) for some time during the study period (p<0.001). Patients not treated with DMARDs (n=35) were significantly older (p<0.01) and more often RF negative (p<0.001). The patient group (n=77) treated with low dose oral glucocorticoids for some time during the study also showed significantly worse radiographic changes (p<0.001).
Prediction
Age, sex, RF, genotype, active joint count, ESR, HAQ, and Larsen scores at the beginning of the study were considered candidate predictive factors for radiographic progression or not during years 0–5 and 5–10, respectively. In the bivariate analyses (Mann-Whitney or χ2 test) active joint count (p=0.09), ESR (p<0.001), RF (p<0.001), and shared epitope (p=0.001) differed significantly between the two groups for years 0–5 and baseline Larsen score (p=0.03), ESR (p=0.02), and RF (p=0.001) for years 5–10. Only those variables that showed significant associations (p<0.10) with radiographic outcome were used as possible predictors in the different subsequent multivariate analyses.
Similar results were obtained both for the logistic and the linear regression models. We chose to present the results of the logistic regression models as this type of analysis yields somewhat more information about the predictive value of the different independent variables. Table 3 shows the logistic regression model with radiographic progression 0–5 years as dependent variable. Twenty nine patients with non-progressive and 93 with progressive disease (according to the previously decided cut off value of 11 Larsen units) had complete data for this analysis. Mean ESR during the first three months, RF, and shared epitope were significant predictors, classifying 93% of the patients with progressive and 48% of those with non-progressive disease into the right group. ESR was the strongest predictor.
Logistic regression model with progression 0–5 years as dependent variable
Table 4 shows the same calculation for progression 5–10 years. Sixty patients with non-progressive and 61 with progressive disease were included in this analysis. RF and mean ESR during the first three months were the only significant predictors. The model could classify correctly 97% of the patients whose disease had progressed, but only 32% of those where it did not progress. In this model RF status was the strongest predictor.
Logistic regression model with progression 5–10 years as dependent variable
DISCUSSION
The most important findings of this study were that joint damage occurred early in the course of RA and that radiographic progression was most rapid during the first years of disease. Almost half of our patients had erosive changes at the study start and after two years 90% had become erosive. Seventy five per cent of the joint damage as assessed by the Larsen index occurred during the first half of the study.
Studies of radiographic progression in patients with RA have shown diverging results. Several important factors should be considered when interpreting results from different studies, such as patient selection, disease duration at inclusion, the number of radiographic examinations performed in each patient during the study, the order in which the radiographs were evaluated, and the scoring method used. The most commonly used scoring methods are the Sharp index,26 the modified Sharp/van der Heijde index (SHS),27,28 and the Larsen index21 with different modifications. In the Larsen index an overall assessment of each joint is performed, including both joint erosions and joint space narrowing, whereas in the Sharp methods joint space narrowing and joint erosions are evaluated separately. There is, however, a rather good correlation between the scoring systems,29 and direct comparisons can be made if the percentage of maximal scores and number of joints with erosive changes are calculated. In the SHS method more weight is given to changes in the feet, which account for 37.5% of the total score compared with 25% in the Larsen score. Wrists are given equal importance in the two systems (25% of the total score).
Intraobserver reliability testing of our radiographic scoring became incomplete owing to circumstances explained in the “Methods” section, but interobserver reliability was very high. We therefore think that our scoring procedure has acceptable reliability, especially considering the longitudinal observational study design and that the study started in the middle of the 1980s. During recent years, a lot of work has been done to make radiographic assessment conform.30–36 Most emphasis has been put on randomised clinical trials where strict comparison between groups and small changes over a short time are important. However, for longitudinal studies even the new recommendations find a less strict approach acceptable.36
Reading the films in chronological order might overestimate progression but reduce the measurement error.37 The quality of the films and the positioning become less important using this approach.37 Hulsmans et al also read the radiographs in chronological order,6 whereas others4,38 read their radiographs in random order.
The findings of early erosive changes are in accordance with most comparable prospective studies8,11,39–41 Our findings of early radiographic changes in the feet and the later appearance of changes in the hands also corroborate other investigations.6,11,38,39 The distribution of erosive changes with MTP V being the most commonly eroded joint in early disease followed by more intense engagement of the wrists and MCP II has also been reported previously.6,38
The pattern of progression of radiographic damage in the course of RA is important, as radiographic damage is generally measured in trials of new drugs and usually comparisons are made versus a predicted progression rate. The results for the rate of radiographic progression are still controversial. The most pronounced progression early in the disease course found in our study is supported by other studies.7,40,42,43 On the other hand, some investigators have shown a linear progression.4–6 In the study by Wolfe and Sharp4 the frequency and times of the radiographic examinations were not standardised, which makes it more difficult to detect early rapid progression. Other studies have divided the patients with RA into 4–5 different groups depending on their pattern of radiographic progression.10–12
The inclusion criteria for this study allowed enrolment for all patients with RA irrespective of disease activity. About 20% of the patients in the cohort had a more limited disease and were on clinical grounds not treated with DMARDs. These patients showed much less radiographic progression, implying that some patients with RA, even with established disease, do fairly well without such treatment. The most likely explanation for the worse radiographic progression among the patients treated with DMARDs and glucocorticoids is that they had more severe disease. Some other investigators have made the same observation.4 The progression among the treated patients might have been slower with the more aggressive treatment strategies available today.
A problem in long term studies is that a ceiling effect within the radiographic scoring system will eventually influence the results.44 In this cohort almost all patients who had one or more totally destroyed joint still had a progressive disease and only 5.3% of evaluated joints had reached the maximal score. Furthermore, only a few outliers had reached very high Larsen scores after 10 years and only 40% of all evaluated joints showed erosive changes. The median Larsen score was 54/200 and the worst quartile started at 80, which are both scores in the lower part of the scale. This shows that for at least 10 years’ disease duration, the Larsen scoring method can be used without reaching a ceiling of detection being reached.
Our regression models could only classify patients who progressed. ESR at the study start was the best predictor for radiographic outcome during the first five years, and it is notable that this variable had some predictive power also for the following five years. Odds ratios were low, but our findings again underline the importance of disease activity control as early as possible in the course of the disease. The predictive value of disease activity measures has been demonstrated in many other studies.4,38,39,45,46 Rheumatoid factor was associated with radiographic progression and was also a significant predictor for outcome during both study periods. This is in accord with findings in many other studies.10,11,47 The presence or not of a shared epitope also had some predictive values for years 0–5. However, the frequent occurrence of these markers in patients with RA limits their prognostic value. This might to some extent explain why it was not possible to predict which patients have non-progressive disease.
We used a rather robust limit value for definition of progressive disease, which might to some degree have underestimated the power of the predictive analyses. The limit value of 11 Larsen units was derived from published reports,24,25 as our radiographic scoring did not allow for a study and observer dependent value.34
To conclude, we have found that radiographic damage develops early and progression is more rapid during the first years of the disease. The Larsen scoring system for hands and feet is a useful means of assessing joint damage progression during the first 10 years in RA. The different rates of progression during the course of the disease should be taken into account in the interpretation of drug trials where radiographic progression is used as an outcome measure.
Acknowledgments
Grants were obtained from the Swedish Medical Research Council, the Österlund and Kock Foundations, the King Gustav 80 year Fund, and Reumatikerförbundet. We would like to acknowledge the late Eva Fex who contributed to the work presented in the paper.