Article Text

Abstract
OBJECTIVES To investigate the progression of erosions at sites within the carpus, in patients with early rheumatoid arthritis (RA), using magnetic resonance imaging (MRI) and plain radiology over a two year period.
METHODS Gadolinium enhanced MRI scans of the dominant wrist were performed in 42 patients with RA at baseline (within six months of symptom onset) and one year. Plain wrist radiographs (x rays) and clinical data were obtained at baseline, one year, and two years. Erosions were scored by two musculoskeletal radiologists on MRI andx ray at 15 sites in the wrist. A patient centred analysis was used to evaluate the prognostic value of a baseline MRI scan. A lesion centred analysis was used to track the progression of individual erosions over two years.
RESULTS The baseline MRI erosion score was predictive of x ray erosion score at two years (p=0.004). Patients with a “total MRI score” (erosion, bone oedema, synovitis, and tendonitis) ⩾13 at baseline were significantly more likely to develop erosions onx ray at two years (odds ratio 13.4, 95% CI 2.65 to 60.5, p=0.002). Baseline wrist MRI has a sensitivity of 80%, a specificity of 76%, a positive predictive value of 67%, and a high negative predictive value of 86% for the prediction of wristx ray erosions at two years. A lesion centred analysis, which included erosions scored by one or both radiologists, showed that 84% of baseline MRI erosions were still present at one year. When a more stringent analysis was used which required complete concordance between radiologists, all baseline lesions persisted at one year. The number of MRI erosion sites in each patient increased from 2.1 (SD 2.7) to 5.0 (4.6) (p<0.0001) over the first year of disease. When MRI erosion sites were tracked, 21% and 26% were observed on x ray, one and two years later. A high baseline MRI synovitis score, Ritchie score, and erythrocyte sedimentation rate were predictive of progression of MRI erosions to x ray erosions over one year (p=0.005, 0.01, and 0.03 respectively), but there was no association with the shared epitope. Progression of MRI erosions tox ray erosions was not seen in those with transient polyarthritis.
CONCLUSIONS MRI scans of the wrist, taken when patients first present with RA, can predict radiographic erosions at two years. MRI may have a role in the assessment of disease prognosis and selection of patients for more or less aggressive treatment. However, only one in four MRI erosions progresses to an x ray erosion over one year, possibly owing to healing, observer error, or technical limitations of radiography at the carpus. Progression of MRI erosions to x ray erosions is greatest in those with high baseline disease activity.
- magnetic resonance imaging
- carpus
- early rheumatoid arthritis
- erosions
Statistics from Altmetric.com
Magnetic resonance imaging (MRI) is a highly sensitive technique for disclosing early rheumatoid erosions and has been shown to be better than plain radiography by a number of authors.1-6 Studies from this cohort have already shown that 45% of patients with early rheumatoid arthritis (RA) have erosions within four months of disease onset whenx ray erosions were apparent in only 12%.1 ,2 By year 1, MRI erosions were seen in 75% andx ray erosions in 29%. Although numerous cross sectional studies comparing MRI erosions withx ray erosions have now been published, there are fewer reports describing the progression of erosions longitudinally during early disease, using both imaging modalities.7 ,8 This cohort is the largest described to date in which MRI and x ray techniques have been used to image the wrist; an important site of erosions in early disease. As data were collected for a specific site, this provides an opportunity to follow the progress of individual lesions and to determine what proportion of MRI erosions evolve intox ray erosions.
Whether erosions can heal in response to disease modifying antirheumatic drug (DMARD) treatment is contentious.9-11Recent reports suggest that anti-tumour necrosis factor α biological treatments may be particularly efficacious in this regard.12-14 As MRI is increasingly recognised as an important imaging modality to assess disease progression in early RA, it is likely to become an important tool in assessing responses to new disease modifying biological agents and has already been incorporated into trials to assess outcome.15 It is vitally important that the sequence of progression of rheumatoid disease and, particularly erosions, be studied outside the context of such trials, so that data on the reliability and reproducibility of MRI lesions can be compared and contrasted with the much larger radiographic experience. Unfortunately, it is impossible and unethical to study erosive progression in patients with RA without DMARD treatment, but our cohort provides valuable information about those receiving “standard treatment” before the widespread use of biological agents.
Patients and methods
PATIENT GROUP AND CLINICAL ASSESSMENTS
An inception cohort of 42 patients with early RA has been studied since symptom onset. Details of recruitment, baseline demographics, and clinical assessments have been described.1 ,2 To summarise briefly, all patients fulfilled 1987 American Rheumatism Association criteria for RA16 and had had symptoms for six months or less (median four months) at entry to the study. All patients were assessed clinically for disease activity, and radiographs of hands and feet obtained, at baseline, one year, and two years. MRI scans of the dominant wrist were taken at baseline and one year. Table 1 summarises drugs used by patients and disease activity scores over the two year period.
Patients' drugs and disease activity at baseline, one year, and two years
MRI SCANS
An MRI scan of the dominant wrist was obtained with a 1.5 Tesla MRI scanner (GE Signa Horizon) with a dedicated wrist coil (Medical Devices). The hand was placed in the wrist coil, where it fitted snugly by the patient's side with the palm facing the body, thumb anteriorly. Each sequence of the follow up study was planned using localising sequences to match the first study sequence as closely as possible. All parameters were identical for both studies. The field of view was 8 cm and included the distal radioulnar, radiocarpal, and midcarpal joints as well as the metacarpal bases. The small field of view was chosen to optimise resolution and did not include metacarpophalangeal (MCP) joints. Coronal and axial T1 sequences were performed, followed by axial fat suppressed fast spin echo T2, then coronal fat suppressed T1 sequences after injection of gadodiamide (Nicomed Omniscan).
MRI SCORING
The system used to score MRI scans has been described previously.1 ,2 Briefly, erosions were defined as focal areas of loss of low signal cortex, with sharply defined margins, identified on both T1 and T2 weighted sequences. The cortex was replaced by well circumscribed intermediate signal tissue on T1, which was intermediate to bright on T2 and enhanced with gadolinium. Erosions were only scored if visible in two planes, with a cortical break seen in at least one plane. Erosions were differentiated from intraosseous cysts, which appeared as well circumscribed, rounded lesions within bone without any associated cortical break as described previously.17 MRI erosions were scored at 15 sites within the carpus as shown in fig 1. A total MRI score for the carpus was derived from the sum of scores for erosions, bone marrow oedema, synovitis, and tendonitis.1

Diagram of the carpus to show sites at which erosions were scored on MRI and x ray. (1) distal ulna; (2) distal radius; (3) triquetrum; (4) pisiform; (5) lunate; (6) scaphoid; (7) hamate; (8) capitate; (9) trapezoid; (10) trapezium; (11) 5th metacarpal base; (12) 4th metacarpal base; (13) 3rd metacarpal base; (14) 2nd metacarpal base; (15) 1st metacarpal base.
MRI scans were scored independently (and without reference to radiographs) by two musculoskeletal radiologists who were blinded to the clinical and genetic data. Scans at year 1 were scored without reference to baseline scans. Validation of the scoring system used has already been reported with an interreader intraclass correlation of 0.79 (0.64–0.98) for erosion number.18 A new lesion centred analysis was also performed for tracking individual lesions at the 15 carpal sites, using data obtained before consensus review. Both radiologists agreed on the presence or absence of erosions at 575/629 sites (91%) at baseline and 537/630 (85%) at year 1. κ Values19 for interreader reliability for individual erosions were calculated as 0.50 for baseline and 0.62 for year 1 scans. When baseline and year 1 MRI scans were considered together, κ values of >0.6 were achieved for erosions at the following sites: distal ulna, distal radius, triquetrum, lunate, capitate, and 2nd metacarpal base, with the most consistent scoring at the capitate (κ=0.66). Scoring was least consistent at the 5th metacarpal base (κ=0.26).
X RAY SCORING
x Rays were scored for erosions as previously described.1 All films were scored independently without reference to preceding films from the same patient. Estimates of interobserver and intraobserver reliability were obtained at baseline and have been reported.1 A lesion centred analysis was also performed for xray scoring. The κ values for interreader reliability for individual erosions at baseline, one year, and two years were 0.4, 0.34, and 0.41, respectively. When all time points were combined, κ values of >0.6 were achieved at the following sites: distal ulna, distal radius, and trapezium, with the most consistently scored site being the distal ulna (κ=0.76). However, there was disagreement on the scoring for a small number of lesions at several sites, including the pisiform, hamate, capitate, trapezoid, and 2nd and 3rd metacarpal bases, resulting in a lower overall κ value of 0.42.
GENETIC STUDIES
Methodology used for HLA-DRB1 typing has already been described.1 Briefly, DNA was extracted from anticoagulated blood obtained from each patient at recruitment. Low resolution typing was performed using sequence-specific primer polymerase chain reaction with a standardised panel of 24 oligonucleotide primer pairs.20 In subjects with alleles of the DRB1*04 or 01 groups, the sequence of the subtype-determining region of exon 2 of the DRB1 gene(s) was obtained by direct sequencing of polymerase chain reaction products.21
STATISTICS
Receiver operating characteristic curves were constructed by varying the cut off point in the baseline total MRI score for prediction of x ray erosions at two years.22 The cut off point that maximised the sum of the specificity and sensitivity for this test was calculated. κ Statistics19 were used as measures of interreader reliability. Logistic and linear regressions were used to investigate which baseline measures were predictors of outcome at years 1 and 2.
Results
PATIENT CENTRED ANALYSIS
Can baseline MRI findings predict x ray erosions at two years?
Of the 18 patients with MRI erosions at baseline, 11 (61%) hadx ray erosions at two years. Of the 22 patients with no wrist erosions on baseline MRI, four (18%) hadx ray erosions at two years. Thus baseline MRI erosion score was predictive of x ray erosion score at two years (p=0.004). A receiver operating characteristic curve22 was constructed to explore the relationship between baseline total MRI score (including erosion, bone oedema, synovitis, and tendonitis) and carpal erosions onx ray at two years (fig 2). The curve plots sensitivity versus 1-specificity and its apex marks the point at which the most favourable sensitivity and specificity are produced. A cut off at 13 was optimal, resulting in sensitivity of 80%, specificity of 76%, positive predictive value of 67% and negative predictive value of 86% for the prediction of wrist x ray erosions at two years. Patients with a total MRI score of 13 or greater at baseline were more likely to develop xray erosions at year 2 than those with a score of less than 13 (χ2 (1 df)=10.13, p=0.002, odds ratio 13.4, 95% confidence interval 2.65 to 60.5).
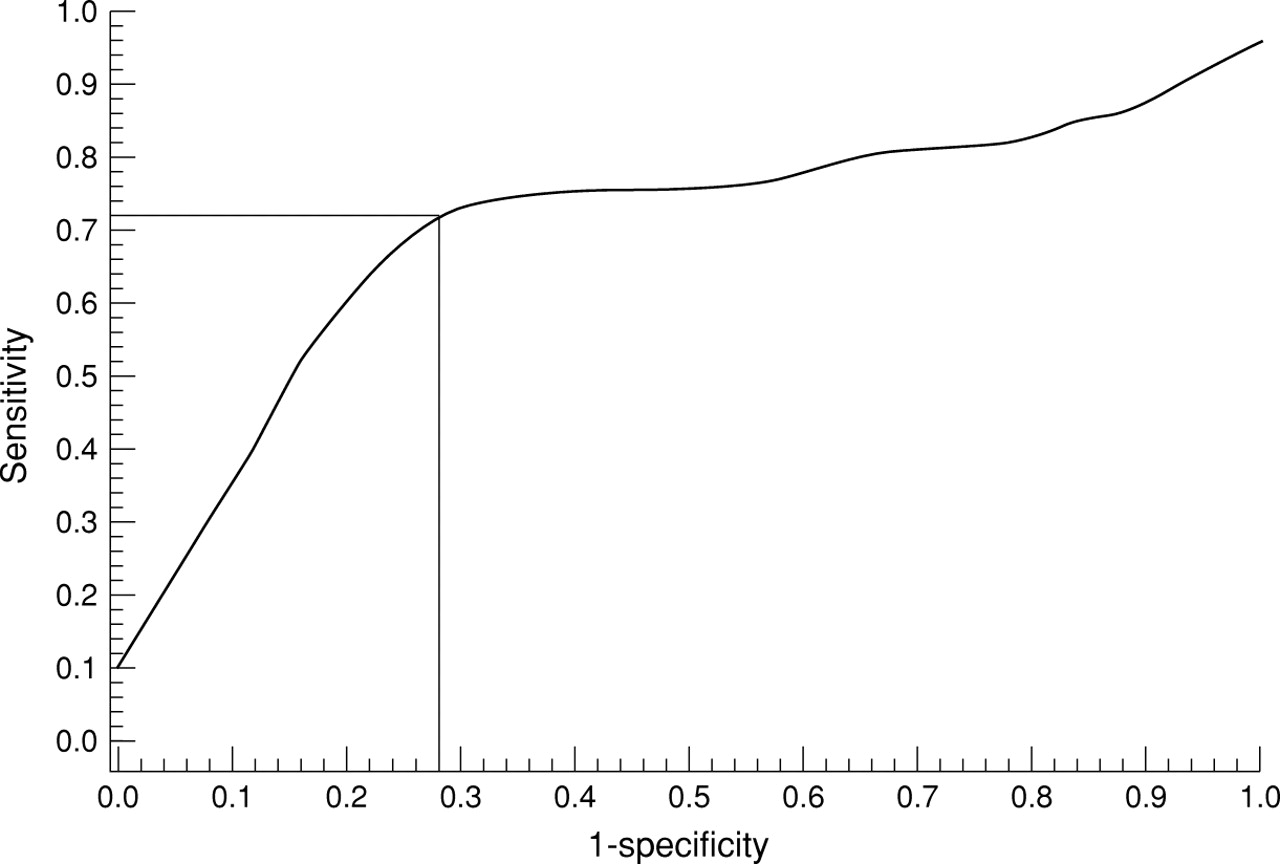
The receiver operating characteristic curve used to investigate the ability of the baseline total MRI score to predict x ray erosions at the dominant carpus at two years. A cut off of 13 provides the maximum sensitivity (80%) and specificity (76%) for this test at the apex of the curve.
Can baseline clinical measures predict x ray erosions or function at two years?
Logistic regression was used to determine whether any of the clinical measures at baseline predicted xray erosions at two years. A positive rheumatoid factor was likely to have influenced erosion development (p=0.08), and this might have reached significance in a larger group. None of the other indicators of disease activity, including swollen joint score, tender joint score, Ritchie score,23 Health Assessment Questionnaire (HAQ) score,24 pain score, erythrocyte sedimentation rate, or C reactive protein, were significantly predictive. The only outcome measure assessed at two years reflecting function was the HAQ score. This was not predicted by the baseline MRI score or any other clinical disease activity measures except the baseline HAQ score (p<0.0001).
Review of diagnosis of RA at two years
After two years of follow up, five patients were well, not taking any drugs, and had no radiological features of RA onx ray examination (table 2). Two had MRI wrist erosions at baseline, which persisted at one year, but did not evolve into radiographic change. In one of these (No 24), the erosions were cystic and atypical and are discussed further below.
Clinical description of patients who no longer fitted the criteria for rheumatoid arthritis at two year follow up
LESION CENTRED ANALYSIS
Tracking individual lesions
Data at each site were available at two time points for MRI (baseline and one year) and three time points forx ray (baseline, one year, and two years). Two datasets (one for each radiologist) were analysed on the basis that erosions were scored as present if seen by one or both radiologists. Although limited consensus data were available,2 this did not extend to a re-examination of erosions at specific sites in all patients and was therefore too incomplete to use for tracking lesions.
Tracking MRI erosions
Of 87 sites showing erosion at baseline, 73 (84%) were still affected on MRI scans at one year. Thus 16% of sites seemed to “disappear” after one year. When a more stringent analysis was used, which required complete concordance between radiologists for scoring the presence or absence of erosions, all baseline lesions were found to persist at one year. Thus those instances from the first analysis, where lesions seemed to disappear, might have represented false positive scores by one radiologist at baseline. Relevant scans from eight patients were reviewed independently by a rheumatologist (FM). In all cases, localised bone marrow oedema adjacent to an area of cortical irregularity was felt to have accounted for the false positive score by one radiologist. Frequently, the area of interest was not well seen on axial scans. An example is shown in figs 3A and B.

Serial MRI scans from patient No 16. (A) Baseline MRI scan (coronal T1 image) shows a large area of bone marrow oedema in the distal pole of the triquetrum. The cortex in this region is indistinct (white arrow). Another area of oedema is also indicated in the triquetrum more proximally and in the lunate (white arrows). (B) MRI scan at one year (coronal T1 image) shows resolution of bone oedema at the pole of the triquetrum with cortical irregularity but no definite erosion (white arrow). The other areas of bone oedema seen on the previous scan are still present (arrowed).
Not only did lesions persist from baseline scans, but 134 new erosion sites had developed on the year 1 scans. When sites for MRI erosion were compared at the two time points, the number in each patient was higher at year 1 (mean (SD) 5.0 (4.6)) than baseline (2.1 (2.7)), p<0.0001. Figures 4A and B show an example of typical progression of MRI erosions from baseline to year 1.

Serial MRI scans and x rays from patient No 4. (A) Baseline MRI scan (coronal T1 image) showing no erosions. (B) MRI scan at one year (coronal T1 image) shows erosions which have developed at the distal pole of the scaphoid and the adjacent margin of the capitate (wide black arrows). Extensive low signal is seen within the hamate and lunate, consistent with marrow oedema (arrowheads). Note that this slice is more ventral than the baseline slice with slight medial rotation. (C) Baseline posteroanterior (PA) radiograph shows no erosions. (D) One year PA radiograph shows lucency in the distal pole of the scaphoid and the adjacent portion of the capitate at the site of MRI erosions (black arrows). Small erosions are present in the 4th metacarpal base and the triquetrum (arrowheads). (E) Two year PA radiograph shows narrowing of the joint space in the radiocarpal and intercarpal joints. Erosions are profiled in the distal pole of the scaphoid (white arrow). Focal lucent areas are seen in the bases of the 3rd and 4th metacarpal joints and capitate (arrowheads). Sclerosis and lucency are seen in the lunate.

Serial MRI scans and x rays for patient No 40. (A) Baseline MRI (coronal T1 image) shows no erosions. (B) One year MRI (coronal T1 image) shows small erosion at the base of the 5th metacarpal joint (white arrow). (C) Baseline posteroanterior (PA) radiograph shows no profiled erosions. Focal lucency is present at the 5th metacarpal base and at the ulnar styloid (arrowheads). (D) One year PA radiograph shows small erosions at the 5th metacarpal base and ulnar styloid (white arrows). (E) Two year PA radiograph shows progression of erosions at the 5th metacarpal base and ulnar styloid (arrows). Multiple other erosions are seen within the carpus.
Tracking x ray erosions
In the group of 42 patients, 41 had anx ray examination at baseline, 42 at one year, and 40 at two years. Erosions were defined as profiled defects in cortical bone. The term “focal lucencies” was used for lesions without a defined cortical break, possibly representing erosions viewed “en face”. A total of 12 sites with erosions were identified in eight (19%) patients at baseline, increasing to 54 sites at one year and 57 sites at two years, by which time 19/40 (48%) patients had erosions. Examining individual erosions at the three time points available showed that 9/12 (75%) baseline lesions were present at one year and 25/50 (50%) of one year lesions were present at two years. When focal lucencies and erosions were combined together, these percentages were 68% and 51%, respectively. Thus between one quarter and one half of x ray erosions were not identified at the same site, one year later. Figures 4C, D, and E show an example where x ray erosions persisted and progressed over two years in patient No 4, concordant with progression of MRI erosions from baseline to one year shown in figs 4A and B.
If deficiencies in film quality or reader inaccuracy were the main determinant of disappearance, one would expect a number of lesions which had “disappeared” at one year to “reappear” at two years. This did not occur for the small number of lesions identified at baseline but not at one year. However, mostx ray erosions were identified at one or two years and a longer period of follow up would be required to determine whether these were scored consistently.
WHAT IS THE RELATIONSHIP BETWEEN MRI EROSIONS ANDX RAY EROSIONS?
Comparative data were available for MRI scans andx rays at baseline and year 1 and data forx rays alone at year 2. Although our initial patient centred analysis showed that all patients except one with erosions on MRI at baseline remained erosive on MRI at year 1,2 the new “lesion centred” analysis provided more detailed information about the fate of individual lesions. Of those erosion sites identified on MRI at baseline, 8/85 (9%) were scored onx ray examination at baseline, 16/87 (18%) at one year, and 22/84 (26%) at two years. Wherex ray focal lucencies were added to profiled erosions, these figures were 21%, 30%, and 35%, respectively. Of those sites with erosions on MRI at one year, 44/195 (23%) were seen at the same sites on x ray at two years. When focal lucencies were added, this figure increased to 29%. Thus only about one in four lesions identified on MRI were seen one year later at the same site on x ray examination. Figures 5A-E show an example of progression of MRI erosions tox ray erosions. In contrast, an example of non-progression of MRI erosions to x ray erosions is shown in figs 6A-E (patient No 24). Interestingly, this patient was one of those in whom the diagnosis of RA was changed to transient polyarthritis at two years (table 2).
Data were also examined to determine whetherx ray erosions developed at sites where MRI erosions were not seen (at the same time or at an earlier examination, or both). This occurred in 28% of the x ray erosions seen at one year. The same analysis could not be done at two years as no MRI data were available.
To analyse data on the progression of MRI erosions tox ray erosions, patients were grouped into four categories as defined in table 3. Groups 1 and 2 had no MRI erosions or MRI erosions that did not progress tox ray erosions at those sites. Groups 3 and 4 did show evidence of progression of erosions at individual sites from MRI lesions to x ray lesions. Table 4 shows an example of a group 4 patient and corresponds to MRI/x ray sequences for images depicted in fig 4 (patient No 4). Logistic regression was used to determine whether group allocation could be predicted by baseline measures. Patients with a high baseline MRI synovitis score,1 Ritchie score, and erythrocyte sedimentation rate were more likely to be in group 4 at two years (p=0.005, 0.01, and 0.03, respectively). There was also a strong association between group allocation and DMARD usage at one and two years (p=0.01 and p=0.0001, respectively), with all those in group 4 receiving DMARDs at two years compared with 1/9 in group 1. In particular, the progression of MRI erosions tox ray erosions was more common in patients taking methotrexate (p=0.007), presumably reflecting clinical patterns of use in those with the most active disease. However, there was no association between group allocation and carriage of the shared epitope (HLA-DRB*04/01 genotype). Those patients in whom the diagnosis of RA was revised at two years (table 2) were all in groups 1 or 2.
Patients grouped according to progression of magnetic resonance imaging (MRI) to xray erosions after one year
Progression of erosions at sites 1 to 154-150 from baseline magnetic resonance imaging (MRI) scans to year 1 x rays and from year 1 MRI scans to year 2 x ray, in a patient with early rheumatoid arthritis (patient No 4, group 4)
ARE X RAY EROSIONS NOT RECOGNISED BECAUSE OF POOR VISIBILITY AT THE CARPUS?
It was suspected that identifying the progression of MRI erosions to x ray erosions might have been influenced by poor visibility of certain sites on plain radiographs of the carpus. Individual sites were examined to determine whether any were overrepresented. Progression of MRI erosions tox ray erosions was most often seen at site 3 (triquetrum) where 45% of lesions progressed, whereas it was least often found at site 14 (2nd metacarpal base) where only 10% of lesions progressed. Comparison of sites showed no significant difference, but numbers were low, reducing the power of the analysis.
Discussion
As far as we know this is the largest group of patients with early RA in whom MRI and x ray changes at the wrist have been studied prospectively over a two year period. The initial patient centred analysis confirmed previous one year findings from this cohort2 and showed that the total MRI score at baseline is highly predictive of x ray erosions at the carpus at two years. Despite the high sensitivity and specificity achieved for this test, the positive predictive value was low at 67%, implying that one third of patients with a high total score on MRI at baseline (combining erosions, bone oedema, synovitis, and tendonitis) will not develop erosions onx ray at two years. However, the negative predictive value was very high, showing that 9/10 patients with a low initial score will not have erosions at the carpus by two years. Interestingly, baseline clinical measures were not helpful in differentiating those with erosive disease, though a positive rheumatoid factor showed a trend towards an influence on erosion development. Many other studies have shown that patients with high baseline disease activity are more likely to develop erosions in the long term.25-27 The small number of patients in our cohort and relatively short follow up time means that such associations are likely to have been missed. The trend towards an association with a positive rheumatoid factor may be important as this has been one of the most consistent predictors of erosion to be identified.28A follow up period of two years is too short to assess functional outcome in RA, and it is not surprising that the baseline MRI score did not predict HAQ score at two years. This will be reassessed at five years, as the link between joint damage and disability strengthens with disease duration.29 Our finding that the baseline HAQ was strongly predictive of HAQ at two years is consistent with the observations of others and indicates that a functional assessment at disease presentation is essential.30
In a significant proportion of patients with early symmetrical polyarthritis, a non-RA diagnosis is eventually reached.31-33 These patients either have a form of transient self limited polyarthritis or persistent non-RA inflammatory arthritis. We identified five patients from our cohort of 42 (12%), in whom the diagnosis was revised to either transient peripheral inflammatory symmetrical arthritis or probable early systemic lupus erythematosus. When MRI scans from these patients were reviewed, two had erosions, which in one case took the form of rather unusual cystic lesions prominent in the hamate (fig 6). In neither was progression tox ray erosions seen, leaving us to speculate as to the nature of the MRI lesions seen. Transient symmetrical inflammatory arthritis has not been extensively studied by MRI, but Klarlund et al identified five patients with this diagnosis, in whom MRI scans of the MCP and proximal interphalangeal (PIP) joints disclosed synovitis, tendonitis, but no bony erosions.7

Serial MRI scans and x rays for patient No 24 whose diagnosis was revised at two years from RA to transient undifferentiated polyarthritis. (A) Baseline MRI (coronal T1 image) shows bone marrow oedema within the hamate (black arrow). (B) One year MRI (coronal T1 image) shows well defined erosions within the hamate and an erosion in the triquetrum (black arrows). (C) Baseline posteroanterior (PA) radiograph shows no erosions. (D) One year PA radiograph does not show erosions seen on MRI. (E) Two year PA radiograph does not show any erosions.
Scoring of lesions at 15 sites within the carpus on concurrent MRI scans and x rays, has allowed tracking of individual erosions. Most MRI erosions (84%) persisted over the first year of disease when an analysis was used in which one or both radiologists scored the lesion as present. This increased to 100% using a more stringent analysis requiring complete concordance between radiologists. When relevant scans were reviewed by a third observer, it was clear that false positives at baseline were frequently due to areas of poorly defined cortex, often adjacent to localised bone marrow oedema, as shown in figs 3A and B. The area in question was often not well seen on axial scans. Many scans in the baseline series showed florid bone marrow oedema, which seems to be a feature of early rheumatoid disease,1 ,2 ,17 and in most cases this had settled by the time the second scan was performed a year later. Identification of false positives was much easier in retrospect with both scans in series. The initial scoring was performed prospectively, without the other scan to refer to at either time point. Backhauset al had similar difficulties in confirming small erosions at PIP joints in patients with RA and commented that disruption of the cortical plate may be difficult to assess by MRI owing to lack of direct visualisation of cortical structures.6
A further source of potential error when comparing baseline and one year MRI scans relates to slight changes in positioning of the wrist, despite attempts to ensure that this remained identical at both examinations (see “Patients and methods”). An example of this is seen in fig 4 where the image shown for year 1 (4B) is from a slice slightly ventral to the baseline slice (4A) with more medial rotation. Thus an erosion seen on the baseline scan might be missed on the follow up examination, or vice versa.
We observed relentless progression of erosive disease on MRI, with the number of erosion sites in each patient more than doubling over the first year after diagnosis of RA. Unfortunately, funding constraints did not allow further MRI scans of this cohort at the two year time point, but one would expect a steady increase in the numbers of erosions seen. The question of whether MRI erosions can heal remains unanswered from our data. There are no published reports on MRI detection of erosion healing, but radiographic examples have been described associated with disease remission induced by DMARDs.10 ,11 ,34 ,35 As many more erosions are seen on MRI scans than x ray examinations (estimated at a ratio of 7:1)7 in early disease, it is likely that this phenomenon will also be recognised on sequential MRI scans.
The x ray data in this study were more complete, being obtained on three occasions. A proportion ofx ray erosions also disappeared one year after the first observation, and likely explanations include observer error, differences in projection (particularly if the ballcatcher view was omitted), and the possibility of healing. Rau and Harborn, in their report of five cases in which healing of erosions was recorded, noted the common coexistence of degenerative changes such as bony sclerosis and osteophyte formation with recortication of erosions.10Other reports of healing of x ray erosions have come from McCarty and Carrera who observed this in six patients with RA on serial radiography34 and, more recently, from Sokka and Hannonen who described two additional cases.35Studies of anti-tumour necrosis factor α biological agents (published in abstract form only, to date)12-14 have suggested that these agents may be particularly effective in retarding the progression of erosions and quite possibly in promoting healing phenomena. It is to be hoped that MRI and radiography will be employed in future trials, not just to quantify an overall radiological score, but accurately to image individual lesions so that these may be followed over time, allowing healing to be observed.
Finally, we sought to elucidate the relationship between MRI erosions and x ray erosions. Conaghanet al proposed a sequence of progression from early joint synovitis to MRI erosions tox ray erosions.36 Our data support this in part, but only one in four MRI erosions was found to progress to an x ray erosion over a period of one year. Klarlund et al studied this at MCP joints and found MRI to x ray progression at only two of 28 sites over one year.7Interestingly, those patients in our group in whom the greatest degree of progression occurred were those who had the most active disease at baseline as measured clinically and by MRI synovitis scores. This is consistent with other work noting a strong association between MRI synovitis (whether measured by volume estimation or intensity of enhancement post-contrast) and the subsequent development of radiographic erosions.37 ,38
There was no evidence that taking methotrexate between year 1 and year 2 protected patients from such progression; rather, there was a strong positive association between the two, reflecting aggressive clinical management of patients with active disease. Possibly, methotrexate might have retarded progression of erosions in treated patients, but this cohort study was not designed to investigate the effects of DMARDs and there was no matched control group for comparison. It might be expected that MRI erosion tox ray erosion progression would be associated with the shared epitope conferring a predisposition to bony destructive changes.39 We found no such association, but this might reflect a type II error in our relatively small group.
Plain radiography of the wrist is hampered by poor visibility at several sites40 and identification of erosions is notoriously difficult in early RA.41 This might have led to high false positive and false negative rates, possibly explaining why 28% of x ray erosions were neither accompanied by nor preceded by MRI erosions. It should also be remembered that trying to compare a three dimensional imaging modality (MRI) with a two dimensional one (radiography) introduces a significant source of error in itself.
Review of this cohort using x ray and MRI imaging at the five year time point is underway and should help to clarify questions about progression of MRI erosions tox ray erosions, when lesions can be more easily confirmed on serial images.
In summary, MRI of the wrist in early RA may help to predict erosive outcome at that site at two years. The high negative predictive value of this test should allow more accurate identification of patients at low risk for radiographic erosive damage. Our lesion based analysis has shown that most (possibly all) MRI erosions persist during the first year of disease. The increase in MRI number of erosions in each patient over this time is consistent with disease progression. A minority (approximately 25%) of MRI erosions progressed tox ray erosions after one year, suggesting that some MRI lesions may be reversible. However, significant error may have been introduced in attempts to compare the two modalities, and more definitive data await the five year follow up of these patients.
Acknowledgments
The authors wish to acknowledge the assistance of the following clinicians who referred patients for this study: Dr Mike Butler, Dr David Caughey, Dr Nora Lynch, Dr Alan Doube, Dr Hamish Hart, Dr Peter Gow, Dr Raoul Stuart, Dr Terry Macedo, Dr Max Robertson, Dr Roger Reynolds, Dr Bob Grigor. We thank Mrs Ma Wei (technician, Department of Molecular Medicine) who performed HLADRB1*04/01 genotyping. We are also most grateful to technical staff at the Auckland Radiology Group who supervised the MRI scans and, in particular, to Ms Rika Nel who has retrieved data on many occasions.
References
Footnotes
Supported by grants from the Health Research Council of New Zealand, the Arthritis Foundation of New Zealand, the Auckland Medical Research Foundation, Lotteries Health, New Zealand, the Auckland Radiology Group, and Sanofi-Winthrop.