Article Text

Abstract
Objective: The response of rheumatoid arthritis (RA) patients to treatment with neutralising antibodies to tumour necrosis factor α (TNFα) is highly variable. The underlying mechanism for therapy responsiveness is currently unknown. We therefore evaluated the relationship between baseline molecular profiles of synovial tissues from RA patients and the clinical response to treatment with infliximab.
Methods: Synovial biopsies were obtained by arthroscopy from 18 RA patients with active disease (28 joint count Disease Activity Score (DAS28)⩾3.2) before initiation of treatment with infliximab. All patients were on stable methotrexate treatment. Clinical response at 16 weeks was defined as a reduction in DAS28 of ⩾1.2, non-response as reduction in DAS28 <1.2. Large-scale gene expression profiling using microarrays was performed on synovial tissue samples. To identify biological processes in synovial biopsies that could discriminate between responders and non-responders, we performed pathway analysis on the expression profiles.
Results: A total of 12 patients responded to therapy, while 6 patients failed to fulfil the response criteria. We identified several biological processes, related to inflammation, which were up-regulated in patients who responded to therapy, compared to those who did not show clinical improvement.
Conclusion: These results indicate that patients with a high level of tissue inflammation are more likely to benefit from anti-TNFα treatment.
Statistics from Altmetric.com
Rheumatoid arthritis (RA) is a chronic inflammatory disease with a striking heterogeneous clinical presentation and disease course, ranging from mild disease to severe pathology with bone and cartilage destruction. We previously described a marked variability in synovial inflammation among RA patients.1 2 In addition, treatment of RA patients with anti-tumour necrosis factor α (TNFα) antibody therapy results in a variable response.3 Previous studies have indicated that anti-TNFα treatment reduces tissue cellularity, and serum levels of the proinflammatory molecules S100A12 and interleukin 7 (IL-7) in responding RA patients.4–6 However, how the molecular profile in pre-treatment synovial tissue samples relates to the response to anti-TNFα antibody therapy is still unclear. Here, we applied gene expression profiling of synovial biopsies from RA patients before treatment to identify, which biological processes associate with the response to therapy.
PATIENTS AND METHODS
Patients
Synovial tissue was obtained by arthroscopic synovial biopsy from 18 RA patients prior to initiation of anti-TNFα therapy with infliximab (3 mg/kg intravenously at baseline, at week 2, 6, and subsequently every 8 weeks) Consecutive patients with RA according to the American College of Rheumatology (ACR) criteria were enrolled in the study at the outpatient clinic of the Academic Medical Center (AMC) in Amsterdam over a period of 1 year. Inclusion criteria were: 18–85 years of age, a failure of at least two disease-modifying antirheumatic drugs (DMARDs) including methotrexate (MTX), and active disease (28 joint count Disease Activity Score (DAS28)⩾3.2) Patients with a history of an acute inflammatory joint disease of different origin or previous use of a TNF blocking agent were excluded. Patients were on stable maximally tolerable MTX treatment. Responders and non-responders were matched for age, sex and MTX dosage. All patients gave written informed consent and the study protocol was approved by the Medical Ethics Committee (AMC). We determined the responder status by the reduction in DAS28 after 16 weeks of therapy. RA patients with a reduction of the DAS28 of at least 1.2 (twice the measurement error of the DAS28 over time) were defined as responders, representing a clinically significant improvement.7 Patients not reaching this threshold were defined as non-responders.
Sample preparation, labelling and hybridisation
Total RNA was isolated from synovial tissue as described2 and linearly amplified using the Message Amp. aRNA kit (Ambion, Huntingdon, UK). aRNA was labelled with aminoallyl-dUTP during cDNA synthesis, followed by chemical coupling of the aminoallyl group to Cy3 (experimental sample) or Cy5 (common reference sample) Labelled cDNA transcripts were hybridised together on 43K human cDNA microarrays (Stanford University, Palo Alto, California, USA).
Data filtering and analysis
Data were stored and pre-analysed in the Stanford Microarray Database (SMD)8 (available at http://genome-www.stanford.edu/microarray). Data are expressed as log2 ratios of fluorescence intensities of the experimental and the common reference sample. Intensity-dependent normalisation using local estimation (“loess”) was performed separately on each sector of the array. Spots were included in the analysis when in at least 80% of the microarrays a reliable data point was obtained (defined by a regression correlation coefficient R>0.6 for Cy3 and Cy5 pixel intensities, and a signal intensity of 2.5 times the local background for Cy3 and Cy5). The use of a common reference allows comparison of the expression levels across all samples, as described previously.2 We corrected for array batch differences by applying singular value decomposition in SMD as described previously.9 In short, the eigengene reflecting coating differences was removed. Genes represented more than once on the microarrays were averaged from sequences with the same unigene identifier. Genes that differed 1.4-fold in expression between the responders and non-responders were analysed by supervised hierarchical clustering. To visualise the correlation of co-expressed genes we used Treeview (http://rana.lbl.gov/EisenSoftware.htm).
Statistical analysis
To determine which biological processes were represented by the difference in expression levels (fold change) of all genes in responders compared to non-responders, we applied gene ontology analysis in the PANTHER database (http://panther.appliedbiosystems.com).10 The statistical tool utilises the fold change of all genes to define the probability that the functional category distribution (biological processes) was drawn randomly, estimated by the Mann–Whitney U test. A Bonferroni correction was applied to adjust for multiple comparisons. Bonferroni-corrected p values <0.05 were considered significant.
RESULTS
Transcriptome analysis of synovial biopsies prior to anti-TNFα therapy
We analysed the expression profiles of synovial tissues from18 patients with RA prior to treatment with infliximab. The patient characteristics are summarised in table 1. None of the clinical parameters before treatment differed significantly between responders and non-responders.
To identify biological processes that are associated with response to therapy, we calculated the fold difference in transcript levels for all genes between responders and non-responders. Subsequently, we performed a gene ontology analysis in the PANTHER database (see Patients and methods).
This analysis resulted in the identification of nine biological processes that were more actively expressed in the responding patients: immunity and defence, T-cell mediated immunity, cell surface receptor mediated signal transduction, major histocompatibility complex II (MHCII)-mediated immunity, cell adhesion, cytokine and chemokine mediated signalling pathway, cell adhesion-mediated signalling, signal transduction, and macrophage-mediated immunity (table 2). These processes all indicate a higher level of cellularity and inflammatory activity in responding patients, which was confirmed by an increased expression of CD3 and CD163 in the synovial tissues detected by immunohistochemistry (p<0.05; data not shown).
To visualise the transcript expression patterns of synovial tissues, we performed one-way hierarchical clustering. By separating responders and non-responders we could identify genes with a correlated expression pattern in these groups. From the expression of genes shown in fig 1A and the enlarged cluster of inflammation-related genes (fig 1B) it is clear that almost all patients with high transcript levels of inflammation-related genes responded to infliximab. These transcripts included those encoding CD163, S100A8, several Human leukocyte antigen (HLA) class II and immunoglobulin genes, integrins and chemokines, which we previously associated with high inflammatory RA tissues2
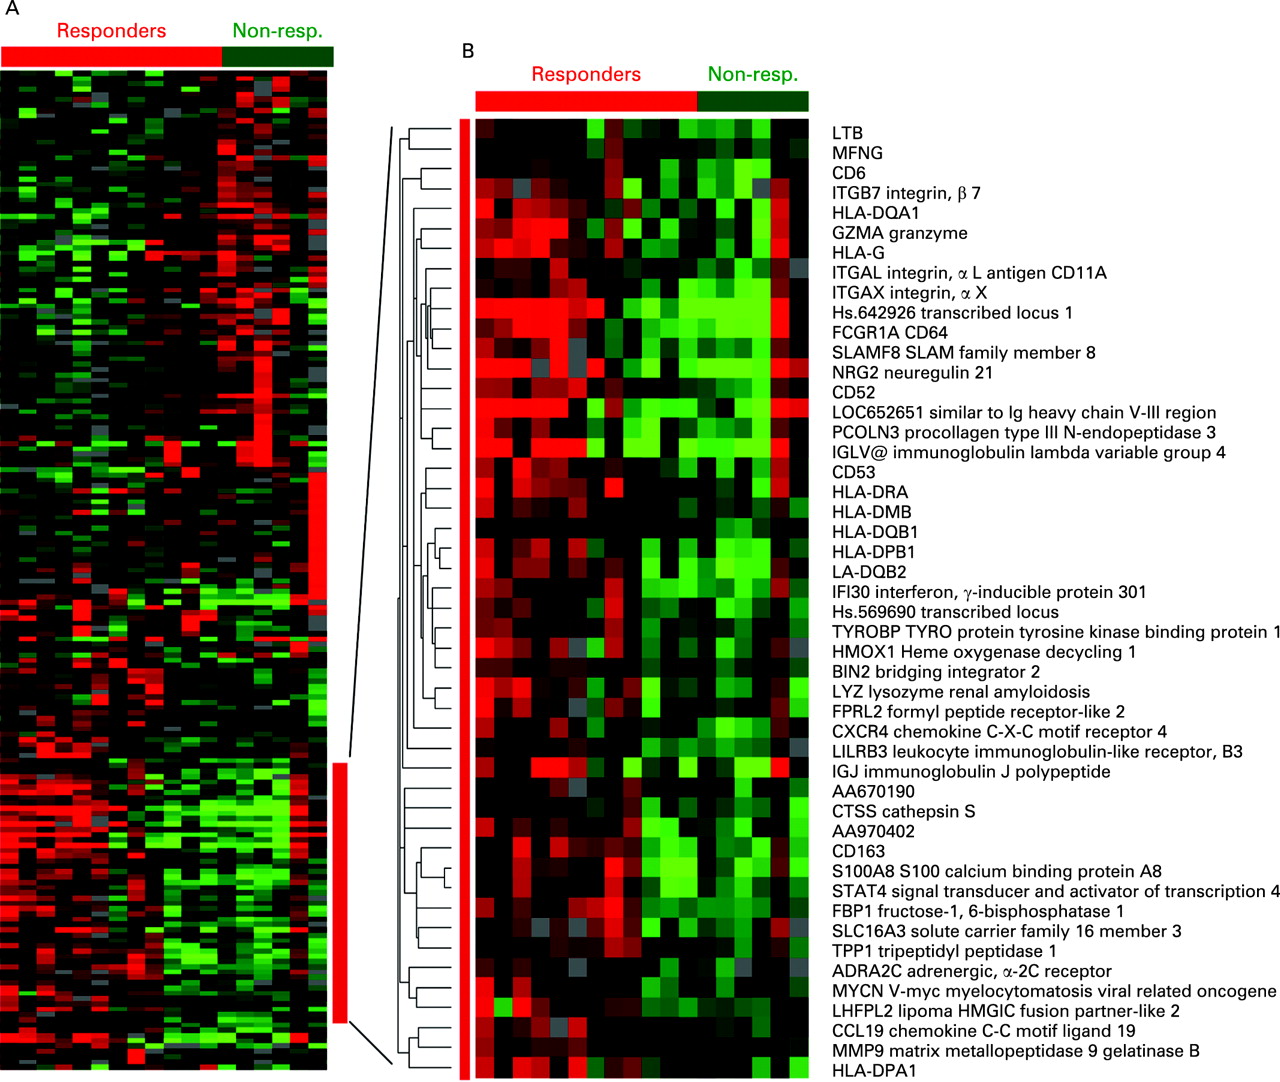
Analysis of transcription factor binding sites
To gain more insight into the differential activation of gene expression in tissues from responders vs non-responders, we performed a search for transcription factor binding sites (TFBS) that are enriched in the regulatory regions of genes expressed at different levels in responders and non-responders. We investigated whether the genes with at least a 1.4-fold increase in expression (86 genes) in the responders overrepresented specific TFBS using rVISTA (http://genome.lbl.gov/vista/index.shtml).11 A search for common TFBS in the 300 base pairs upstream region of these genes resulted in the identification of two members of the Ets family of transcription factors, Elf-1 (p = 10–4.0), and Ets2 (p = 10–3.2).
Using the same criteria, genes with a 1.4-fold lower expression in responders (103 genes) overrepresented TFBS for factors that are not related to inflammation. The most significant factor was Myc-associated zinc finger–related factor (MAZR, p = 10–6.4)
DISCUSSION
In this report we showed that patients who subsequently responded to anti-TNFα therapy showed an increased baseline transcription of genes involved in inflammatory processes, compared to patients not fulfilling the response criteria. This difference between responders and non-responders corresponds with the heterogeneity in expression profiles of RA synovial tissues, which reflects a difference in inflammation-related genes, confirming our previous findings on synovial tissues from patients undergoing surgical joint replacement.2
Recently, the effect of infliximab treatment was analysed by gene expression profiling of synovial tissues from 10 patients. Within a subgroup of four patients that showed pre-treatment positivity of TNFα by immunohistochemistry, treatment with infliximab resulted in reduction of a number of biological processes, ie, immune response, cell communication, signal transduction and chemotaxis.12 In our analysis, we determined that these (and other) processes could be used to distinguish between responders and non-responders already at baseline.
The clinical characteristics show a trend towards higher levels of inflammation markers (C-reactive protein (CRP), rheumatoid factor (RF), DAS) in the responder group. This may be clinically relevant, because the likelihood of achieving remission or low disease activity after treatment decreases with increasing disease activity at baseline.13 However, our results are based on a change in DAS28 of at least 1.2.7 Alternative read-outs relying on end point measurements, eg. remission, might thus provide a different view on responsiveness
One patient did not respond to TNFα blockade, despite a high level of inflammation. It may be anticipated that such patients either require a higher dose of infliximab or that the disease is driven by other pro-inflammatory processes, in addition to, or independent of TNFα.
The identification of the Ets family of transcription factors, overrepresented by genes with a higher expression in responders, is in line with the finding that a high level of inflammation is associated with responsiveness, since Ets2 activation is involved in macrophage survival and pro-inflammatory cytokine production.14 In contrast, genes with a lower expression in responders did not reveal an important contribution of transcription factors associated with inflammation. Instead, we identified enriched binding sites for MAZR, also known as PATZ. The activity of this transcription factor is associated with transcriptional repression, and may therefore be responsible for the low expression of genes harbouring a MAZR-binding site in responding patients.15
This study indicates that different processes are at play in responding vs non-responding patients, suggesting that the pathology may be driven by distinct mechanisms.
REFERENCES
Footnotes
Funding: This study was supported by a grant from The Netherlands Organization for Health Research and Development (ZonMw) in assignment of The Netherlands Organization for Scientific Research (NWO) (grant number 945-02-029), the European Community’s FP6 funding (Autocure), and the Innovation Oriented research Program (IOP) on Genomics and Centre for Medical Systems Biology (a centre of excellence approved by The Netherlands Genomics Initiative/Netherlands Organization for Scientific Research). This publication reflects only the authors’ views. The European Community is not liable for any use that may be made of the information herein.
Competing interests: None.