Article Text

Abstract
Objective: To compare the performance of a simplified scoring method for structural damage on radiographs of patients with rheumatoid arthritis (the Simple Erosion Narrowing Score or SENS) with the Sharp–van der Heijde Score (SHS) as reference.
Method: We used the radiographic data from the Trial of Etanercept and Methotrexate with Radiographic Patient Outcomes (TEMPO trial). The SENS was derived from the crude SHS data. Inter-observer reliability for status scores and change scores was determined by intraclass correlation coefficients and by the Smallest Detectable Change method. The ability to discriminate between treatment groups was assessed by the Mann–Whitney U test. Stratifying the sensitivity to change and discriminative ability for different levels of disease severity assessed a potential ceiling effect.
Results: Inter-observer reliability was similar for both methods. Intraclass correlation coefficients were higher for status scores than for change scores. The Smallest Detectable Change was 4.98 (1.1% of possible maximum score) for SHS and 2.28 (3.5%) for SENS. Sensitivity of SENS to detect progression above the Smallest Detectable Change, with reference SHS, ranged from 45.0 to 88.7%. Specificity ranged from 81.5 to 97.3%, and the κ coefficient (between-method agreement) ranged from 0.58 to 0.66. Discriminative ability between treatment groups was good and similar for both methods. A ceiling effect could not be detected.
Conclusions: With regard to most of the tested properties, the performance of SENS is as good as that of SHS. This confirms that SENS is a valuable method, which may be feasible in clinical practice.
Statistics from Altmetric.com
Rheumatoid arthritis (RA) is an autoimmune-mediated disease characterised by chronic inflammation of synovial joints, causing damage in cartilage and periarticular bone and subsequent destruction of these joints. Progression of joint damage as assessed on radiographic films is strongly associated with inflammatory activity and functional disability.1–3 Radiographic damage and its progression can therefore be used as a measure of the severity of RA at a specific time, the course of RA and the responsiveness of RA to therapy for short- or long-term duration.4
Many scoring methods were designed for the assessment of radiographic damage. The most commonly used methods are the Sharp method, one of its modifications being the Sharp–van der Heijde scoring (SHS) method, and the Larsen method with modifications.4 5 All these methods require trained readers to obtain sufficient reliability,4 6 making them difficult to use in clinical practice. Sharp and SHS methods are comprehensive (provide several types of information about each joint), an additional disadvantage for their use in clinical practice. Effective drugs for the treatment of RA that may stop radiographic progression necessitate the development of feasible methods that assess structural damage in clinical practice.
Previously, we have proposed and tested a simplification of the SHS method, the Simplified Erosion Narrowing Score (SENS).7 The SENS method is less time consuming and less comprehensive than the scoring methods described above, and is easier to teach and learn. It assesses erosions and joint space narrowing (JSN) in the same joints as SHS. However, instead of grading erosions and JSN for severity, SENS only acknowledges the presence (1 point) or absence (zero points) of erosions and JSN separately.
We have reported previously that SENS was as reliable and sensitive to change as SHS in a small set of patients with up to 6 years of disease duration. A potential shortcoming of SENS is that it detects only the first erosion or narrowing per joint; it does not take into account an increase in the numbers or the severity of erosions or JSN per joint. We have shown in the context of the Combinatietherapie Bij Reumatoide Artritis (Combination Therapy in Rheumatoid Arthritis, COBRA) trial that indeed progression in eroded joints makes an important contribution to the progression score.8 As such, SENS could potentially be prone to a ceiling effect. The objective of the present work was to test the performance of SENS in terms of reliability, sensitivity to change, and the ability to discriminate between treatment groups, in comparison with SHS in a large group of patients with a considerable variation in disease duration and severity of the disease. We also investigated whether a ceiling effect plays a part in the performance of SENS.
PATIENTS AND METHODS
Patients
In this work we used the data from a double-blind, randomised, clinical trial (TEMPO trial)9 in which three treatment groups (methotrexate (MTX), etanercept (ETAN) and the combination of both (MTX+ETAN)) were compared for clinical and radiographic efficacy in 680 patients of the 682 included in the clinical trial (see below, Readers). The disease duration ranged from 14 weeks to 26.4 years (mean 6.6 years) in this subset.
Readers
Radiographs of the hands, wrists and feet taken at baseline and 52-week follow-up were used for this analysis. The digitised radiographs were read in pairs with unknown sequence. Each set was scored twice by two readers from a pool of three trained readers, meaning that every reader scored two-thirds of all the radiographs. Data from two readers were used in the analysis, which implies that a random third of the total patient population was available for inter-reader reliability analyses, and two-thirds of the total patient population for the comparison of SENS and SHS.
Radiographic scoring methods
Structural damage as seen on radiographs was assessed by the SHS method. The SHS method10 assesses joint erosions and JSN. Joint erosions are scored in 32 joints in the hands and wrists and 12 joints in the feet. Erosion scores per joint can range from 0 to 5 in the hands and wrists and from 0 to 10 in the feet. JSN is scored in 30 joints in the hands and wrists and in 12 joints in the feet. JSN scores per joint range from 0 to 4 in hands, wrists and feet. The maximum total erosion score (the sum of all joint scores for erosion) is 280 and the maximum JSN score (the sum of all joint scores for JSN) is 168. The total score is the summed score of the total erosion and total JSN score, and has a maximum of 448.
The SENS method7 assesses the same joints. It scores 1 point for each joint when showing at least one eroded location and also 1 point if JSN is present. In fact, the number of eroded joints and the number of narrowed joints are scored. Consequently the maximum total erosion score is 44, the maximum total JSN score is 42 and the maximum total score is 86.
For the purpose of this study, we derived the SENS data from the SHS. A score of 1 or more in SHS was substituted for a 1 in SENS. A 0 in SHS remained a 0 in SENS.
Statistical analysis
Reliability
The inter-observer reliability was assessed by the intraclass correlation coefficient (ICC; absolute agreement, two-way mixed model) per scoring method, for status scores at baseline and 52 weeks separately, and for change scores. Only joints scored by both readers and at both time points (ie, excluding missing values) were used to calculate the total score per patient.
The Smallest Detectable Change (SDC) was applied as a second method of reliability.11 The advantage of the SDC is that it is reflected in the units of the measurement scale. The SDC reflects the measurement error due to inter-observer variability. The SDC was calculated according to Bruynesteyn et al,11 as follows:

SDdiff is the standard deviation of the set of differences in change scores obtained by two readers, k is the number of readers whose change scores are used (here: k = 1 as the SDC on the scores of each reader separately was used), according to which each change score laying within these limits of agreement is considered to be a consequence of measurement error.
Sensitivity to change
With SHS as a gold standard, we used the SDCs obtained with SHS and SENS as cut-off values in order to determine if a change can be explained by measurement error alone, and to compare the sensitivity and specificity of the SENS method. In addition, in order to test whether patients were consistently classified as “progressing” or “not progressing” across both methods, we used κ statistics to determine the level of agreement. Subsequently, we determined optimal cut-off levels for SHS and SENS using receiver operating characteristic (ROC) curves: different values for change in SHS were tested, and the optimal cut-off value was chosen as showing the best combination of highest area under ROC curve, sensitivity and specificity. Because we were only interested in the performance of SENS in relation to SHS in detecting change we excluded the patients with no change according to the SHS method.
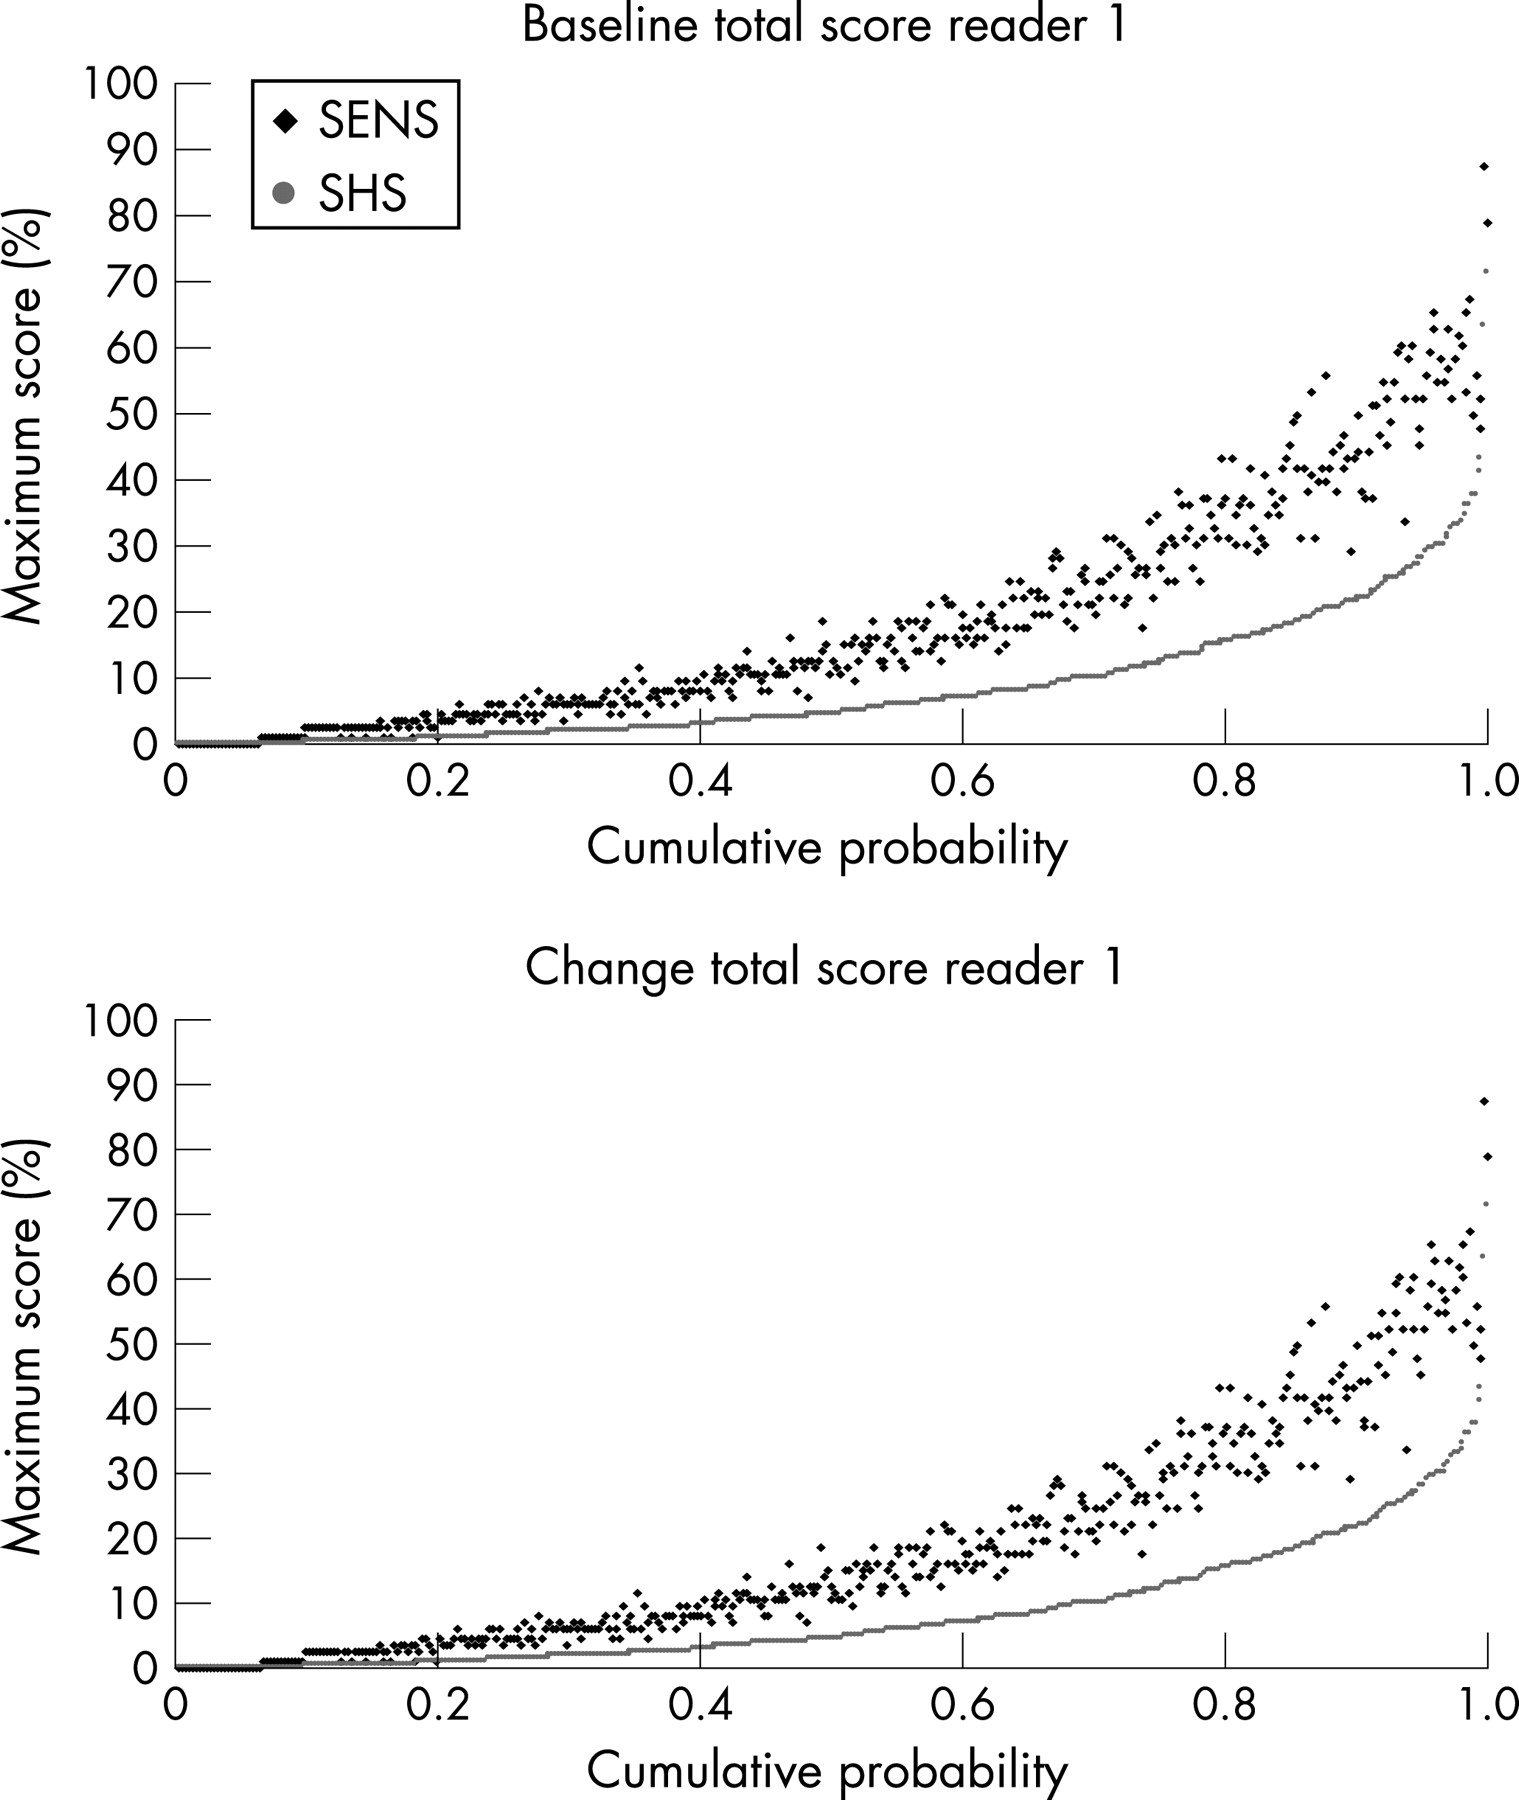
Cumulative probability plots12 of status and change scores, per method and per reader were drawn to visualise the relationship between SHS and SENS and to detect possible individual outliers.
Discrimination between treatment groups
Discriminative ability for differentiating between treatment groups was assessed by calculating the Mann–Whitney U test comparing the change in total scores in the groups treated with MTX and with MTX+ETAN.
Ceiling effect
To assess a possible ceiling effect we determined the sensitivity to change and discriminative ability by different levels of disease severity. This was achieved by stratifying the patient population in quartiles based on the increasing baseline radiographic SHS scores.
RESULTS
Table 1 describes the observed scores per reader, per scoring method for status and 52-week change scores. The patient population scored by reader 1 only partially overlapped the patient population scored by reader 2. Consequently, only comparison of SHS and SENS scores per reader but not comparison of absolute values between readers, is informative.
Figure 1 presents the scores of SHS and SENS expressed as a percentage of the maximum possible score of the respective methods. The SHS scores are plotted from the lowest to the highest value against their cumulative probability. Each value of SHS corresponds to the SENS value of the same patient. Because damaged joints can only be scored in a dichotomous manner by SENS, while the degree of erosion and JSN can be better substantiated by SHS, the plot of the status score shows that for each case SENS is higher than SHS if expressed as the percentage of the maximum possible total score. The plot of the change scores visualises the positive and negative changes. It also shows that a change in SENS is almost never negative when SHS change is positive, and vice versa.
Reliability
The between-reader ICCs at baseline and 52 weeks were 0.81 and 0.77 for SHS and 0.91 and 0.89 for SENS, respectively. The ICCs for change were 0.30 for SHS and 0.22 for SENS. Probability plots with the scores of readers 1 and 2 plotted together showed no systematic differences (probability plot with the scores of reader 2 are not shown). The SDCs were calculated by using the set of overlapping data of readers 1 and 2 (n = 181). The SDC for SHS was 4.98 units (which is 1.12% of the maximum score) and for SENS 2.28 units (which is 3.49% of the maximum score).
Sensitivity to change
ROC-based optimal cut-off levels were 2 units for SHS and 1 unit for SENS for the scores of reader 1, and 3 units for SHS and 1 unit for SENS for reader 2. Similarly, optimal cut-off levels for negative change scores were determined: They were–5 units for SHS and–1 unit for SENS for reader 1, and–2 units for SHS and–1 unit for SENS for reader 2.
Table 2 compares the performance of both methods with respect to showing change or no change, as based on the different cut-off levels. The data show that for both readers, either based on the SDC or on the optimal ROC-based cut-off levels, the performance of the SHS and the SENS is approximately similar with respect to the proportion of patients with change.
Table 3 presents the sensitivity, specificity and agreement of the SENS method compared with the SHS method (gold standard).
Discrimination
Both the SENS and the SHS total scores discriminated between the MTX group and the MTX+ETAN group (p<0.001 for both methods performed by both readers). After stratification into quartiles based on SHS score at baseline, discrimination between MTX and combination therapy remained similar in all quartiles for both methods.
Ceiling effect
Table 4 presents the sensitivity, specificity and κ-statistics of SENS calculated with the cut-off levels based on ROC analysis. The sensitivity of SENS by reader 1 decreased with an increasing level of the baseline score, but the sensitivity of SENS by reader 2 showed the opposite trend. We saw the same difference in the sensitivity to change analysis between reader 1 and 2 for different levels based on increasing disease duration or increasing annual progression rate (data not shown).
DISCUSSION
This work was intended to evaluate the usefulness of the SENS method in accurately measuring radiographic damage and progression in patients with RA. In order to do so, we measured important “psychometric characteristics” such as inter-reader reliability, sensitivity to change and discriminatory ability, and compared with the actual standard of measuring radiographic damage and progression in clinical trials, the SHS method. This comparison aimed at confirming a comparable performance of the more feasible SENS in the evaluation of structural damage and progression. Indeed, SENS does not require specific training (recognition of usual abnormalities caused by RA is sufficient) and is far less time-consuming than other methods applied in clinical trials, which additionally require semi-quantitative evaluation of the extent of lesions. A routine application by every practitioner could consequently be conceivable in clinical practice, provided that a gain in feasibility is not at the cost of a loss in validity.
First, the reliability of SENS, as tested between the two independent readers, was very good for status scores, and even better than the more comprehensive SHS method. The reliability of measuring change scores, however, was unexpectedly low for both methods. An artefact may be that patients studied in the present analysis took part in a clinical trial with very effective drugs and consequently a very low rate of progression, while the first report about the SENS method by van der Heijde et al,7 as well as a later comparison of five scoring methods—including SHS and SENS—by Guillemin et al13 included patients with substantial radiographic progression. Indeed, patients selected for the initial validation of the SENS had early but rapidly progressing RA, and were assessed after 5 or 10 years of follow-up. Guillemin et al selected radiographs from a survey conducted in the nineties, when drugs of major structural efficacy (such as the tumour necrosis factor blockers) were not yet available. The ICC, which is a measure of relative agreement, is sensitive to relatively subtle inter-reader discrepancies if the total range of observed change scores is narrow, and becomes less sensitive to such discrepancies if the total range of change scores is wide.14 So the low ICCs are probably reflecting the small range of change scores with many patients showing no change rather than real poor inter-reader reliability. This view is further supported by the fact that a completely independent reread of the data during the read of the second year TEMPO trial fully confirmed the results of the data of the first read, used in the present analysis.15
Secondly, concerning sensitivity to change of SENS when compared with SHS, the results were also comparable across both methods: Taking a cut-off level that accounts for measurement error (SDC), a comparable proportion of patients were scored as “progressing” across both methods and readers, with an acceptable rate of concordance between SENS and SHS. This observation was not dependent on the value of the cut-off level for “true progression”: Regardless of whether the cut-off level was based on inter-reader reliability (SDC method) or on statistical arguments (ROC analysis), the performance of both methods was similar.
Thirdly, the discriminatory ability for discerning structural change in patients treated with MTX versus MTX+ETAN was high and comparable for both methods. It is arguable, however, whether the high treatment contrast observed in the TEMPO trial provides the best context to seriously challenge the discriminatory ability of both methods. It is reasonable to assume that if treatment contrast is lower, SHS will outperform SENS because SHS values new abnormalities as well as worsening of existing abnormalities while SENS only quantifies new abnormalities. It has been shown in the COBRA trial that indeed the addition of the number and size of the erosions improved discriminative validity.8
Another important issue is the absence of a clear ceiling effect. Indeed, because the number of potentially affected joints that are scored is limited in RA, one could theoretically achieve the maximal value relatively early in the course of the disease, and the consequence of this would be a decreased sensitivity to change in patients with longer disease duration and a lot of structural damage already present. However, although no definite conclusion can be made from our data, the opposite trends that were observed for readers 1 and 2 when sensitivity to change was compared in different groups of patients based on the SHS score at baseline leads us to the conclusion that a systematic tendency is unlikely.
Potential limitations of this work are related to the origin of the database we used. Because the radiographs were obtained from patients included in a clinical trial comparing highly efficient drugs, during a short time period and scored by trained readers, several potential weaknesses may be raised. The database includes a high proportion of patients with no progression at all or low progression rates. This hinders the use of statistical analyses that are based on a Gaussian distribution, such as the ICCs, especially when change scores are evaluated. On the other hand, both methods were hindered by these unfavourable conditions, and it is the comparison between the methods in which we are really interested.
Another limitation of the results is that we derived the SENS scores directly from the SHS scores. One could argue that this may increase the agreement between the two methods in an artificial manner. However, if we would have used an independent read for the SENS we would have ended up with data comparing SHS with SENS but it would not have been possible to disentangle variation caused by intrareader variation from differences between the methods. Besides, it was previously shown that discrepancies between derived SENS (like here) and independently obtained SENS were rare (6.2% at the joint level).7 Information that is still needed is the repeatability of results if SENS is applied in practice by clinicians.
In summary, we were able to demonstrate in a large database that SENS was at least as reliable, sensitive to change and discriminatory as SHS, even in this context of a short-term clinical trial comparing very efficient drugs, and when the time sequence of the images scored were not known. As SENS is more feasible, less time-consuming and less sensitive to reader interpretations, while having similar psychometric properties, it should be considered for use in clinical practice.
REFERENCES
Footnotes
Competing interests: None.