Article Text

Abstract
Background: Osteoarthritis (OA) of the hand could be a relevant model to study the progression of OA in structure-modification trials. Various methods are proposed to assess hand OA and its progression radiologically.
Objective: To compare intra-reader and inter-reader precision and sensitivity to change of four radiological scoring methods proposed in hand OA.
Methods: 2 trained readers scored separately 105 pairs of radiographs (baseline; year 1), selected from patients enrolled in a randomised controlled trial, for inter-reader reliability and sensitivity to change. They scored twice 60 pairs among the 105 for cross-sectional and longitudinal intra-reader reliability. Radiological hand OA assessment used: global, Kellgren–Lawrence (KL), Kallman and Verbruggen scoring methods. Inter- and intra-reader reliabilities were studied using intraclass coefficient (ICC) and the Bland–Altman method. Sensitivity to change was compared by calculating the standardised response means.
Results: Transversal intra-reader reproducibility ICCs ranged from 0.922 to 0.999. Verbruggen ranked the highest, followed by the KL and Kallman methods. Inter-rater reliability was higher for the Verbruggen scores, followed by the KL, global and Kallman scores (ICC 0.706–0.999). Longitudinal intra-reader reliability (baseline; year 1) was better using the Kallman and KL (ICC 0.986 and 0.990), followed by the Verbruggen (0.941) or global methods (0.939). Standardised response means ranged from 0.24 (KL) to 0.29 (Kallman).
Conclusion: All four methods compared well with respect to reliabilities. However, the Verbruggen and Kallman methods performed better. The method most sensitive to change was the Kallman method, followed by Verbruggen and global scores. This study also suggests that structural changes could be detected in hand OA over a 1-year period.
- FIHOA, Functional Index for Hand OA
- ICC, intraclass coefficient of correlation
- JS, joint space
- KL, Kellgren–Lawrence
- M12, month 12
- OA, osteoarthritis
- SDD, smallest detectable difference
- SRM, standardised response mean
Statistics from Altmetric.com
- FIHOA, Functional Index for Hand OA
- ICC, intraclass coefficient of correlation
- JS, joint space
- KL, Kellgren–Lawrence
- M12, month 12
- OA, osteoarthritis
- SDD, smallest detectable difference
- SRM, standardised response mean
Osteoarthritis (OA) is the most common rheumatic disease, and is becoming a major problem of public health with the ageing of the population in developed countries.1 OA of the hand is very common. Its prevalence and incidence vary with the definition used. Most studies used the radiographic definition described by Kellgren and Lawrence.2 When this case definition was used hand OA was identified in 67% of women and 55% of men in the Rotterdam Study,3 a population-based cohort (age ⩾55 years).
Hand OA could represent a valuable model to evaluate structure-modifying treatments in OA. Various methods have been proposed to assess the radiological severity of hand OA and to score the progression of damage over time.2,4,5,6,7,8,9,10,11,12,13,14 Additionally, atlases have been published to help reduce differences in interpretation of the OA grade between observers.15–17 Indeed, particularly the KL method allows a wide range of interpretations for each grade,18,19 reducing interobserver reliability. However, the most important issue to consider is the intraobserver reliability, determinant to calculate the smallest detectable difference (SDD)20 and accounting considerably for the sensitivity to change.
The methods proposed differ by (1) the number of hand joints scored; (2) the radiographical features scored: osteophytes, joint space (JS) narrowing, subchondral bone sclerosis, bone cysts, erosion and deformity; (3) the respective importance attributed to each radiological feature in the score; (4) the way of scoring: semiquantitative scoring or global estimate of a qualitative stage of OA (ie, “erosive” or “remodelling” stage in the Verbruggen score17–19) and (5) the summation. In addition, the way these scales have been published is not standardised and does not permit direct cross-comparisons between them through publications. Information is therefore missing regarding the intrinsic and comparative metrological qualities of these scales.
The aim of our study was to compare in the same sample of patients the precision and sensitivity to change of four radiographic scoring methods proposed to assess the severity and progression of structural changes in hand OA.
PATIENTS AND METHODS
Source of patients
Hand radiographs were obtained from patients included in a randomised, 1-year prospective, multicentre, double-blind, placebo-controlled symptom-modification trial in hand OA. The study had been approved by the ethics review board of the Pitié-Salpêtrière Hospital (Paris, France). Patients were outpatients with symptoms of hand OA (according to the American College of Rheumatology criteria21), aged 45–75 years, who gave their written consent to participate in the trial before their enrolment. The level of global pain in the hands during the previous 24 h and functional impairment (using the Functional Index for Hand OA (FIHOA)22) were assessed at baseline. The minimum symptoms required at entry were a pain level ⩾35 mm on a 100 mm visual analogue scale and an FIHOA score ⩾5 (range 0 to 30).
Selection of radiographs
Pairs of radiographs of 105 patients obtained at baseline and month 12 (M12) were selected at random from among the radiographs of all included patients.
Radiographic techniques
Since the trial from which radiographs were extracted was not a structure-modification trial, no particular specification was given in the protocol as to how to perform hand radiographs. The only recommendation was to obtain an anteroposterior view of both hands on the same film. Radiographs could be either plain or digitalised images and could vary in size. After verification, baseline and M12 radiographs were obtained in the same way for a single patient in 90% of the cases (ie, same magnification). Patient’s radiation exposure was very low (<0.01 milliSievert (equivalent to <0.5 chest x ray).
Blinding process for radiographs
Radiographs were identified by the randomisation number allocated to the patient at study entry. A letter (A or B) was randomly assigned to code the time sequence (baseline or M12) on radiographs. Therefore, each radiograph was identified by a letter and a number. The two coded films available for each patient were gathered in an envelope.
Reading procedures
Two trained readers (CC, EM) performed the scorings separately. They were unaware of the patient’s identity, drug assignment, time sequence of the radiographs and each other’s measurement. Before starting the readings, they underwent two training sessions together on the same radiographs to identify discrepancies and inconsistencies with respect to each scoring method and to try to reduce their disagreement.
Each radiograph was scored according to four methods (see below). Radiographs were read on a horizontally positioned light box to facilitate the scoring of each hand joint. In some cases, to help to assess specific difficult radiographic features, it was agreed between the two readers to use a magnifying glass. Radiographs were read in pairs: the two views corresponding to each patient were read at the same time. Radiographs were read in sessions of 30 radiographs (representing 15 pairs, during each session). Therefore, seven sessions were used for the first reading. If necessary, a break was planned during each session so as not to exceed more than two consecutive hours of reading. For the assessment of cross-sectional and longitudinal intraobserver reliability, 60 pairs of radiographs (baseline–M12) were selected at random from among the 105 pairs read initially. These sets of radiographs were read a second time, with a minimum time interval of 30 days between first and second readings. Altogether, 330 radiographs were scored using the four scoring methods by each of the two readers. Readings were performed over a 4-month period.
Radiological scoring methods
The four methods compared are listed in table 1, with the numbers and sites of hand joints examined for each. Radiographs were scored according to:
Number of hand joints and sites assessed by each of the four compared radiological scoring methods, general results of the scorings at baseline (normalised values) and time to perform each method
1. A global scoring, during which the reader had to decide whether the joint assessed was osteoarthritic or not (yes/no).9 A total of 32 joints were assessed (range 0–32).
2. KL grading,2 as specified by the authors in their atlas.15 We took into account the modifications suggested by Kellgren-Lawrence themselves, reproduced by Lane13 and discussed by Spector.18,19 Briefly, each of the 30 joints examined was scored from 0 to 4, according to the presence and size of osteophyte(s) and according to JS narrowing: 0, no OA; 1, doubtful OA; 2, definite minimal OA; 3, moderate OA and 4, severe OA. The score ranges from 0 to 120.
3. Kallman radiographic scale (initially validated by scoring left hands in a cohort of men),5,6 where 24 joints (all, but the metacarpophalangeal joints) are scored for six radiographical features according to a seminumerical scale: osteophytes (0–3), JS narrowing (0–3), subchondral bone sclerosis (0–1), subchondral bone cysts (0–1), lateral bony deviation (⩾15°; 0–1) and bone erosion (0–1). The score ranges from 0 to 208.
4. Verbruggen numerical scoring systems for the anatomical evolution of OA of the finger joints.10–12 We used the anatomical grading scale proposed by Verbruggen, the only one allowing cross-sectional comparison with other semiquantitative radiographic grading systems. The score ranges from 0 to 218.4. Of note, thumb base joints (scapho-trapezial and trapezio-metacarpal) are not considered in this score (table 1).
Statistical analysis
The following data were recorded at baseline for the 105 patients from whom radiographs had been selected: age, gender, weight, height, mean disease duration, handedness, patterns of joint involvement with respect to the most painful joint at entry, pain level on a visual analogue scale, FIHOA score22 and radiographic scores.
The ease of use was assessed by the mean time (min) taken to perform each scoring method.
To compare reliabilities and responsiveness of the scores, as they have very different ranges (and since it is known that ICCs increase with the variability of a sample), we decided to normalise the individual scores by the maximal value obtained during the readings. The maximal values recorded were 28 for the global score, 75 for the KL, 123 for the Kallman and 108.7 for the Verbruggen scores. Data were normalised by these values, then multiplied by 100 to obtain scores ranging from 0 to 100.
Reproducibility of the four radiological scoring methods evaluated by intraobserver and interobserver reproducibilities was assessed using the ICC23 and the Bland–Altman plotting method,24 which allows the calculation of the SDD20 (ie, the amount of detectable change above the random measurement error). SDDs were calculated for both interobserver and intraobserver reliability according to a previously described method.20 Estimates of ICC were derived in the framework of a two-way fixed effect model. 95% CIs were estimated by the method described by Shrout and Fleiss.25 Differences between readers (interobserver reliability) and between readings (intraobserver reliability) were calculated using the Bland and Altman approach.
Sensitivity to change of each radiographic scoring method was estimated on the basis of differences in each score between M12 and M0 using the standardised response mean (SRM = mean change /SD of change). The 95% CIs of SRM estimates were calculated using the jackknife technique.26 All statistical analyses were performed using software SAS V.6.12.
RESULTS
Table 2 shows the descriptive clinical data of the 105 patients whose radiographs were selected. Table 1 provides the general results of the readings for each scoring method and for each observer.
Baseline characteristics of the 105 patients whose radiographs were selected for the study
Ease of use
The mean time used to perform each scoring method is also given in table 1. The Kallman method was the most time-consuming, while the global and Verbruggen scorings were the most rapid to perform.
Interobserver reproducibility
ICC values and their 95% CI on baseline scorings and on the scorings of changes between baseline and M12, mean differences on baseline scorings (SD) and SDD are provided for each method in table 3.
Cross-sectional (on baseline measurements) and longitudinal (on baseline–M12 changes measurements) interobserver and intraobserver reproducibilities of the four scoring methods, using intra-class coefficient of correlation and the Bland–Altman approach
ICC values were 0.859 for global score, 0.951 for KL, 0.706 for Kallman and 0.996 for Verbruggen, exhibiting a good inter-observer reproducibility for all scores. However, Verbruggen and Kellgren scores rated the best.
The Bland and Altman plotting method results for interobserver reproducibility of scorings at baseline and measurements of change between baseline and M12 by reader 2 appear in figs 1 and 2, respectively, for the four scoring methods.
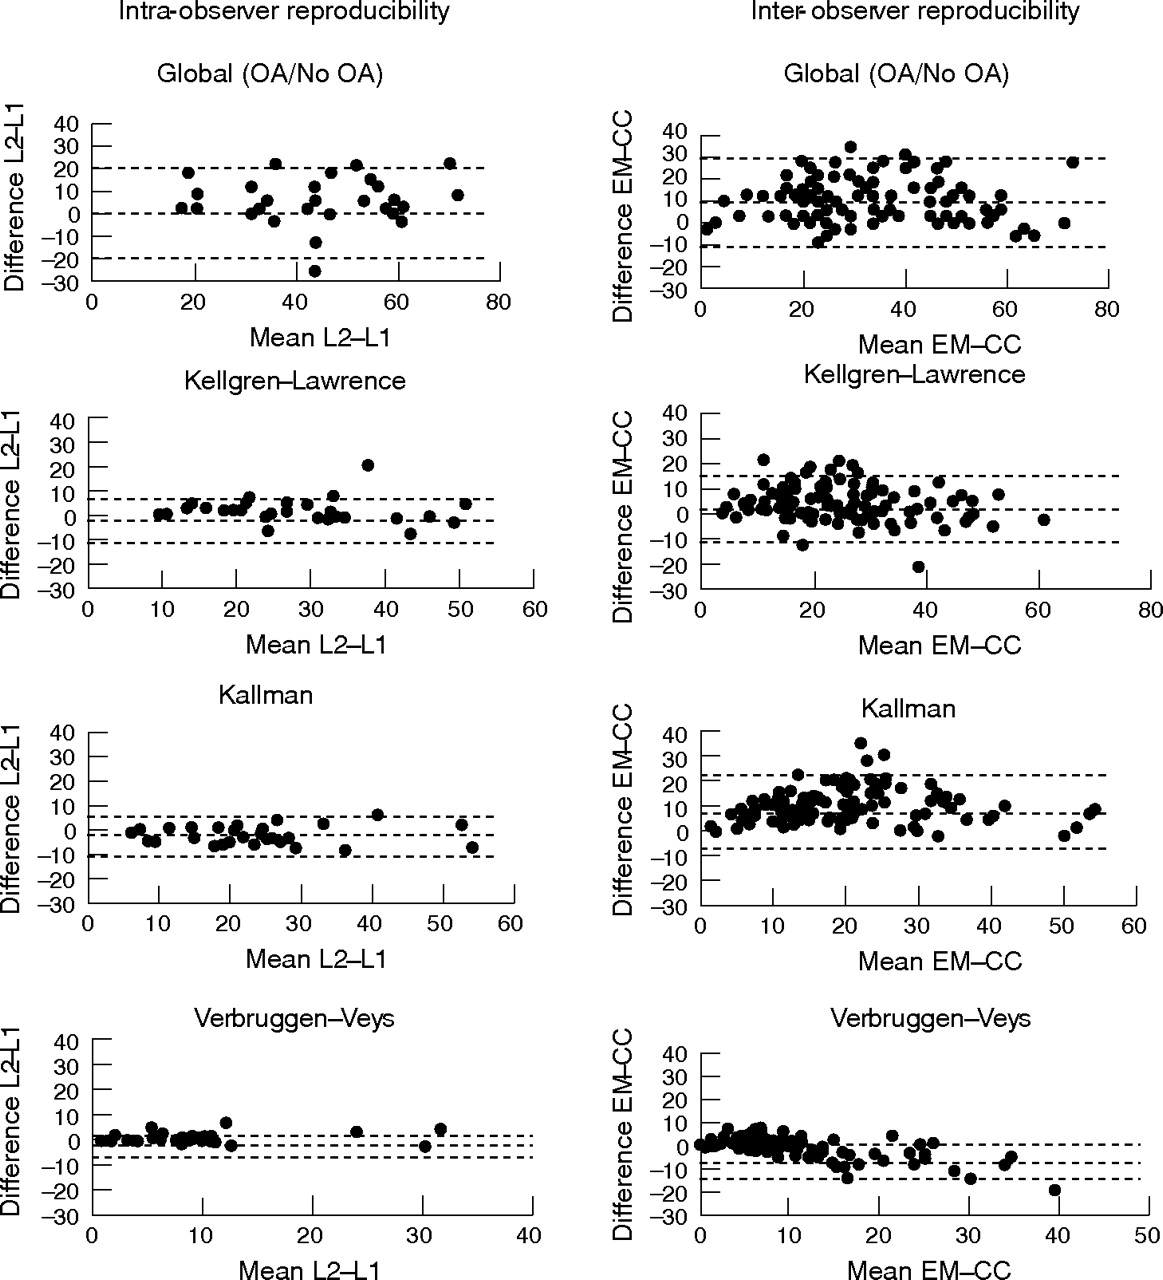
Cross-sectional intra-observer and inter-observer precision for the four scoring methods (baseline measurements). In all, 105 inter-observer radiographs were taken at baseline, and 60 radiographs read twice at a 30-day interval for intra-observer reliability (results of reader 2). Bland and Altman plotting method. In abscissa are the mean of the two scorings (intra-observer reliability) or the mean of both readers (inter-observer reliability). Ordinates are the differences between scorings for intra-observer reliability and differences between readers for inter-observer reliability.

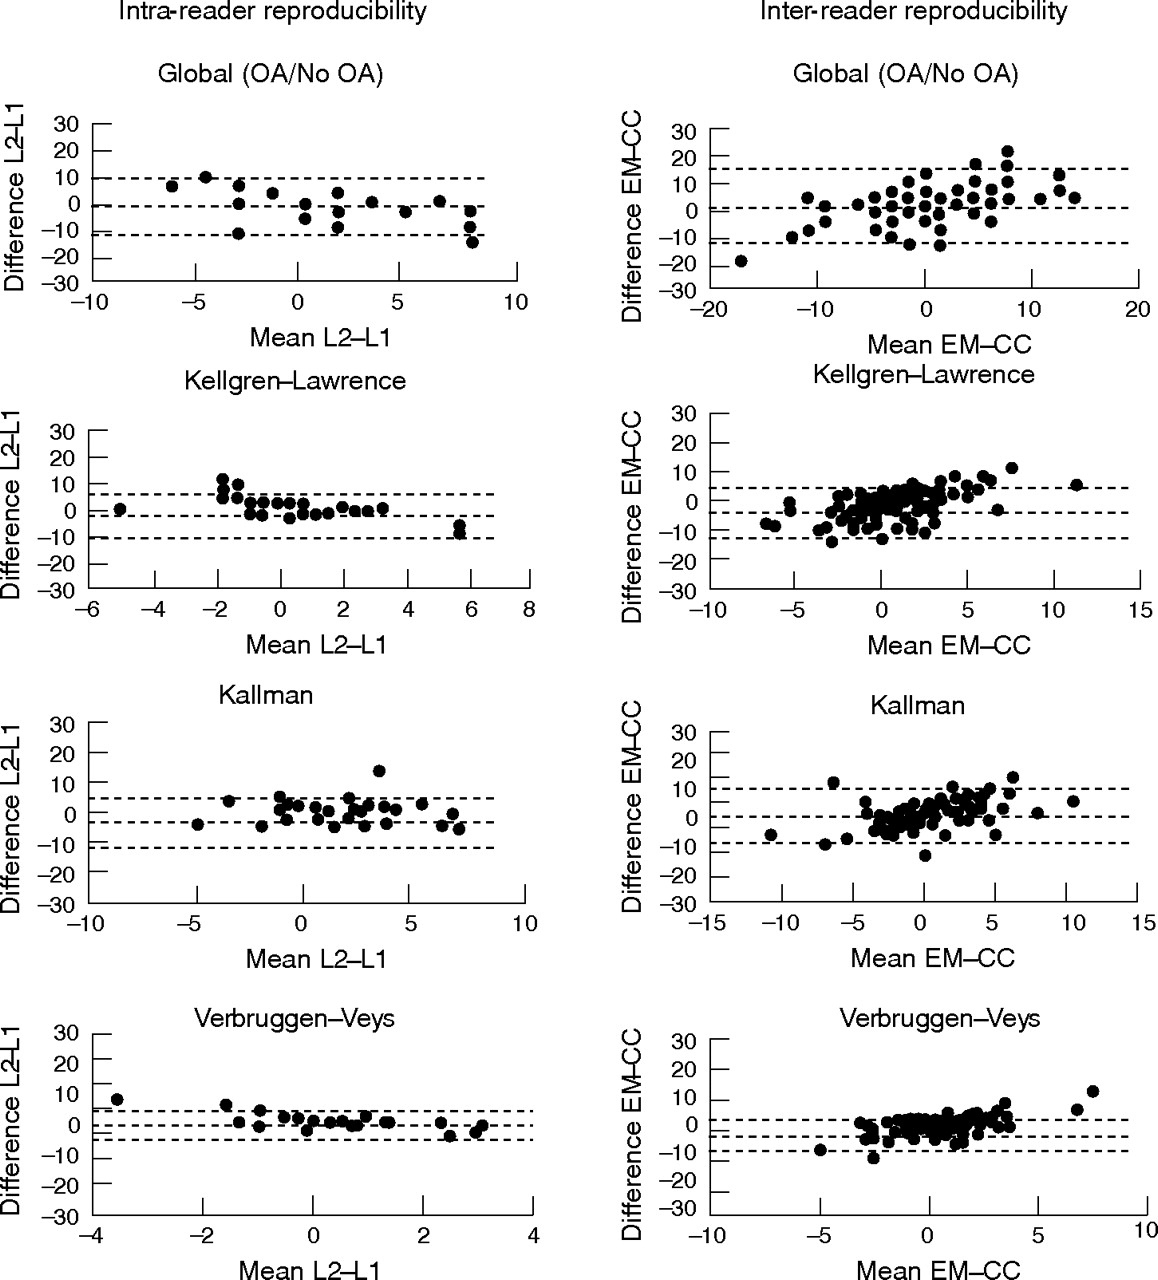
Longitudinal intra-observer and inter-observer precision for the four scoring methods (M0–M12 measurements). A total of 105 sets of two radiographs taken at baseline and year 1 were read once for inter-observer reliability, and 60 pairs of radiographs read twice at a 30-day interval for intra-observer reliability(results of reader 2). Bland and Altman plotting method. The abscissa values are the means of the two scorings (intra-observer reliability) or the mean of both readers (inter-observer reliability). Ordinates are the differences between scorings for intra-observer reliability and differences between readers for inter-observer reliability.
Intraobserver reproducibility
Cross-sectional intraobserver reproducibility of scorings performed on baseline radiographs
ICC, mean (SD) differences between repeated measurements of baseline radiographs and SDD are indicated in table 3 for each reader and each grading scale. ICC values (95% CI) were very high for both readers, whatever the scoring method used, ranging from 0.922 to 0.999. The lowest ICC was obtained by both readers with the global assessment.
The Bland and Altman plotting method results for intraobserver reproducibility of scorings at baseline by reader 2 appear in fig 1 for the four scoring methods.
Longitudinal intraobserver reproducibility of scorings on baseline and M12 radiographs
ICC, mean (SD) differences between repeated scorings of changes between M12 and baseline radiographs, and SDD are also given in table 3 for each reader and each grading scale.
The Bland and Altman plotting method results for intra-observer reproducibility of the scorings of changes between M12 and baseline by reader 2 appear in fig 2 for the four scoring methods.
ICC values (95% CI) were also very high for each observer and all four methods, as shown in table 3, ranging from 0.939 to 0.998. Again, the lowest rate was obtained for the global assessment, and the highest for the KL scoring method.
Both readers showed very good precision, as assessed by the ICC. Reader 2 was more reliable for Verbruggen and global scoring, as assessed by both ICC and the Bland–Altman graphics, whereas reader 1 was more reliable for Kallman scoring (data not shown). Both exhibited the same high level of precision with respect to the KL method.
Sensitivity to change over time
The SRM values were moderate, ranging from 0.24 (KL scoring method—reader 2) to 0.29 (Kallman scoring method—reader 2), as shown in table 4. The estimate of the precision of the SRM calculated was performed using the jackknife technique: 95% CI jackknife SRM are given in table 4. According to the values calculated in this study, the four studied scoring methods could be considered sensitive over a period of time as short as 1 year. Reader 2 was a little more sensitive to change than reader 1 for Kellgren, Verbruggen and global scoring methods (data not shown for reader 1). Kallman seemed a little more responsive for both readers (data not shown for reader 1).
Sensitivity to change calculated using the standardised response mean (SRM) obtained by both readers for each of the four scoring methods and 95% CI jackknife SRM
DISCUSSION
We report the results of the first study performed to compare four radiological scoring methods in hand OA. All four scales performed well with respect to inter-, intraobserver reliability and sensitivity to change over a short period of time (1 year). The Verbruggen and Kallman scales performed better with respect to reliability. The Kallman method was slightly more sensitive to change.
Hand OA could be an interesting model to study structure-modifying therapeutics. In addition, assessing hand OA could be of interest to predict further incident hip or knee OA, as shown recently.27 However, these issues require a valid and reliable tool to assess the severity and progression over time of hand OA on radiographs.
None of the proposed radiological scales,4,5,6,7,8,9,10,11,12,13,14 have, as yet, proved to be better than another: there has been no direct cross-comparison to assess their reliability and responsiveness.28
This study allowed the evaluation of the metrological properties (ie, simplicity of use, validity, reliability, sensitivity to change and discriminant capacity) of the four scales compared: global assessment, KL, Kallman and Verbruggen. It was carried out on a large sample of radiographs from 105 patients, representative of all stages of the disease. Only two studies previously examined the precision of radiological scoring methods in hand OA: a semiquantitative global assessment (four-grade scale) was compared with a dichotomous global scale (OA: yes/no) by Dougados.9 The global assessment exhibited a higher intraobserver precision than the four-grade scale. Hart et al29 compared KL grading with an assessment of JS and osteophyte on a four-point scale, and found that all three methods performed well with respect to both inter-reliability and intra-reliability, the latter rating being better.
The quality of the radiographs did not seem to interfere greatly with the scoring, with the exception of subchondral sclerosis assessment, which requires well-defined radiographs—that is, not too overexposed. Scoring digitised or plain films did not seem to modify the quality of assessment, as reported previously.30,31
The global and the Verbruggen scoring methods were less time-consuming (1.5–1.6 min to perform). Cross-sectional and longitudinal interobserver reproducibilities were good for all methods, using ICCs. Both readers exhibited a good intraobserver precision, on baseline radiographs and on changes between baseline and year one. Kallman and Verbruggen scorings were slightly better for the cross-sectional study and assessment of changes (responsiveness). The Kallman method might have shown a better responsiveness, because it assesses six radiological signs. However, it may perform better without some assessments likely to create a background noise (cysts and subchondral sclerosis, for instance). The Verbruggen score, despite it being a global scale, performed well with respect to reliability, but was a little less responsive than the Kallman method. This could be explained by the weight of the “remodelling” phase, which is a final phase unlikely to change over time. For cross-sectional epidemiological studies of the prevalence of hand OA in a population, KL and Verbruggen methods performed better than the global and Kallman methods.
We used the scores as published by their authors, but some modifications could help to increase their precision. Additionally, these methods should be compared for the same patterns of digital joints. How the scales perform when only distal interphalangeal and proximal interphalangeal joints are scored (excluding thumb base joints and metacarpophalangeal joints) remains unknown, as is unknown how the Kallman method performs if cysts and subchondral sclerosis assessments are deleted. The performances of the Kallman and Verbruggen scores modified in this way should be explored through further studies. Furthermore, it must be noted that according to the progression of hand OA described by Verbruggen, the remodelling (R) phase represents the most severe and final stage, whereas if scored according to Kallman, the same joint might exhibit an improvement of OA with a JS widening.
Using the Bland and Altman approach allowed the calculation of the SDD, which is based on the measurement error and corresponds to the minimal amount of progression that can be reliably distinguished from random error measurement. It allows calculation of cut-off points for the definition of progression. Our study provides data to calculate such cut-off points that could be used in future structure-modification trials.
There are some limitations to this study: we did not assess discrepancies to identify how each radiological feature accounted for these discrepancies (ie, osteophyte, JS narrowing, subchondral sclerosis or cysts, erosion or lateral deviation assessment). Despite two preliminary training and discussion sessions regarding the scoring of each radiological sign, it was not possible to completely reduce the interpretation of the observer. For instance, what is a “definite” or a “moderate” osteophyte, or a “possible narrowing of joint space at one point”, as indicated by Kellgren and Lawrence in their description?2,15 This has already been discussed by Spector.18 Using published atlases15–17 did not help to adjudicate discrepancies during preliminary training. Therefore, we decided not to use atlases. Since these methods do not include any quantification of the radiological signs examined, each observer had to set his own rules to obtain a score. The time interval of 1 year between the two radiographs for each patient was short. However, our study showed that trained readers identify radiological changes over such a short period of time in hand OA. Structure-modification trials are usually conducted over longer periods of time (2 or 3 years). It is likely that over such periods, the responsiveness of the four methods (SRM) will be better than that reported in our study.
In summary, all methods exhibited high intraobserver reliability. Although our results seem to favour Kallman (reliability, responsiveness) and Verbruggen (reliability, simplicity to use) scales, the magnitude of the differences between the scales did not strongly discriminate between the methods. The SRMs calculated in our study were very close for all four methods. Studies over a longer period of time, using either original or modified Kallman, Kellgren or Verbruggen scales, are needed to assess further which method should be considered the most reliable and responsive, and therefore be recommended to assess hand OA progression in structure-modification studies or trials.
Acknowledgments
We thank Dr Philippe Coste and Expanscience Laboratories for providing the data, radiographs taken during the trial, material assistance and financial support to carry out this project.
REFERENCES
Footnotes
-
Published Online First 9 November 2006
-
CC performed the readings and contributed significantly to the protocol development, data analysis and manuscript revision. SG checked the database and performed the statistical analysis. PR participated significantly in devising the protocol of the radiographic study, planned and monitored the statistical analysis. MD participated significantly in devising the protocol of the study and in the analysis of data. He contributed to the manuscript writing and its revision. EM wrote the protocol of the trial and that of this study with MD and PR, performed the readings with CC, contributed to data analysis and wrote the manuscript.
-
Competing interests: None.