Article Text

Abstract
OBJECTIVE Sacroiliitis is a hallmark of the spondyloarthropathies (SpA). The degree of inflammation can be quantified by magnetic resonance imaging (MRI). The aim of this study was to further elucidate the pathogenesis of SpA by quantitative cellular analysis of immunostained sacroiliac biopsy specimens and to compare these findings with the degree of enhancement in the sacroiliac joints (SJ) as detected by dynamic MRI.
METHODS The degree of acute sacroiliitis detected by MRI after intravenous administration of gadolinium-DTPA was quantitatively assessed by calculating the enhancement observed in the SJ and chronic changes were graded as described in 32 patients with ankylosing spondylitis (n=18), undifferentiated SpA (n=12) and psoriatic arthritis (n=2). Back pain was graded on a visual analogue scale (VAS, 0–10) and disease duration (DD) was assessed. Shortly after MRI, SJ of patients with VAS > 5 were biopsied guided by computed tomography. Immunohistological examination was performed using the APAAP technique; only whole sections > 3 mm were counted.
RESULTS By MRI, chronic changes ⩽ grade II were detected in nine patients (group I, DD 2.5 (SD 2.9) years) and > II in 13 patients (group II, DD 7.3 (SD 4.8) years), while enhancement < 70% was found in eight (group A, DD 5.6 (SD 3.3) years) and > 70% in 12 patients (group B, DD 4.7 (SD 5.8) years). The relative percentage of cartilage (78–93%), bone (7–18%) and proliferating connective tissue (1–4%) was comparable between the groups (range). There were more inflammatory cells in group I compared with group II (mean (SD) 26.7(20.1) versus 5.3 (5.2), p=0.04) and group A compared with B (21.8 (17.3) versus 6.0 (5.6), p=0.05) cells/10 mm2), T cells (10.9 (8.5)) being slightly more frequent than macrophages (9.6 (16.8/10 mm2)). Clusters of proliferating fibroblasts were seen in three and new vessel formation in seven cases.
CONCLUSION This study shows that T cells and macrophages are the most frequent cells in early and active sacroiliitis in SpA. The correlation of cellularity and MRI enhancement provides further evidence for the role of dynamic MRI to detect early sacroiliitis.
Statistics from Altmetric.com
The sacroiliac joints (SJ) are centrally involved in ankylosing spondylitis (AS) and other spondyloarthroapthies (SpA).1 The SpA are among the most frequent inflammatory rheumatic diseases.2 The pathogenesis has not been elucidated to date.3 The degree of activity and chronicity of sacroiliac inflammation can be detected by magnetic resonance imaging (MRI) of the SJ as reported by us and others.4-7However, these results have not been formally confirmed by histological analyses. The number of studies on histology of sacroiliac inflammation in SpA has remained rather limited for decades,8-10because the access to the SJ is difficult.1 However, we have recently introduced the technique of computed tomography (CT) guided sacroiliac biopsy performed in combination with anti-inflammatory intra-articular treatment6 for immunohistological analysis of a limited number of SpA patients with sacroiliitis.11
Here, we went on to directly compare both techniques by quantitative analysis to correlate the results of MRI and histological examination and hereby learn more about the pathogenesis of SpA.
Methods
PATIENTS
All 32 SpA patients had at least grade 5 inflammatory back pain (IBP, see below) on a visual analogue scale (VAS) despite NSAID treatment and underwent MRI of the sacroiliac joints and CT guided sacroiliac biopsy after informed consent. Every sacroiliac biopsy was combined with an intra-articular injection of 40 mg Triamcinolonacetonide as described.6 The study was approved by the Ethical Committee of the Charité University Clinic.
The characteristics of the AS and uSpA patients whose biopsy specimens were suitable for evaluation are shown in table 1.
Patient characteristics
STUDY DESIGN
The ESSG criteria and the modified New York criteria were used to diagnose AS12 and uSpA.13 The patients graded their IBP14 on a VAS (0–10) as described.4
MRIs of the sacroiliac joints (SIJ) were performed as recently described.2 Briefly, a 1.5 Tesla Magnetom (Vision, Siemens, Germany) was used to examine the patients in the supine position. Paraxial sections parallel to the cranial part of the sacrum were used in all sequences. Initially T1 weighted fast spinecho-sequences (TR: 500 ms, TE: 10 ms, slice thickness 4 mm, 2 acquisitions, matrix 360 × 512, 100% oversampling) and then T2* weighted gradientecho-sequences FLASH in opposed phase technique (30° Flipangle; TR: 350 ms, TE: 12 ms, slice thickness 4 mm, 2 acquisitions, matrix 256 × 256, 100% oversampling) were performed. Additional fat suppression was unnecessary because short tau inversions recovery (STIR) sequences were used. The STIR sequence (TR: 4000 ms, TE: 60 ms, TI: 150 ms, slice thickness 4 mm, 1 acquisition, matrix 242 × 256, 100% oversampling) is especially suitable to detect oedematous and inflammatory areas in tissues.
The dynamic examinations were performed in single section technique after application of the contrast agent Gadolinium-DTPA (0.1 mmol/kg body weight) intravenously injected (eight repetitions, one precontrast, seven postcontrast) using T1 weighted gradientecho-sequence FLASH in opposed phase technique (70° Flipangle; TR: 50 ms, TE: 7 ms, slice thickness 5 mm, two acquisitions, matrix 256 × 256, 100% oversampling) through the middle of the synovial part of the SIJ. The calculation of the enhancement factor (Fenh) was done as follows: (a) subtraction of the first native image from the last image of the dynamic examination to visualise areas of enhancement; (b) marking of circular ROIs (regions of interest) in the joint space, in the region of the joint capsule and in the periarticular bone marrow; (c) calculating the maximal percentage of enhancement of both SIJ, of the joint capsule and of the periarticular bone marrow; for further details see Bollow et al.5 The grading of the MRI results was done using an activity and chronicity index recently proposed6 (table2).
MRI grading system for acute and chronic sacroiliac inflammation
CT guided sacroiliac biopsy was performed as described.6 ,11 A 1.4 mm ostycut biopsy needle was used. The needle position was always controlled by CT. The radiation exposure was limited by using only 2–3 thick 8 mm sections for orientation.
Histological examination was performed by conventional haematoxylin and eosin and Goldner staining. Immunohistological examination was performed by the APAAP technique as described.11Antibodies against leucocytes (CD45), T cells (CD3), macrophages (CD68) and B cells (CD20) were used (Dako, Denmark), the secondary antibodies were purchased from Dianova (Hamburg, Germany).
The results were systematically quantified by counting the whole specimens. Only sections > 3 mm were counted. The relative percentage of bone, cartilage and connective tissue was assessed.
Results
Twenty two of 32 specimens were suitable for histological evaluation (68.8%). There was no clinical difference between the 12 AS patients in whom histological examinations could be performed and the six where this was not possible. The same was for the nine and three uSpA patients and the two PsA patients.
By MRI, chronic changes ⩽ grade II were detected in nine (group I, disease duration (DD) 2.5 (SD 2.9) years) and > II in 13 patients (group II, DD 7.3 (SD 4.8) years), while enhancement < 70% was found in eight (group A, DD 5.6 (SD 3.3( years) and > 70% in 12 patients (group B, DD 4.7 (SD 5.8 years), see table 3. In two patients no gadolinium was given because of the wish of the patient.
Comparison of the patients according to the activity and chronicity of sacroiliitis
Six of nine patients with chronic changes ⩽ grade II had activity grade B (66.7%) and three grade A. Six of 11 patients with chronic changes > grade II had activity grade B (54.5%) and five grade A.
The difference in DD between grade I and grade II was significant (p=0.02).
The relative percentage of cartilage (78%–93%), bone (7%–18%) and proliferating connective tissue (1%–4%) was comparable between the groups (range). In general, the characteristic proliferative connective tissue was found more often and more intense in patients with active SI and short DD, while calcification and ossification was more often and more severely found in longstanding disease.
There were more inflammatory cells in grade I compared with grade II (26.7 (SD 20.1) versus 5.3 (SD 5.2), p=0.02) and grade A compared with B (21.8 (SD 17.3) versus 6.0 (SD 5.6), p=0.05) cells/10 mm2), T cells (10.9 (8.5) being slightly more frequent than macrophages (9.6 (16.8/10 mm2)); this difference was insignificant. See figure 1 for details concerning the other cell types examined.
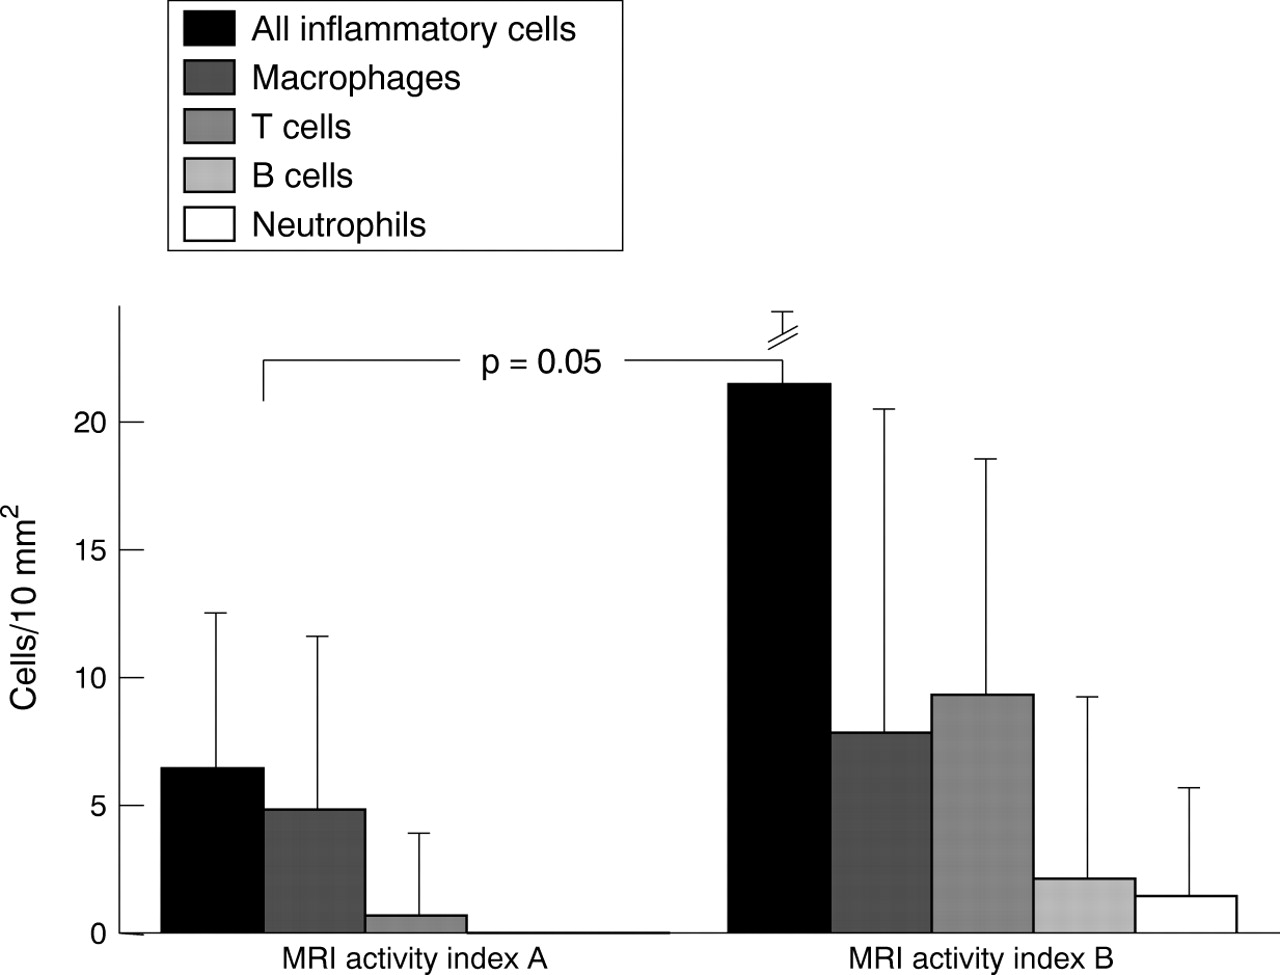
Detailed comparison of relative cell counts of sacroiliac biopsies between patients with different degrees of enhancement in MRI.
Six examples of a direct comparison between the imaging findings and the histological results are given in figures 2 to 7. The first three cases (figs 2 to 4) are examples of acute sacroiliitis with none to moderate chronic changes demonstrated by MRI while by (immuno)histological examination cellular infiltrates and signs of cartilage destruction predominate. The second three cases (figs 5 to7) are examples with both, acute and chronic sacroiliitis documented by MRI in which (immuno)histological examination also shows, partly sparse, infiltrates together with signs of calcification and new bone formation. Clusters of proliferating fibroblasts were seen in three cases (fig 4). New blood vessel formation was seen in seven patients with active sacroiliitis.
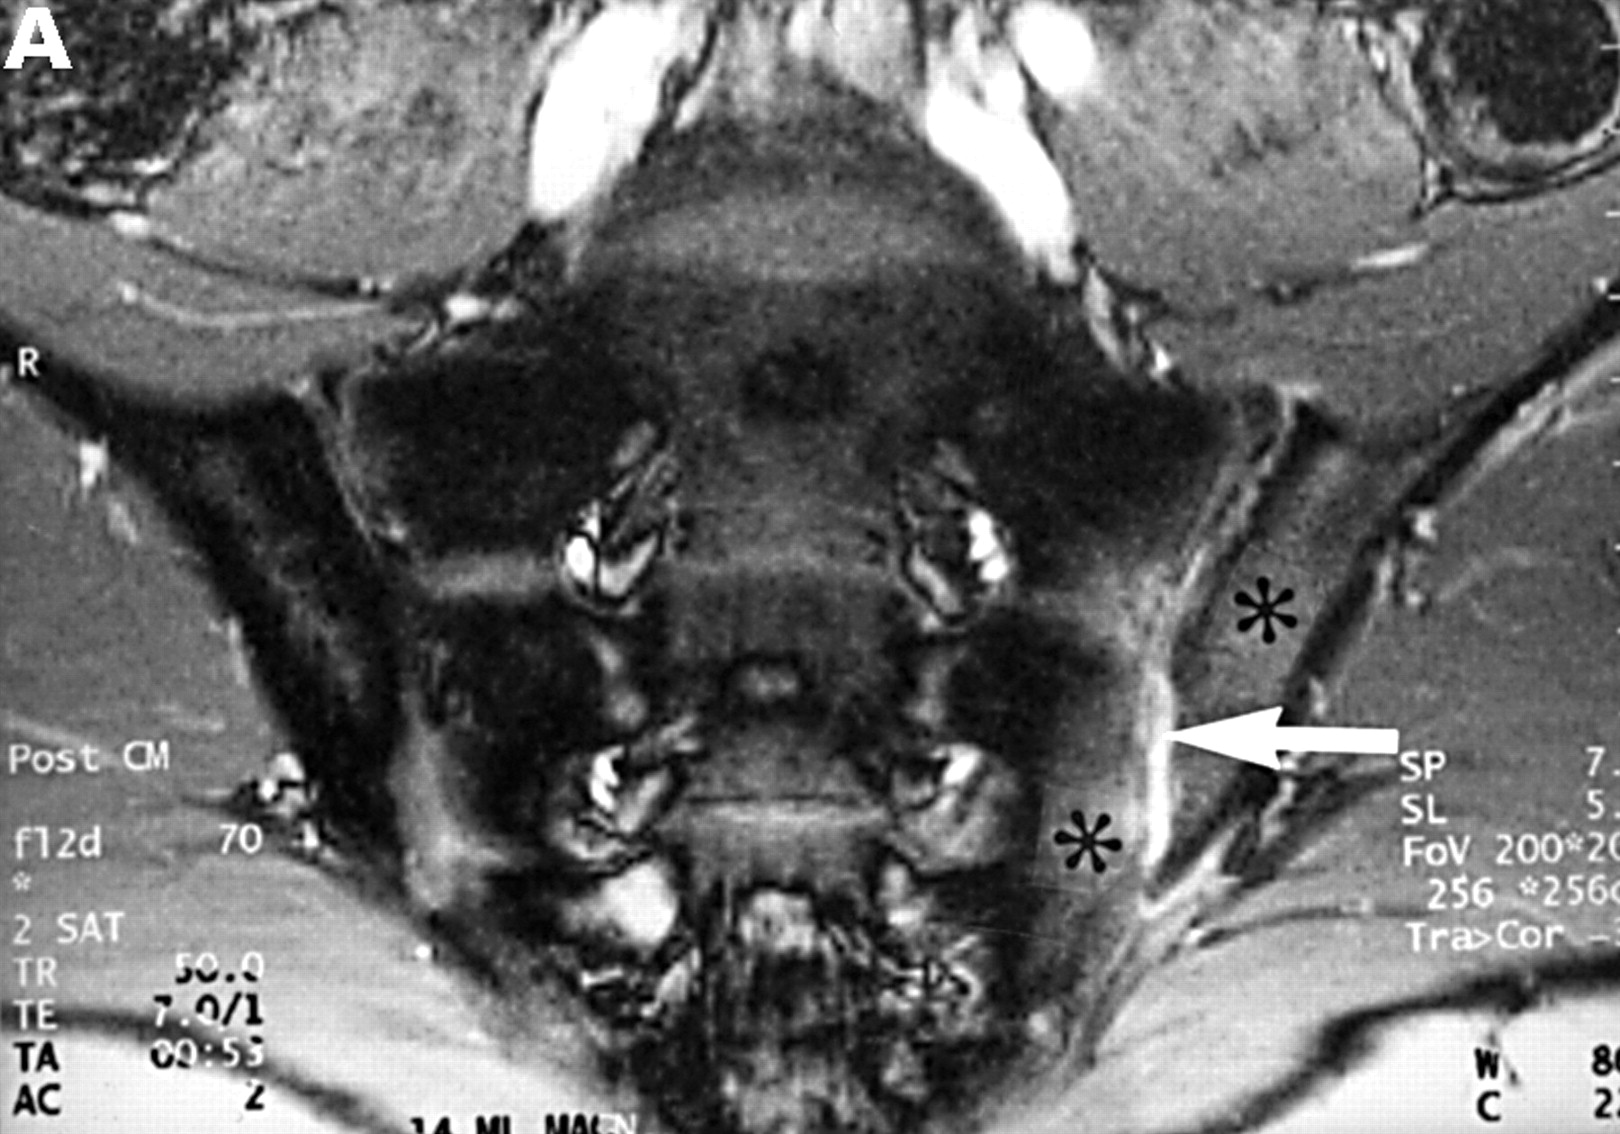

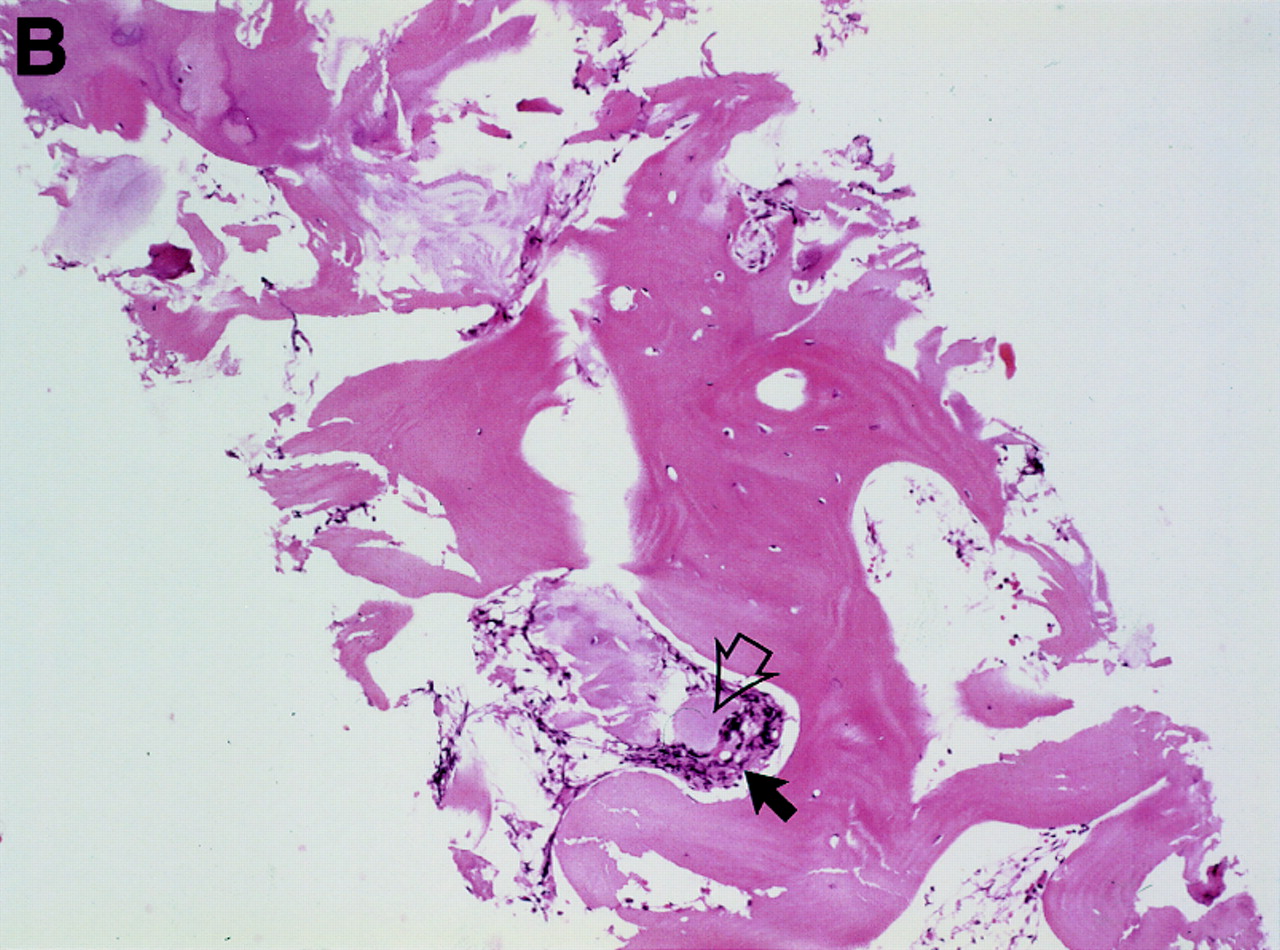
MRI and SJ biopsy specimen of a 16 year old HLA B27+ uSpA patient with unilateral IBP located in the left buttock. (A) T1 weighted gradient echo sequence five minutes after application of gadolinium-DTPA showing some chronic changes and definite acute changes mainly in the left SJ (arrow) and in the periarticular left bone marrow (asterisk) (grade Ix right and Ib left). (B) The biopsy specimen shows a cellular infiltrate containing activated fibroblasts and CD45+ lymphocytes (white arrows) that seem to invade a degenerate cartilagineous area (black arrows). In the middle areas of calcification and bone formation (open black arrows), (immunohistology/haematoxylin and eosin staining, original magnification × 400).

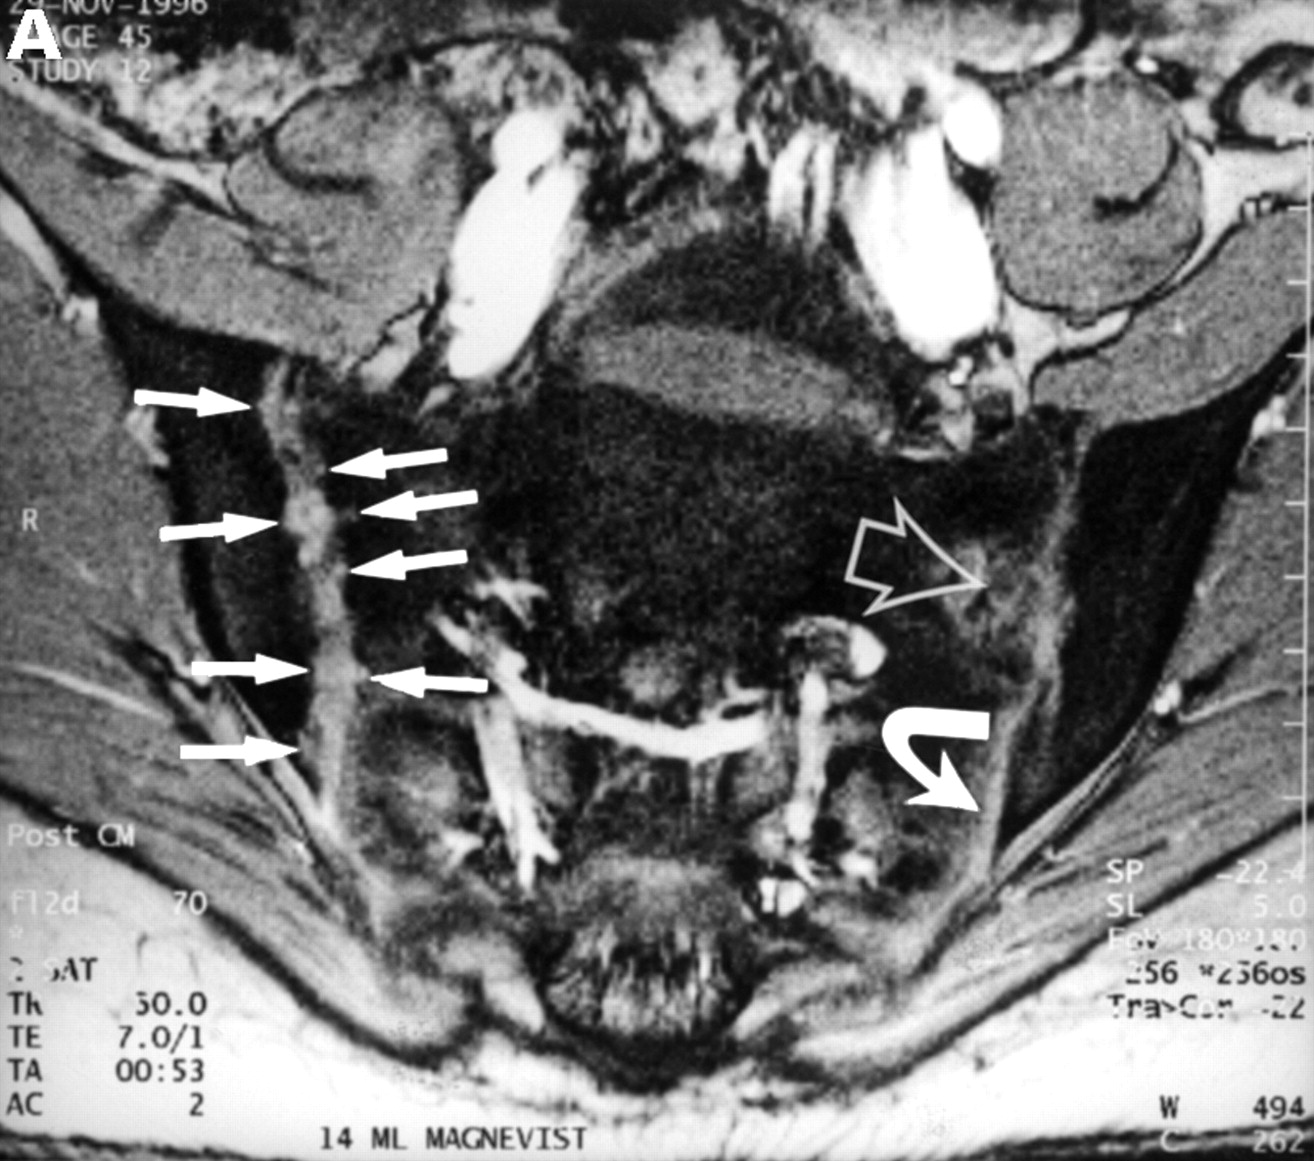
MRI and SJ biopsy specimen of a 36 year old female HLA B27+ AS patient with a disease duration of 10 years with bilateral inflammatory low back pain. (A) T2* weighted gradient echo sequence showing definite chronic changes with bilateral marked subcondral sclerosis (s), huge erosions (white arrows) and some bony bridges crossing the joint spaces (curved white arrows) (bilateral chronicity grade III-IV, bilateral activity grade a, not shown). (B) The biopsy specimen shows a sparse cellular infiltrate (black arrow) with an avital piece of cartilage (black open arrow) surrounded by a large area of bone (haematoxylin and eosin staining, original magnification × 250).


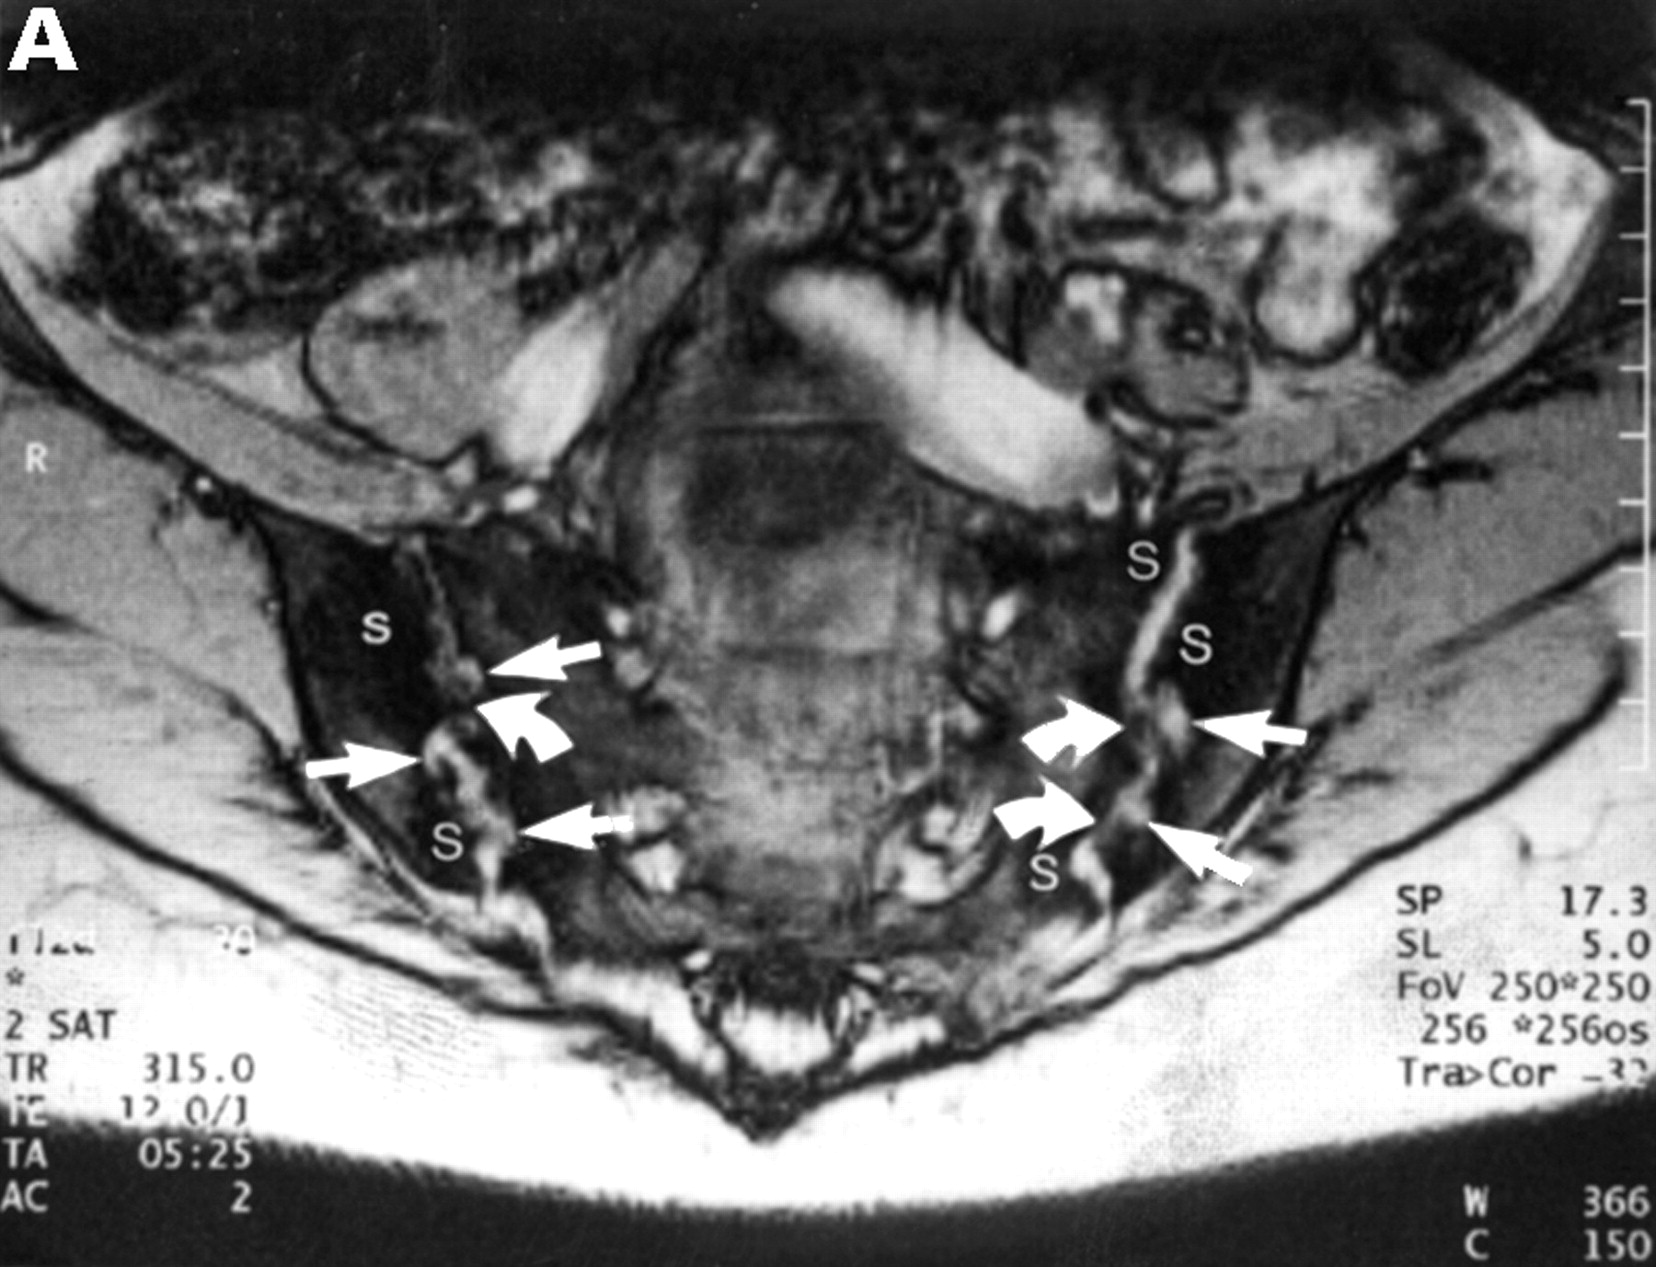
MRI and SJ biopsy specimen of a 17 year old female uSpA patient with unilateral inflammatory low back pain located to the right side and a disease duration of 1.5 years. (A) T1 weighted gradient echo sequence three minutes after application of gadolinium-DTPA showing acute and chronic changes only in the right sacroiliac joint (grade IIb right and 0x left): several small erosions are depicted as contrast enhanced areas (white arrows) connected to the right joint cavity. Left side the transition zone between the ligamentous joint segment (white open arrow) and the synovial joint segment (curved white arrow) is recognisable. (B) The biopsy specimen shows fibrocartilaginous metaplasia with hyaline cartilage above (black arrows) and a fibroblastic cellular infiltrate below (white arrows) characterised by increased new blood vessel formation (black curved arrows), (Goldner staining, original magnification × 250). There were also some but few CD3+ T cells in this area (not shown).


MRI and SJ biopsy specimen of a HLA B27+ 16 year old male juvenile AS patient with bilateral inflammatory low back pain and a disease duration of 7.5 years. (B). T2* weighted gradient echo sequence showing bilateral chronic changes with marked iliac subcondral sclerosis (s) and confluent erosions with consecutive pseudodistention of the joint spaces (white open arrows) in both SJ (bilateral chronicity grade III, bilateral activity grade b, not shown). (B) The biopsy specimen shows a subchondral cellular infiltrate partly invading the cartilage (black arrows). There are fibroblasts and activated lymphocytes in the infiltrate. In between are areas of bone formation (asterisks) and avital bone fragments (curved black arrow) and calcifications (haematoxylin and eosin staining, original magnification × 250).


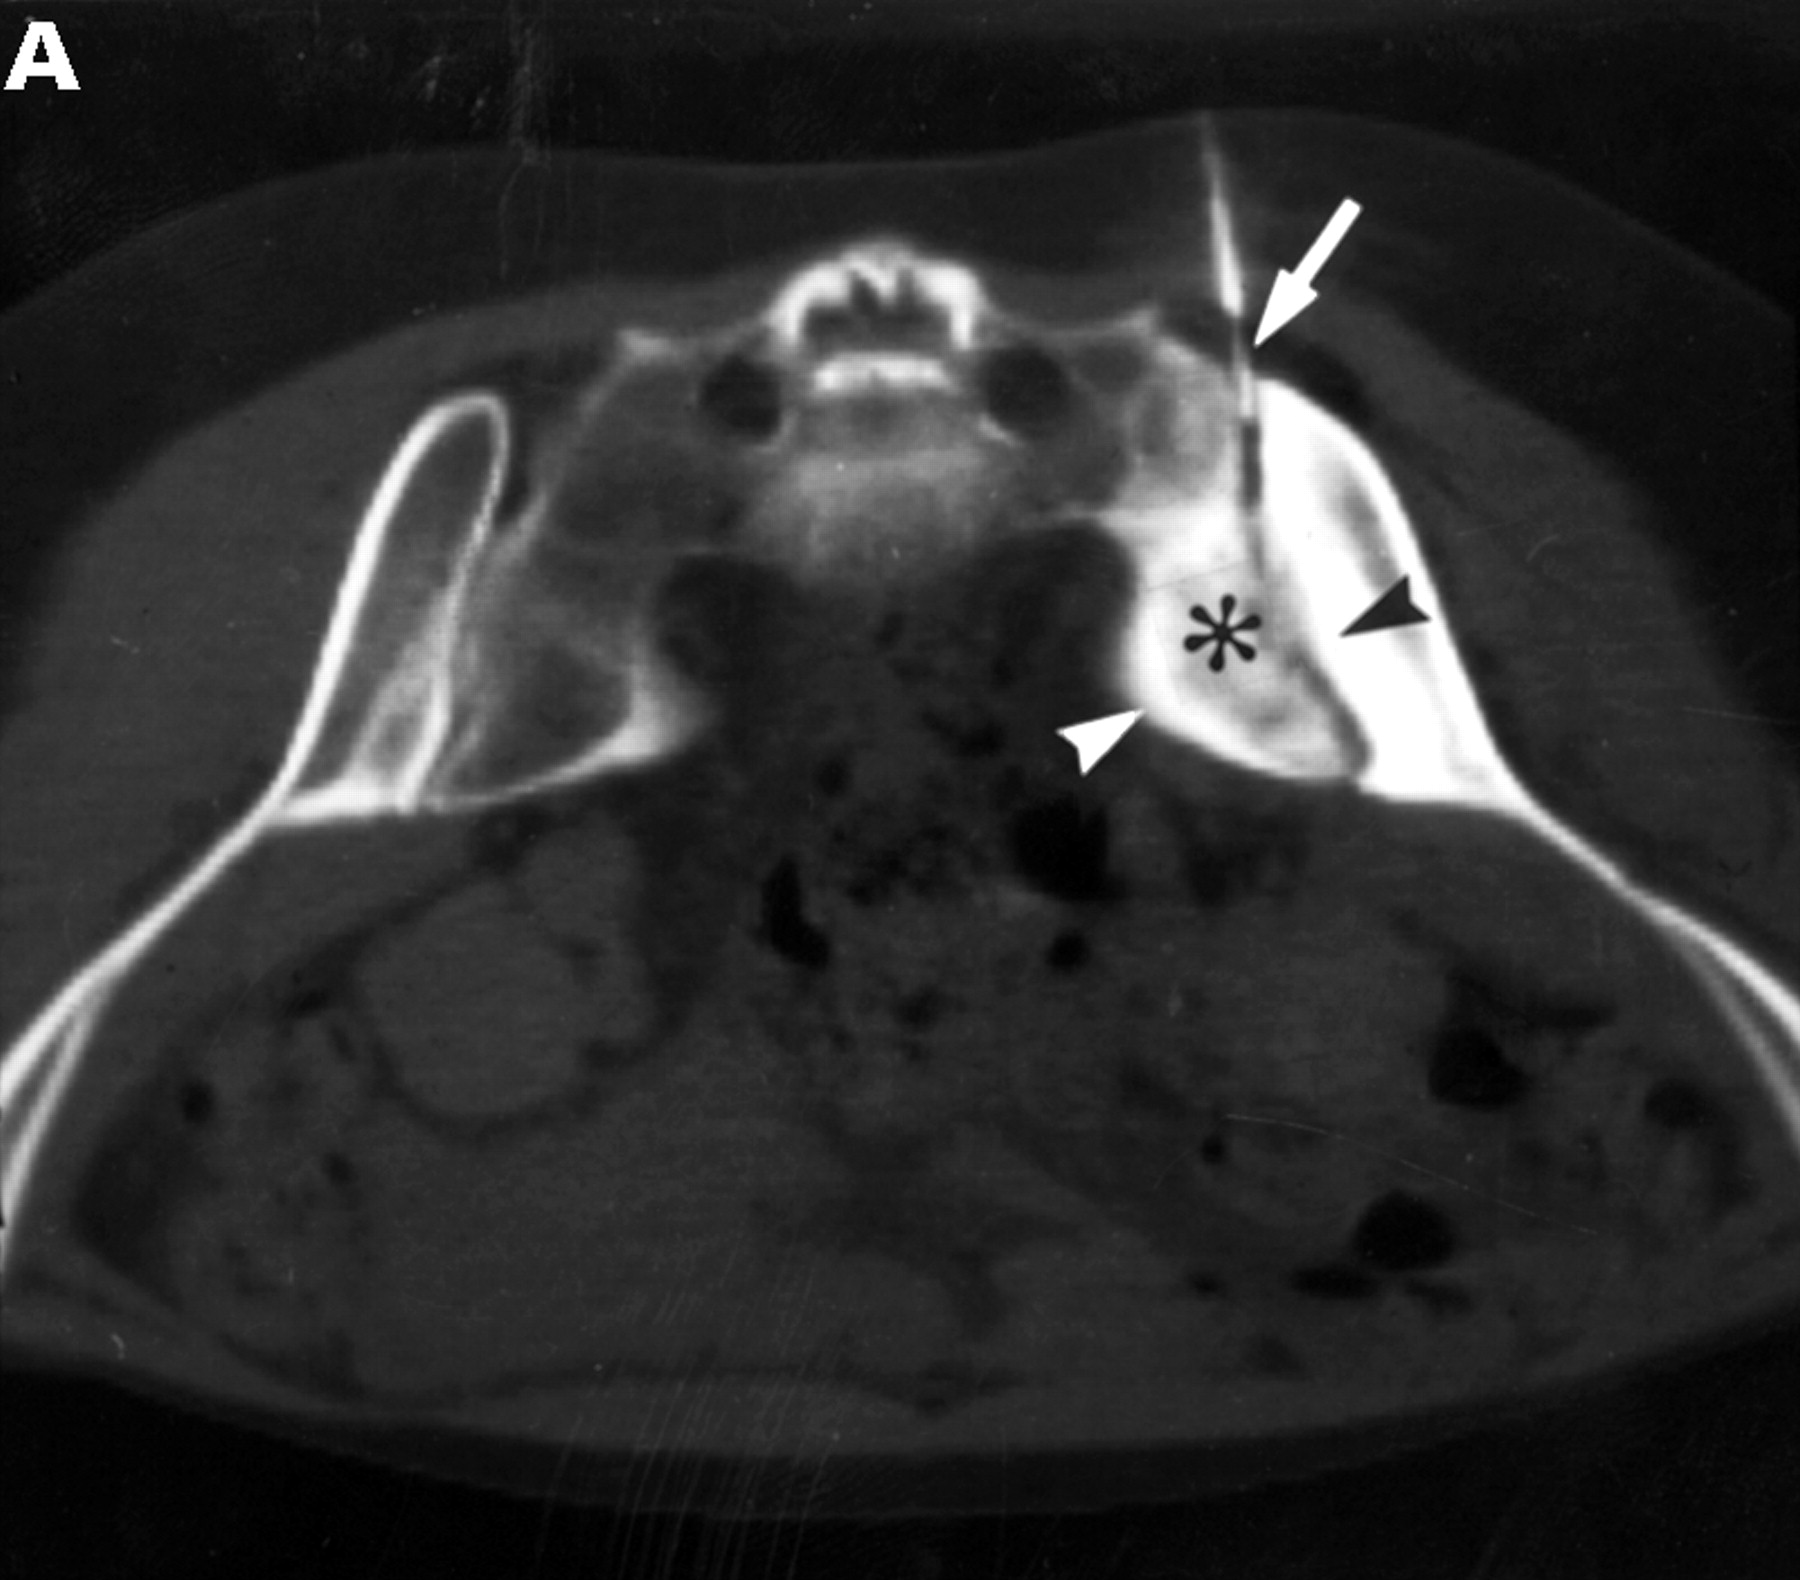
CT and SJ biopsy of a 28 year old female HLA B27+ AS patient with a disease duration of 4.9 years and severe IBP mainly right side. (A) CT showing definite chronic changes in the right SJ (chronicity grade III-IV, activity grade b, not shown) compared with moderate changes on the left side (chronicity grade I, activity grade x, not shown). The biopsy needle (white arrow) is located in the synovial part of the joint. The iliac (black arrowhead) and the sacral side (white arrowhead) of the sacroiliac joint show hypersclerotic bone with some bony bridges crossing the joint space. The somewhat transparent juxta-articular region (asterisk) is still active (better seen on MRI, not shown). (B) The biopsy specimen shows a dense cellular infiltrate (black arrows), consisting mainly of fibroblasts and some lymphocytes close to a bony area (asterisks) with signs of new bone formation indicated by the presence of an osteon (black open arrow).
Discussion
This study shows that T cells and macrophages are the predominant cells in early SpA. This finding confirms our previous observations in a few patients and backs the hypothesis of an ongoing immune response to foreign or self antigens in SpA that still needs to be defined.
Furthermore, this study indicates that the degree of cellularity correlates with the enhancement of the contrast agent gadolinium-DTPA detected in patients with active sacroiliitis. This finding supports MRI as the method of choice to detect acute sacroiliitis suggesting that a high degree of enhancement indicates very active disease. Using STIR imaging that includes suppression of fat is, in our hands, almost as sensitive to detect oedema and inflammation but small inflamed areas may be missed and no quantification of inflammatory activity is possible with this technique. The combination of the sequences used in this study including the opposed phase and the STIR technique gives optimal information on sacroiliac joint pathology. In our experience, there is no advantage of using other fat suppression techniques, which are generally more time consuming.
The methods used deserve comment. In the past five years one of us (MB) has performed a total of 160 CT guided sacroiliac injections, about 100 including biopsies. The combination of biopsy and corticosteroid injection is still operative in our clinics and patients generally benefit in about 80% of the cases as described by us6 and others.15 Side effects of the procedure have not occurred to date. A minor percentage of <20% of the patients refuses consent after appropriate information. However, the yield of biopsy material suitable for immunohistological analysis is limited—even in experienced hands. One third of the biopsy procedures performed in our hands are successful in the sense that the specimens obtained, if at all, are good enough to be stained with monoclonal antibodies. The reasons for failure are (a) too difficult or even impossible access to the joint because of bony angles obstructing the joint space, (b) (excessive) new bone formation in the dorsal part of the joint and (c) other reasons for no yield such as insufficient penetrance of the biopsy device for other anatomical or uncertain reasons. Taken together, we do not obtain sacroiliac biopsy material in all cases and can, thus, not exclude a selection bias attributable to this systematic problem. However, we have no reason to think that the significance of our observations reported in this study is reduced by this unavoidable problem.
The next problem to be mentioned is the size of the biopsy specimens. As we do not always get pieces that are as representative as the one shown we had to determine a cut off and this was set at 3 mm; this size is big enough to evaluate the material obtained and count the cells. Also here, the sizes are not all the same and we have to admit that this might, in general terms, influence the results. However, this is a systematic problem and we did not find the sizes of the specimens to be different in the groups (data not shown).
Another general point to mention is that the localisation of the material obtained is difficult. As indicated in Results, we have found comparable relative amounts of cartilage, bone and connective tissue; this indicates that we do not have to fear a bias by biopsying systematically more bony pieces in advanced disease. The connective tissue appears often as a cellular infiltrate. It is not clear whether it is ligamentous or synovial in origin. The synovial membrane within the capsule of the SJ is too small to be detected by this biopsy technique.These infiltrates that may resemble pannus (fig 2) could also be derived from the subchondral region or the bone marrow (fig 5).
An unavoidable shortcoming of the immunohistological analyses of paraffin sections is the non-functioning of anti CD4-antibodies. In our earlier study4 we had used snap frozen specimens and had therefore been able to determine this class of T helper cells to be more frequently present than CD8+ T cells.
This study extends these findings by providing a new fascinating picture of positively stained T cells in the very top and front of an infiltrate (fig 3), which are highly suggestive of an important role for this cell type in the pathogenesis. Furthermore, the relative contribution of cells in different stages of disease is highlighted. One could have expected inflammatory cells to be more frequent in active and early inflammatory disease but we could not have been sure that this was the case in the sacroiliitis of SpA. In contrast with the other cell types investigated, both, T cells and macrophages seem to be centrally involved in sacroiliac joint inflammation.


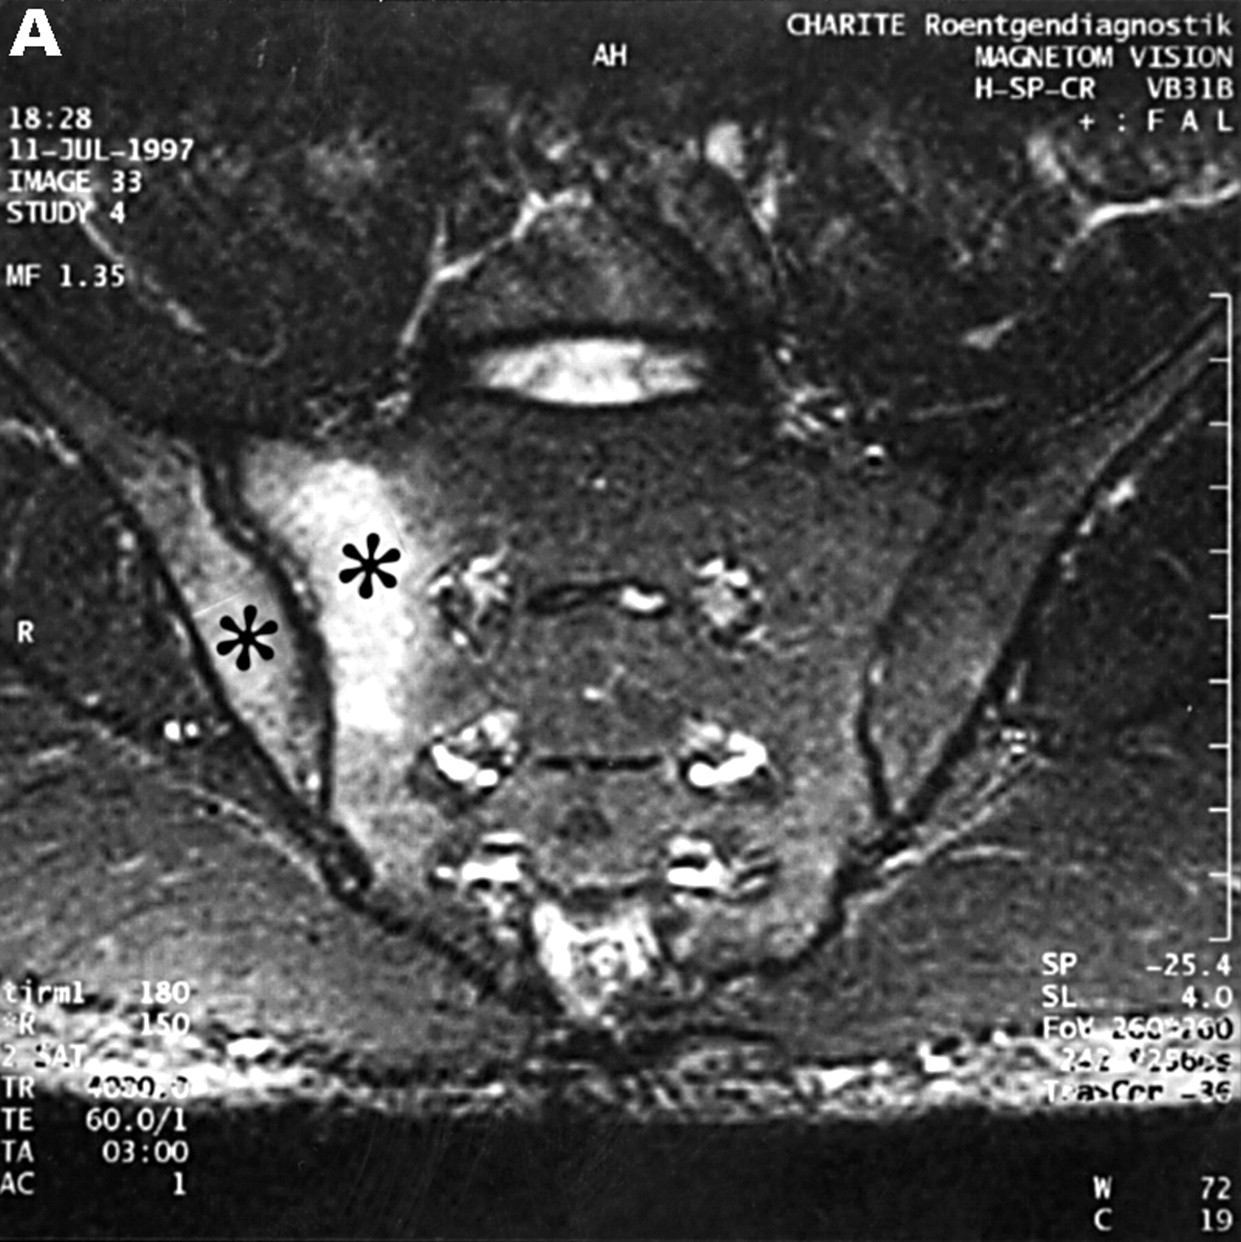
MRI and SJ biopsy specimen of a 35 year old man HLA B27+ uSpA patient with a disease duration of 1.8 years and severe IBP. (A) STIR sequence showing definite acute changes in the right sacroiliac joint (chronicity grade I, activity grade b) compared with a normal left side. The bone marrow osteitis and bone marrow oedema are clearly seen on both sides of the right sacroiliac joint (asterisks). (B) The biopsy specimen shows a cellular infiltrate (white arrow), containing CD3+ T lymphocytes that seem to invade a cartilagineous area with a chondroclast (black arrow) and hypertrophic chondrocytes (immunohistology/haematoxylin and eosin staining, original magnification × 500).
In conclusion, our data back the hypothesis of immune mediated mechanisms in the pathogenesis of sacroiliitis and establish MRI as a reliable tool of detection, especially in early disease.
Acknowledgments
We are indebted to Mrs Ute Oedekoven for skillful technical assistance in preparing scans and prints.