Article Text

Abstract
OBJECTIVE To elucidate whether differences in the destructive tissue process in cartilage and bone in psoriatic arthritis (PsA) and rheumatoid arthritis (RA) can be recognised by different release patterns of molecular fragments derived from joint tissue.
METHODS Aggrecan, cartilage oligomeric matrix protein (COMP), and bone sialoprotein (BSP) were quantified by immunoassays in knee joint synovial fluid samples. These were obtained early in the disease course of patients with PsA and RA. At the time of arthrocentesis radiographs of their knee and hip joints were normal.
RESULTS At follow up no destruction had developed in the knees and hips of most patients with PsA (n=18), whereas the patients with RA could be separated into one “destructive” group (n=18) and one “non-destructive” group (n=25). Patients with PsA had low synovial fluid aggrecan concentrations (p<0.001 v the RA destructive group) but high COMP concentrations (p<0.01 and p<0.05v destructive and non-destructive RA groups, respectively). Consequently, the aggrecan/COMP ratio was lowest in the PsA group (p<0.001 and p<0.01 v the destructive and non-destructive RA group, respectively). The synovial fluid concentrations of BSP did not differ between the three patient groups.
CONCLUSIONS The release pattern of aggrecan and COMP, reflecting cartilage turnover, differed between the PsA group and, particularly, the destructive RA group. This suggests that different pathophysiological mechanisms for cartilage involvement operate in these conditions, with different destructive potential. The BSP concentrations did not differ between the patients groups, which indicates similar levels of bone involvement.
- rheumatoid arthritis
- psoriatic arthritis
- aggrecan
- COMP
Statistics from Altmetric.com
Psoriatic arthritis (PsA) is an inflammatory arthritis which occurs in 8–10% of patients with psoriasis.1 Reported prevalence varies between 0.02% and 0.1%.2 Although not as prevalent as rheumatoid arthritis (RA), the condition is common and may cause considerable morbidity and disability.3 ,4Clinically significant joint damage is generally thought to be uncommon in PsA except in arthritis mutilans, which occurs in fewer than 5% of the cases.3 ,5 ,6 However, recent observations challenge this view and indicate that severe joint damage develops more commonly also in patients with non-mutilating PsA. Thus Gladman and coworkers found in their cohort of prospectively monitored patients that 16% developed more than five deformed joints over a 14 year period.7 These observations clearly show the progressive articular damage in a substantial number of patients with PsA but also show that severe destruction is less common than in RA.
Knowledge of the mechanisms responsible for damage of the articular tissues, cartilage, and bone in inflammatory arthritides, such as PsA and RA, is limited.8 Because the destructive potential of these two conditions is different, it may be proposed that the destructive mechanisms also are different. One possibility may be that the regulation of protease activity leading to specific cleavage of matrix macromolecules differs. This may lead to quantitative and/or qualitative differences in release patterns of macromolecular fragments from the tissue into synovial fluid. Released macromolecules and their fragments can be analysed by specific immunoassays and their quantity and character related to development of tissue destruction.9 This approach provides a tool to identify altered tissue turnover and relate differences observed to the pathogenic mechanisms that are responsible for tissue destruction in arthritides with different outcome.
Understanding of joint tissue destruction is based on information on the matrix composition and structure. Cartilage matrix comprises a network of type II collagen fibres, in which the other major component, aggrecan, and a number of non-collagenous matrix proteins are interspersed.10 Immunoassays for aggrecan and cartilage oligomeric matrix protein (COMP) have been developed.11 ,12 Their usefulness for studies of cartilage turnover in inflammatory arthritis and osteoarthritis has been shown both in cross sectional and longitudinal studies.9 ,12 ,13For example, distinctly different release patterns have been found early in the disease course of patients with RA, relating to the subsequent occurrence or absence of advanced joint destruction.9 ,14 It should be noted that COMP has also been identified in other pressure loaded tissues—for example, tendon and meniscus.15-18 The relative abundance of COMP varies in different tissues, being high in articular cartilage. Changes both in synovial fluid and in serum levels of COMP seem to be related to cartilage pathology.12 ,19-23 Furthermore, synovial fluid or serum concentrations of COMP do not correlate with biochemical measures of inflammation—for example, the acute phase response.12
Bone sialoprotein (BSP) is a bone-specific matrix protein, especially enriched at the bone-cartilage interface.24 The protein has been quantified in synovial fluid by immunoassay.25 In RA the highest synovial fluid concentrations are found in patients with marked destruction, as visualised radiographically.9 ,25
In this study we determined knee joint synovial fluid concentrations of aggrecan, COMP, and BSP in patients with PsA with knee joint synovitis early in their disease course and compared their relative abundance with that in patients with early RA with knee joint synovitis. The primary objective was to elucidate whether differences in the disease process in the target organs, cartilage and bone, can be distinguished by different release patterns of molecular fragments derived from tissue. An additional aim was to compare release patterns of matrix macromolecules early in the disease course of patients with PsA who subsequently develop different degrees of knee or hip joint destruction.
Materials and methods
The patients with PsA were identified by a computer search of a synovial fluid bank collected consecutively from patients who had undergone a therapeutic arthrocentesis owing to a knee joint synovitis. Diagnosis of PsA was based on the presence of an inflammatory arthritis associated with psoriasis, according to Moll and Wright.26For inclusion, it was further required that the available synovial fluid sample was obtained within six years from reported arthritis onset and that the knee and hip joint radiographs were normal at the time of aspiration. The RA samples used for comparison were from patients identified in the same bank of fluids. RA was defined according to the American College of Rheumatology criteria.27 Other inclusion criteria were identical to those for PsA. The patients with RA have been described previously.9
Synovial fluids were obtained between 10 am and 2 pm after normal ambulatory activity. The fluids were centrifuged and then stored at −80ºC until analysis.11 Aggrecan, COMP, and BSP were analysed by enzyme linked immunosorbent assay (ELISA) using polyclonal antisera.11 ,12 ,25 The aggrecan antiserum primarily recognises epitopes in the CS-rich region of the core protein of the molecule.
The patients with PsA participated in a follow up examination after a median disease duration of 13.0 years (range 1.7–17.2) corresponding to a median of 10.7 years (range 1.3–13.0) after arthrocentesis. This examination was to verify diagnosis and included a thorough clinical examination and a detailed interview about joint surgery, functional ability, etc. In addition, the patient charts were reviewed to obtain patient characteristics and results of radiographic examinations at inclusion and during the time period between inclusion and follow up. All examinations were performed by the same rheumatologist.
Knee and hip joint radiographic examinations at follow up were performed in the upright position using the standard procedures of the hospital. All radiographs were assessed by a single, experienced radiologist blinded as to the clinical and synovial fluid findings.
The follow up of the patients with RA consisted of a radiographic examination of the knee and hip joints graded according to Larsen and recording of knee and/or hip joint replacements.9 ,28 The disease duration at radiographic follow up for those not having undergone arthroplasty was median 8.8 years (range 6.8–13.4). The disease duration at the first joint surgery for those having an arthroplasty was median 5.5 years (range 2.6–9.2). Patients with arthroplasty in any hip or knee, or radiographic changes corresponding to Larsen grades 4–5, were classified as having a “destructive arthritis”. Those with normal radiographs at follow up were classified as having a “non-destructive arthritis”.
STATISTICAL CALCULATIONS
Comparisons between the patient groups were performed with the Mann-Whitney U test (two tailed). Correlations were calculated with Spearman's correlation coefficient. p Values <0.05 were considered significant.
Results
Eighteen patients with PsA and 43 patients with RA fulfilled the criteria for inclusion. A diagnosis of PsA at the time of arthrocentesis was confirmed in all cases at follow up. At onset of joint symptoms most of the patients with PsA had monoarticular (n=7) or oligoarticular (n=8) disease. At follow up the majority (n=10) had polyarticular disease, but none had mutilating arthritis. Table 1 shows some characteristics of the patients at the time of synovial fluid retrieval. As expected, the majority of patients with RA were Waaler-Rose positive, whereas only one patient classified as having PsA was weakly seropositive at the time of joint fluid aspiration. The disease duration at synovial fluid retrieval was somewhat shorter in the patients with RA with destructive disease (p=0.005 and p=0.04v non-destructive RA and PsA respectively).
Some characteristics of the patient groups at the time of synovial fluid aspiration. Values are numbers or median (range)
At follow up of the patients with PsA, one patient had had both hips replaced, and one had knee erosions that could be attributed to PsA. The other patients had normal radiographs or minor changes, compatible with early osteoarthritis. Thus the samples were too few to relate the destructive potential in PsA to early synovial fluid levels of the tissue markers. The patients with RA were divided into a destructive group (n=18) and a non-destructive group (n=25), according to the given criteria. A detailed description of these patients has been presented.9
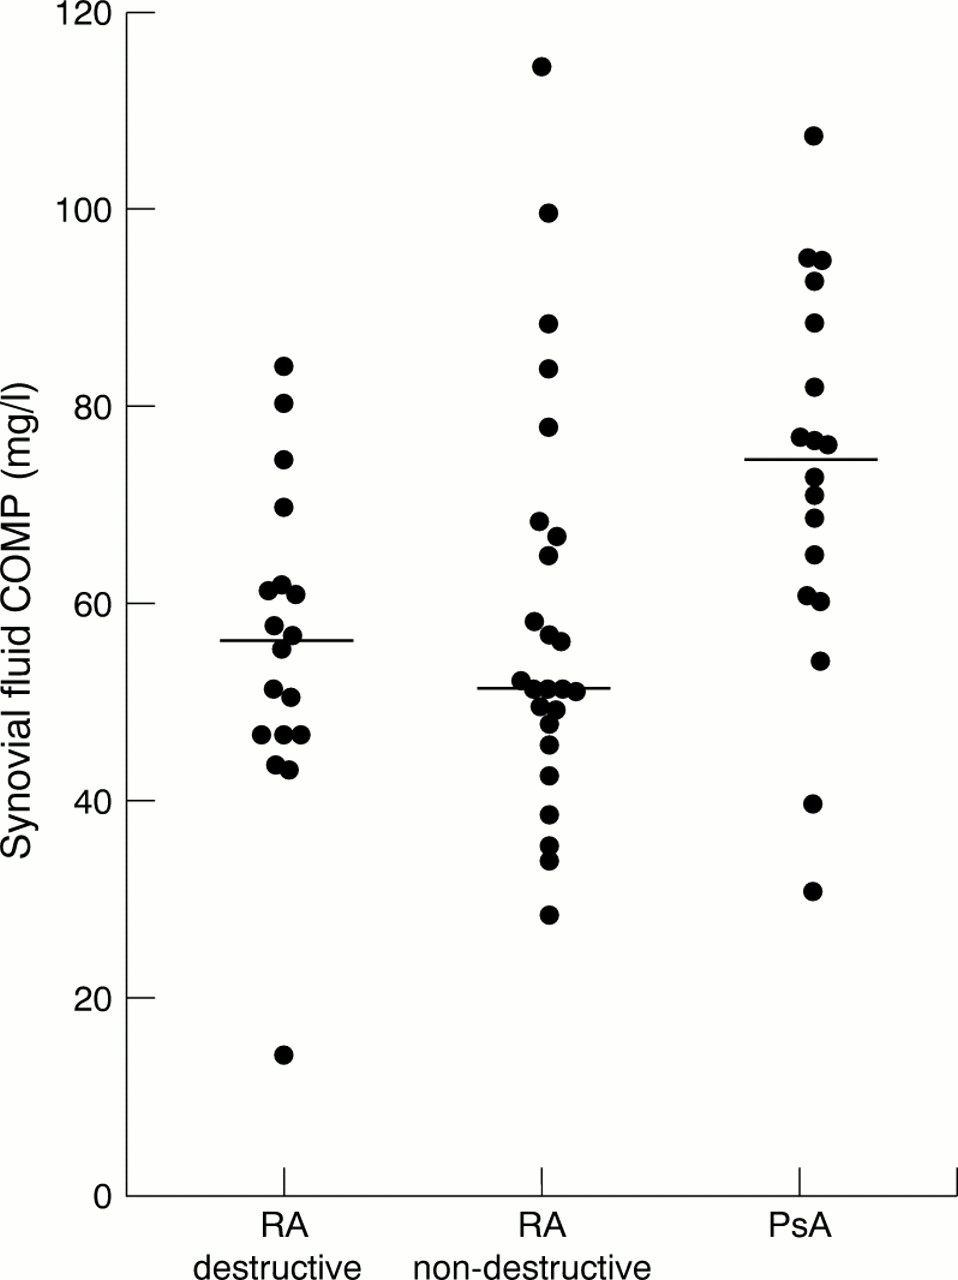
Figures 1-4 show the concentrations of aggrecan and COMP, the aggrecan/COMP ratio, and the concentrations of BSP in synovial fluids from the three patient groups.
Patients with PsA had low aggrecan concentrations, differing significantly from the destructive RA group (p<0.001) but not from the non-destructive RA group (p=0.12). In contrast, the highest COMP concentrations were found in PsA, differing from both destructive RA (p=0.009) and non-destructive RA (p=0.01). The different release patterns in these conditions were further emphasised by the aggrecan/COMP ratio, which was lowest in the PsA group (p<0.001 and p=0.005 v the destructive and non-destructive RA group, respectively).
The aggrecan and COMP concentrations correlated significantly in the PsA group (rs =0.59, p=0.009) but not in either of the RA groups.
The synovial fluid BSP concentrations in PsA did not differ from those in the two RA groups.
Discussion
The release pattern of the cartilage macromolecules showed most marked differences between PsA and destructive RA. There were, however, also differences between PsA and non-destructive RA. In PsA the synovial fluid content of aggrecan was lower than in destructive RA but not than in non-destructive RA, whereas the synovial fluid content of COMP in PsA was higher than in either RA group. The expected different progression rate of cartilage destruction between the two diseases was confirmed in this study. It is tempting to speculate that in these patient groups the synovial fluid content of aggrecan, which is highest in the more destructive RA, primarily reflects breakdown of resident molecules. The synovial fluid content of COMP, being highest in PsA, on the other hand, may primarily represent degradation and release of newly synthesised molecules reflecting a repair process. This repair process seems to be sufficient to prevent permanent cartilage damage. This view is supported by the finding of a lower aggrecan/COMP ratio in the non-destructive RA group than the destructive group, the former resembling the situation in patients with PsA (fig 3). This hypothesis about COMP is further supported by findings in reactive arthritis, a condition rarely causing significant permanent joint damage, in which synovial fluid concentrations of COMP significantly exceed those found in RA.12 ,29 Thus the findings in PsA and reactive arthritis are similar for COMP—that is, the synovial fluid concentrations are raised compared with RA, which supports the view that in both diseases the COMP release predominantly reflects repair processes. However, it should be emphasised that this remains to be proved in studies examining the nature of the fragments released in the different conditions.

Synovial fluid concentrations of aggrecan (mg/l). Individual samples and median (bar) are indicated.

Synovial fluid concentrations of COMP (mg/l). Individual samples and median (bar) are indicated.

Synovial fluid aggrecan/COMP ratios. Individual samples and median (bar) are indicated.

Synovial fluid concentrations of BSP (μg/l). Individual samples and median (bar) are indicated.
The synovial fluid BSP concentrations did not differ between the groups and were in the same range as those found in a previous study of RA. This suggests that although the patients with PsA did not develop severe joint damage, the disease process in the early phases alters the turnover of the subchondral bone to the same extent as in RA.25
It is unlikely that any of the demographic characteristics in the groups could explain the different marker concentrations (table 1). There was no correlation with disease duration for any of the markers in any of the groups (data not shown). Thus the somewhat shorter disease duration at aspiration in the destructive RA group should not influence the results. There were more men in the PsA group and these patients were younger than the patients with RA. In previous studies, however, we have not seen any relation with age or sex for synovial fluid levels of aggrecan and COMP in adults (Saxne T, unpublished). The type of drug treatment at the time of synovial fluid aspirations was similar between the groups and cannot account for the findings.
Thus the cartilage turnover, as measured by the synovial fluid content of aggrecan and COMP, differs between PsA and RA, and is especially apparent when comparing PsA and destructive RA. However, similarities were also found—namely, patients with RA with a benign course, not developing destruction in knees and hips, had aggrecan levels similar to those found in PsA. This suggests basic differences between mechanisms governing the tissue involvement in non-destructive arthropathies and those that lead to progressive destruction. Future work is needed to define these differences. They may include differences in activation pathways of select proteases playing a part in tissue turnover. Quantification and characterisation of released matrix macromolecules will aid in these endeavours.
Acknowledgments
Skilful technical assistance by Mrs Mette Lindell is appreciated. We thank Professor Kjell Jonsson for evaluating the radiographs.
References
Footnotes
Supported by grants from the Swedish Medical Research Council, the Medical Faculty, Lund University, Förenade Liv, Konung Gustaf V:s 80-årsfond, Reumatikerförbundet, Stiftelsen Börje Dahlins fond, Alfred Österlunds stiftelse, Anna-Greta Crafoords stiftelse för reumatologisk forskning, and Greta och Johan Kocks stiftelser.