Article Text

Abstract
Objective Syndesmophytes in ankylosing spondylitis (AS) can occur anywhere along the vertebral rim, but little is known about how and where they develop, and particularly if they first form in certain locations along the rim. This information might provide clues to their aetiology. We examined the spatial distribution of syndesmophytes in the thoracolumbar spine in patients with AS using CT.
Methods We performed lumbar spine CT scans in 50 patients and used a validated computer algorithm to measure syndesmophyte heights in six intervertebral disc spaces. We measured heights every five radial degrees around the rim of each superior and inferior vertebral endplate.
Results Syndesmophytes were observed in 208 of 296 intervertebral disc spaces. Both ascending and descending syndesmophytes were non-randomly distributed along the vertebral rim (p<0.0001 for deviation from uniform distribution). Syndesmophytes occurred most often at the posterolateral vertebral rim, and least commonly at the posterior rim and anterior rim. In disc spaces with only small isolated syndesmophytes, these were also most likely to occur at the posterolateral rim. Syndesmophyte distribution varied with the vertebral level. Localisation at the posterolateral rim was most pronounced at T10-T11, T12-T12 and T12-L1, while L2-L3 and L3-L4 exhibited little localisation.
Conclusions Syndesmophytes are not randomly distributed around the vertebral rim, as might be expected if they develop solely in response to inflammation. Rather, they preferentially occur, and likely develop first, at the posterolateral rim. Studying factors that can lead to this pattern may help elucidate how syndesmophytes develop.
- Ankylosing Spondylitis
- Outcomes research
- Spondyloarthritis
Statistics from Altmetric.com
Syndesmophytes are osteoproliferative structures that form at the annulus fibrosis in many patients with spondyloarthritis.1 Syndesmophytes may bridge the intervertebral disc space (IDS), and in ankylosing spondylitis (AS), bridging may extend around the entire circumference of the vertebral rim to encase the disc. Bridging and intervertebral fusion contribute to the spinal inflexibility characteristic of AS. Although syndesmophytes are thought to develop in response to enthesopathy in the annulus fibrosis or vertebral osteitis, their precise pathogenesis, and particularly the role of inflammation, remains incompletely understood.2–5 Understanding the processes that govern the development of syndesmophytes might provide insight into potential interventions to slow or stop spinal fusion.
Fundamental knowledge about the development of syndesmophytes might be obtained by examining their spatial distribution in the IDS. Although syndesmophytes can occur anywhere along the vertebral rim, little is known about their typical locations and patterns of evolution. For example, it is not known if syndesmophytes develop randomly around the vertebral rim, or if particular locations are more prone to develop syndesmophytes. A random distribution might be expected if enthesitis or osteitis were the primary cause, as absent data to the contrary, inflammation might be expected to occur randomly throughout the vertebral/disc unit.6 In studies using plain radiography, syndesmophytes in the lumbar spine are somewhat more often seen on anteroposterior projections than on lateral projections, suggesting a slight predilection for development on the lateral vertebral rim compared with the anterior rim.7 ,8 It is also not known if the distribution of syndesmophytes along the vertebral rim is similar for all IDSs or if different IDSs have specific patterns of syndesmophyte distribution. Whether ascending or descending syndesmophytes are more common, and which develop earlier, is also unknown. These knowledge gaps are in large part due to the lack of three-dimensional information on syndesmophytes, which to date have mainly been studied using plain radiography.
We used CT and a newly developed technique to quantitatively measure syndesmophyte height to examine the spatial distribution of syndesmophytes along the vertebral rim in the thoracolumbar spine of patients with AS.9 Our aim was to examine if syndesmophytes were more common at particular locations along the rim, and if their distribution varied with the IDS. By examining both their size and location, we also aimed to determine where syndesmophytes were most likely to begin, and if ascending or descending syndesmophytes were more likely to develop first.
Methods
Patients and study protocol
We examined adults with AS who were patients at the National Institutes of Health or Johns Hopkins Medical Institutions. To be eligible, subjects were required to be age 18 or older, have AS by the modified New York criteria10 and have a Bath Ankylosing Spondylitis Radiology Index (BASRI) lumbar spine score of 3 or less (ie, not completely fused).7 We enrolled at least five subjects in each BASRI category (0, 1, 2 and 3) to have a wide representation of degrees of spinal fusion. The study protocol was approved by the institutional review boards of both hospitals. All subjects provided written informed consent.
CT scanning and image analysis
We scanned subjects from T10 to L4 because syndesmophytes tend to be more common in this region.11 Six IDSs were included for analysis for each subject: T10-T11, T11-T12, T12-L1, L1-L2, L2-L3 and L3-L4. Four scanners were used during the study: a Philips Brilliance 64 (slice thickness 1.5 mm), a GE Lightspeed Ultra (slice thickness 1.25 mm), a Siemens Somatom Flash and a Siemens Somatom Force (slice thickness 1.0 mm for both Siemens scanners). In all cases, voltage was set at 120 kVp and current at 300 mAs. The estimated equivalent absorbed radiation dose was 8.01 mSv (0.801 rem).
We applied a semiautomated computer algorithm to measure syndesmophyte height in each IDS.9 ,12 The algorithm detects syndesmophytes as any voxels of bone density extending from the vertebral rim and lying between the planes of the two vertebral endplates. In this study, we measured the maximum syndesmophyte height every five radial degrees along the circumference of the vertebral rim, providing 72 measurements over 360° (figure 1). We measured the height of syndesmophytes ascending from the superior endplate separately from those descending from the inferior endplate of the adjacent vertebra. We normalised the height measurements to the height of the IDS so that bridging had a value of 1.0, values between 0 and 1.0 represented the proportion of the IDS height spanned by a syndesmophyte, and 0 represented no syndesmophyte. The algorithm provides highly reliable measurements; syndesmophyte heights on repeated scans of the same subject had an intraclass correlation of 0.99 and coefficient of variation of 2.4%.9

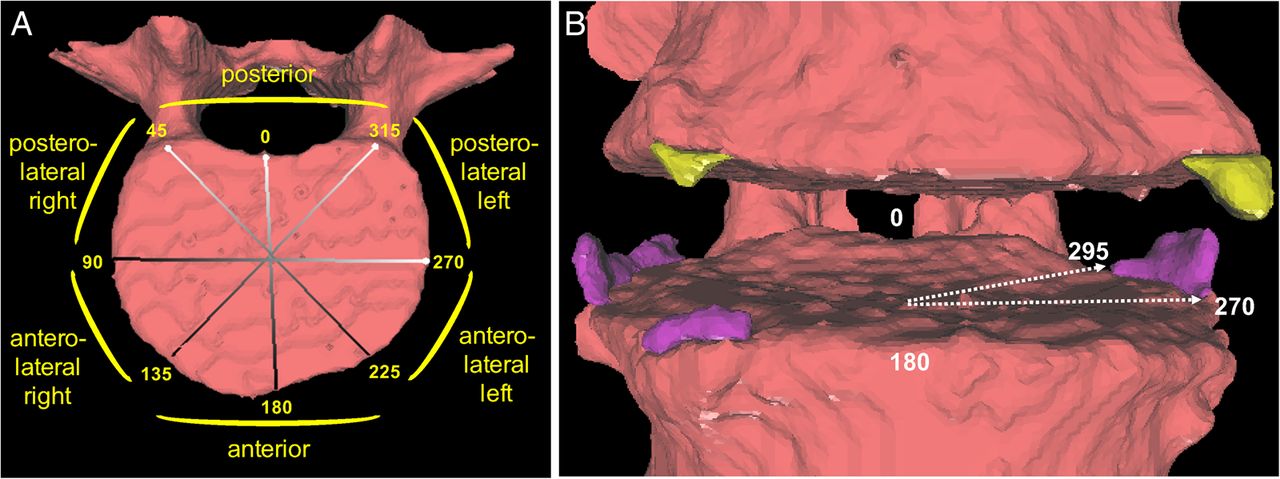
(A) Map of the regions of the vertebral rim, by radial degrees. (B) Example of syndesmophytes (ascending in purple, descending in yellow) at posterolateral and anterolateral positions. The arrows indicate the angular localisation of one syndesmophyte, which would contribute to five angular sectors between 270° and 295°.
Statistical analysis
We examined if syndesmophytes were randomly distributed or preferentially localised along the vertebral rim by first plotting the mean syndesmophyte height in each of the 72 angular sectors around the vertebral rim. We compared the distribution of the location frequencies within the 72 angular sector measurements across the IDSs of all patients using a permutation test of circular uniformity based on Kuiper’s statistic.13 ,14 This test determines if the location of syndesmophytes in any angular sector along the rim is random over all angular sectors of the same rim (see online supplementary methods). A significant result indicates that there is a detectable (non-random) pattern among the locations of syndesmophytes around the rim. We implemented this test while accounting for the clustering of IDSs within subjects. We tested ascending and descending syndesmophytes separately. Bridging syndesmophytes were counted as both ascending and descending as there is no way to know from which endplate they originated.
To determine if smaller (and therefore presumably younger) syndesmophytes as well as large syndesmophytes were localised, we diagrammed the location of each syndesmophyte in all IDSs, and ranked these by the total syndesmophyte height among all 72 segments along the rim. Represented as heat maps with colour intensity proportional to syndesmophyte height, we ordered the IDSs with the least affected (with the smallest and narrowest syndesmophytes) at one extreme and the most affected (with complete bridging) at the opposite extreme.
To determine if the distribution of syndesmophytes varied by vertebral level, we computed the mean distributions and made heat maps for each IDS individually. We also statistically tested whether the distribution of heights of syndesmophytes differed between IDS levels. Treating the heights from each angular section as functional data collected on the interval 0°–360°, we used a permutation test analogous to a paired t test to compare the mean pattern of syndesmophyte heights around the rim by IDS level.
To investigate the relationship between ascending and descending syndesmophytes, we examined if ascending syndesmophytes were taller than any syndesmophyte at the same location on the opposing vertebral endplate, and vice versa. Because we were interested in syndesmophyte development, we limited this analysis to IDSs in which the tallest syndesmophyte was 0.50 or less (ie, spanning one-half or less of the disc space). Analyses were performed using R software (V.3.2, Vienna, Austria). All permutation tests were performed with 100 000 permutations to generate the permutation null distribution.
Results
We studied 50 subjects, including 42 men and 8 women, who had a mean (SD) age of 46.6 (11.6) years. Their mean duration of AS was 18.7 (11.6) years. Eight patients had a BASRI lumbar spine score of 0, five had a score of 1, 14 had a score of 2 and 23 had a score of 3. The median modified Stoke Ankylosing Spondylitis Spine score in the lumbar spine (possible range 0–36), which scores only the anterior corners of the vertebrae, was 4 (25th, 75th percentile 0, 10). On CT scans, the algorithm detected syndesmophytes in 208 of 296 IDSs (70%). Four subjects were scanned too low and were missing the T10-T11 IDS.
When averaged over all levels, the distribution of syndesmophytes along the vertebral rim was non-uniform (figure 2). The posterolateral regions were the most affected and had the tallest syndesmophytes, followed by the anterolateral regions. Least affected were the anterior and posterior regions. Statistical testing confirmed departures from a random distribution for the location of both ascending and descending syndesmophytes (both p<0.0001).
Mean heights along the vertebral rim of the superior vertebral endplates (ascending syndesmophytes) and of the inferior endplates (descending syndesmophytes) of the tallest syndesmophyte in each angular sector, averaged over all vertebral levels. Heights were standardised to the height of the intervertebral disc space, so that values of 0 represent no syndesmophyte and 1.0 represent bridging. A, anterior; AL, anterolateral left; AR, anterolateral right; IDS, intervertebral disc space; P, posterior; PL, posterolateral left; PR, posterolateral right.
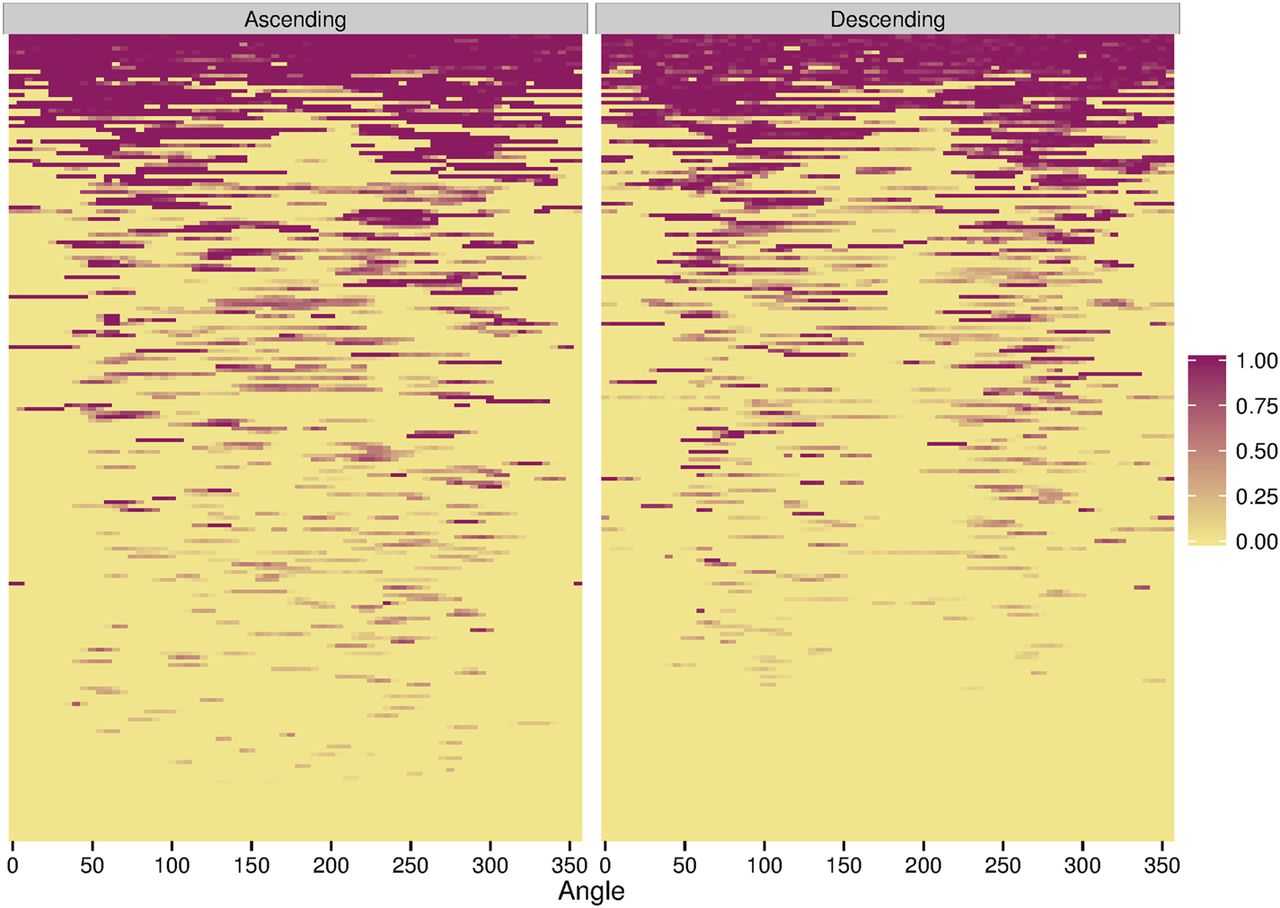
The heat maps demonstrated that in IDSs with only small syndesmophytes, these were also predominantly located at the posterolateral and anterolateral vertebral rim, and were much less common at the posterior and anterior rim (figure 3). This localisation was more pronounced for descending syndesmophytes. Focal bridging was also more likely to occur in these regions, suggesting that these were the locations where syndesmophytes had developed first, before other regions became affected. IDSs with more widespread bridging almost always included bridging in the posterolateral regions bilaterally, while the posterior and anterior regions were the areas most often free of bridging.

Heat map of locations of ascending and descending syndesmophytes in each of the 208 intervertebral disc spaces. Each row represents one intervertebral disc space. Colour intensity is proportional to syndesmophyte height, with yellow indicating no syndesmophyte, light purple indicating small syndesmophytes and deep purple represents bridging. Intervertebral disc spaces were ordered by their total circumferential height, from most involved (completely bridged) at the top to least involved at the bottom.
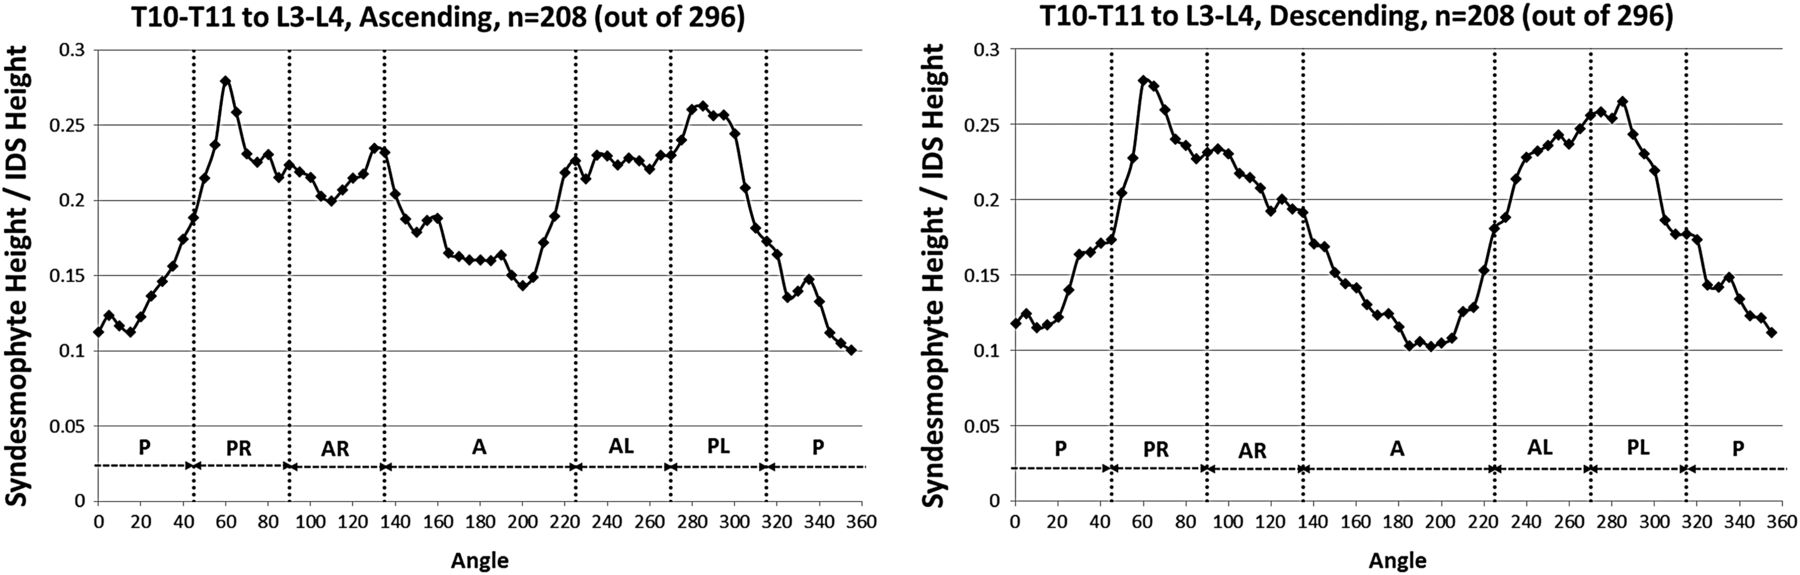
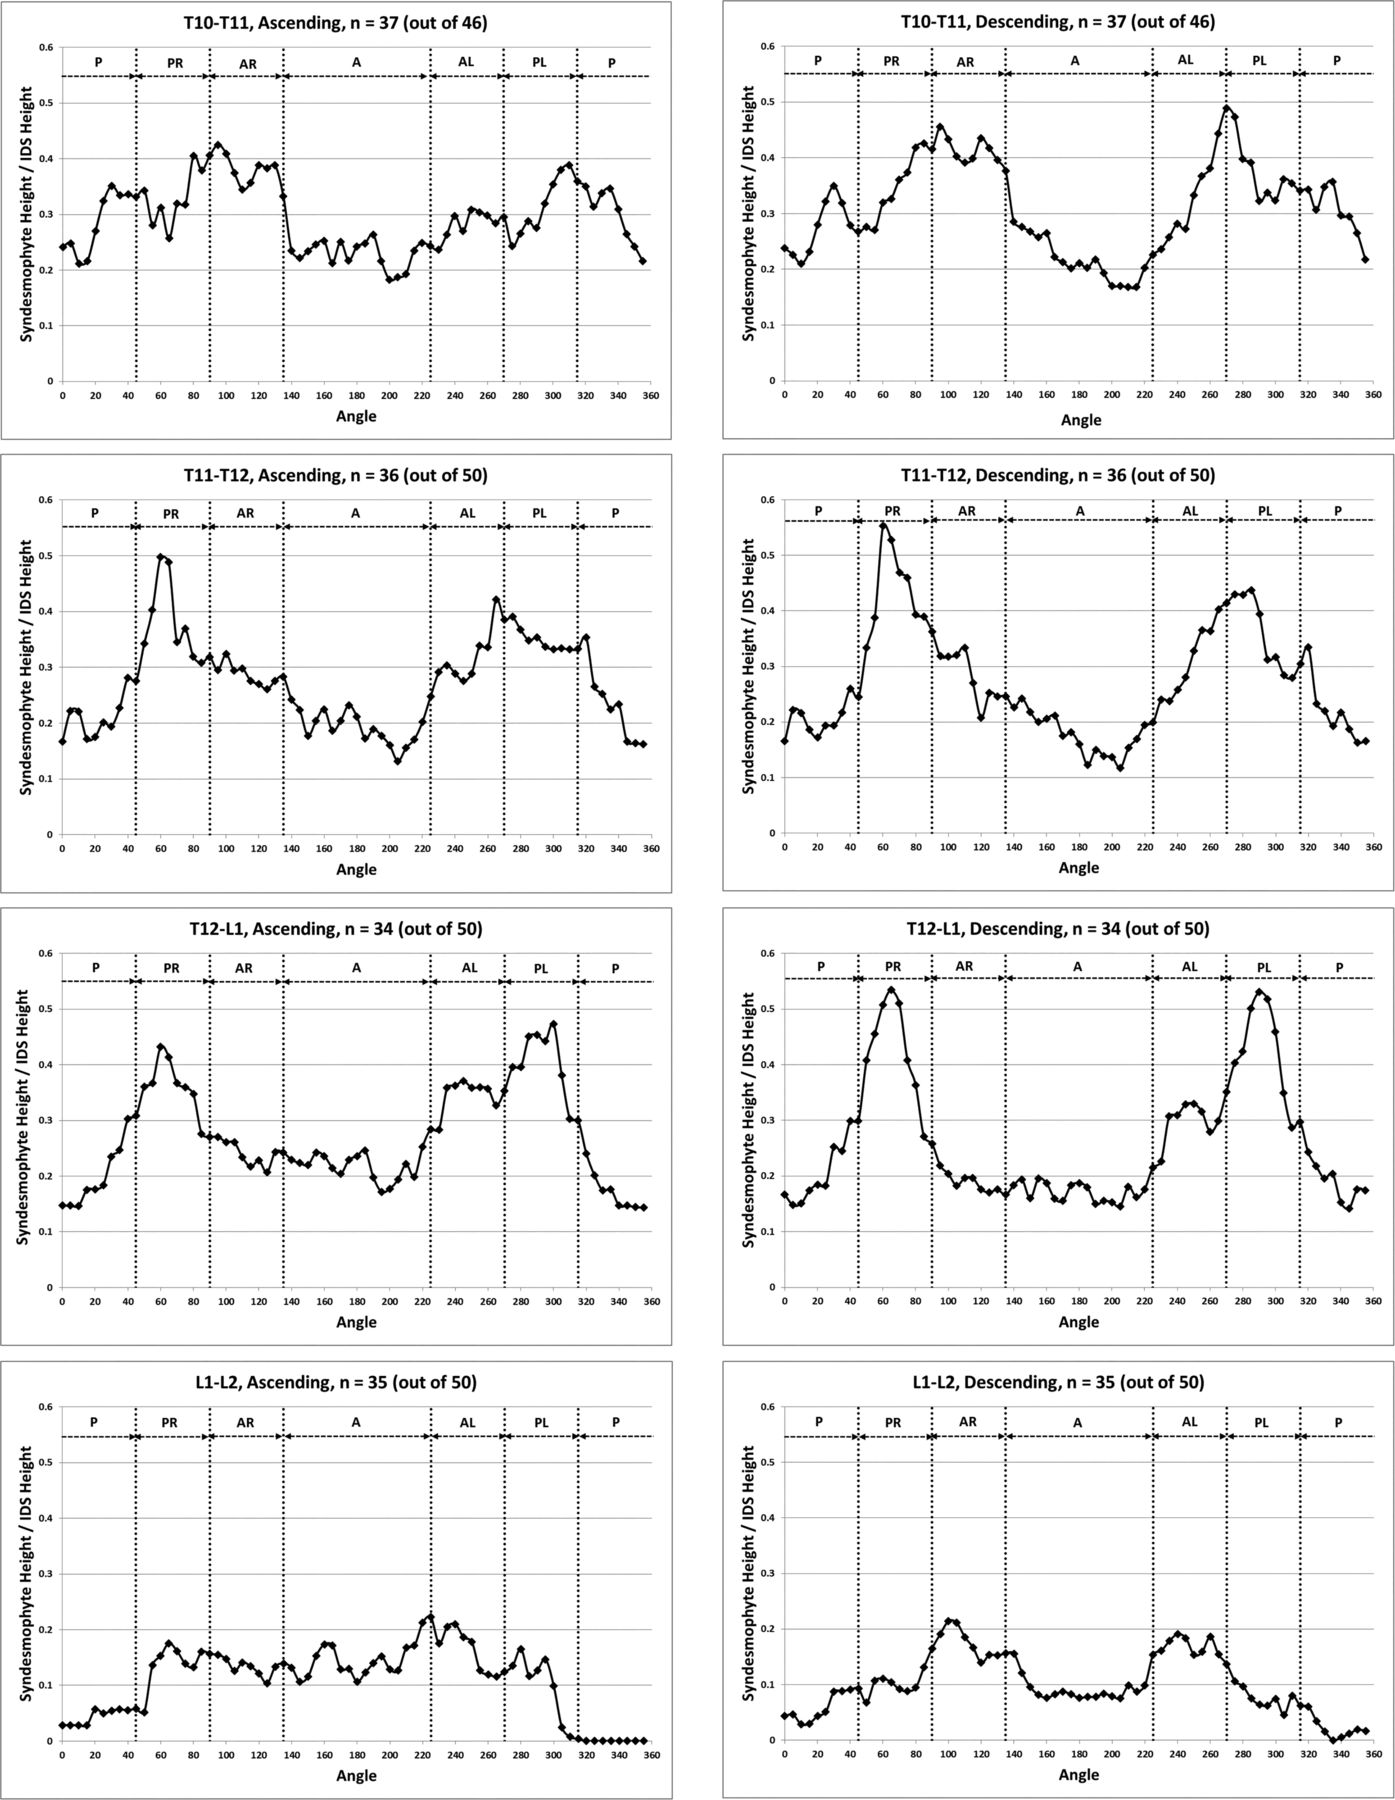
When stratified by vertebral level, the distribution of syndesmophytes along the vertebral rim exhibited variations (figure 4). The three most superior IDSs (T10-T11, T11-T12 and T12-L1) exhibited a similar pattern, with syndesmophytes preferentially localised at two locations on either posterolateral vertebral rim. This bimodal distribution was more prominent for descending than ascending syndesmophytes, and particularly prominent at T11-T12 and T12-L1. Secondary involvement of the anterolateral locations was noticeable particularly at the T10-T11 level. The distribution changed at the L1-L2 level, and consistent patterns of localisation were less distinct in the three lumbar IDSs. Statistical analysis confirmed that the patterns in the three more superior IDSs (T10-T11, T11-T12 and T12-L1) and the three inferior IDSs (L1-L2, L2-L3 and L3-L4) formed two distinct groups. Within each group, the patterns of syndesmophyte distribution were not significantly different, while between the groups they were (see online supplementary table S1). At all levels, the least involved areas were the anterior and posterior rim.

Mean heights along the vertebral rim of the superior vertebral endplates (ascending syndesmophytes) and of the inferior endplates (descending syndesmophytes) for each vertebral level. Heights were standardised to the height of the intervertebral disk space, so that values of 0 represent no syndesmophyte and 1.0 represent bridging. A, anterior; AL, anterolateral left; AR, anterolateral right; IDS, intervertebral disc space; P, posterior; PL, posterolateral left; PR, posterolateral right.

Contiuned.
The heat maps for individual IDSs show that syndesmophytes were more common and taller in the three thoracic IDSs, and complete fusion over the whole vertebral rim occurred in these IDSs but not in the lumbar IDSs (figure 5). Localisation at the posterolateral rim was present in the three thoracic IDSs for both small syndesmophytes and focal bridging for both ascending and descending syndesmophytes, but more so for descending syndesmophytes. Some localisation was also evident for descending syndesmophytes at the L1-L2 IDS, but not at the L2-L3 or L3-L4 IDSs.
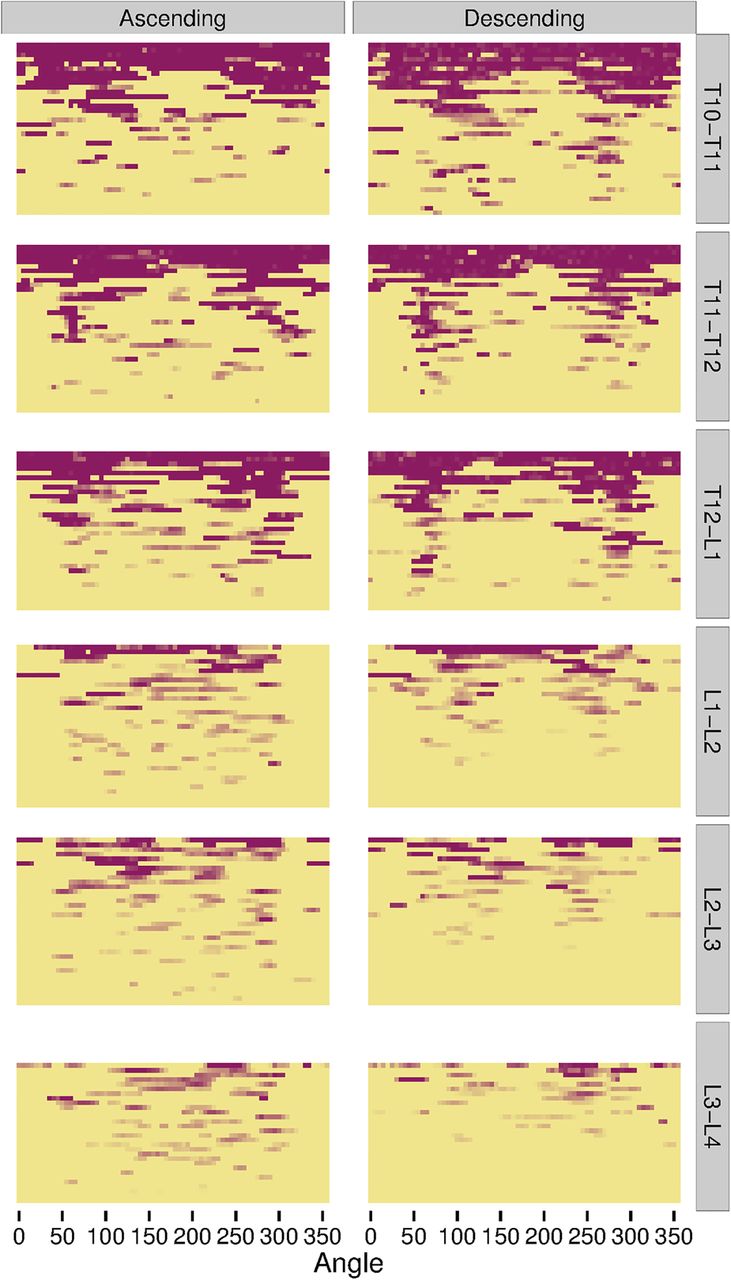
Heat map of locations of ascending and descending syndesmophytes in each of the 208 intervertebral disc spaces, stratified by vertebral level. Each row represents one intervertebral disc space. Colour intensity is proportional to syndesmophyte height, with yellow indicating no syndesmophyte, light purple indicating small syndesmophytes and deep purple for areas of bridging. Intervertebral disc spaces were ordered by their total circumferential height, from most involved (completely bridged) at the top to least involved at the bottom.
To determine if ascending or descending syndesmophytes likely developed first, we compared mean syndesmophytes heights along the vertebral rim for IDSs with syndesmophytes no taller than 0.50 (ie, one-half the IDS height). In these IDSs, ascending syndesmophytes were taller than descending syndesmophytes at almost all locations (figure 6). This was particularly pronounced anteriorly, where there were few descending syndesmophytes. However, there may be variations with vertebral level. Small ascending syndesmophytes were more common in the three lumbar IDSs than in the three thoracic IDSs (figure 5).

Mean heights along the rim of the superior vertebral endplate, including any ascending syndesmophytes (solid line) and the inferior vertebral endplate, including any descending syndesmophytes (dashed line), in intervertebral disk space with a tallest syndesmophyte of 0.50 or less. A, anterior; AL, anterolateral left; AR, anterolateral right; IDS, intervertebral disc space; P, posterior; PL, posterolateral left; PR, posterolateral right.
Discussion
In this study, use of CT scanning provided new information on the spatial distribution of syndesmophytes in AS. The first major finding was that syndesmophytes did not occur randomly around the vertebral rim. They occurred predominantly at the lateral vertebral rim (more at the posterolateral rim than anterolateral rim), and less commonly at the anterior and posterior regions of the rim. This localisation was particularly pronounced for descending syndesmophytes. Second, both small syndesmophytes and focal bridging demonstrated localisation to the posterolateral vertebral rim. Third, the propensity for localisation varied with the vertebral level. Syndesmophytes at T10-T11, T11-T12 and T12-L1 levels exhibited a progressively accentuated bimodal distribution with preferential localisation at the posterolateral rim. This localisation was either absent or diminished at L1-L2, L2-L3 and L3-L4. Fourth, among IDSs without extensive syndesmophytes, ascending syndesmophytes were commonly taller than their counterparts on the opposing endplate.
These results suggest an outline for the development of syndesmophytes in AS. Syndesmophytes most often develop first at the posterolateral rim, and more often on the superior vertebral endplate of the IDS. With time, these syndesmophytes grow in height and are later accompanied by new syndesmophytes descending from the opposing vertebral endplate. Additional syndesmophytes develop at other locations in the IDS, particularly in the anterolateral locations, with large posterolateral syndesmophytes and smaller anterolateral syndesmophytes typical (see figure 1B for instance). Focal bridging occurs first at the posterolateral rim, with discontinuous bridges developing later at other regions of the IDS. Bridges then grow circumferentially to join and may eventually enclose the IDS. There are variations to this scenario in the lower lumbar levels where anterolateral syndesmophytes may grow simultaneously with posterolateral syndesmophytes or even precede them.
The posterolateral predominance of syndesmophytes is interesting because it provides insight into potential mechanisms involved in their development. If enthesitis or osteitis was the sole determinant of syndesmophyte development, this pattern of localisation might not be expected, because inflammation would be expected to occur randomly throughout the vertebral/disc unit and around the vertebral rim, as shown by spinal MRI.6 In contrast, syndesmophytes preferentially localise in the region known to orthopaedists and biomechanical engineers as the middle column of the spine, which is defined as the posterior half of the vertebral body excluding the neural arch. The middle column is so defined because its biomechanical properties and reaction to trauma differ from that of either the anterior vertebral bodies or posterior elements.15 Mechanical stress in the lumbar spine is concentrated at the base of the pedicles and the middle column, which includes the posterior parts of the vertebral bodies.16 The finding that syndesmophytes are more likely to occur, and likely first develop, at the posterolateral rim suggests that mechanical forces may play an important role in their development. This hypothesis is consistent with other clinical and experimental evidence supporting a role of biomechanics in syndesmophyte development, as well as with the large literature on the role of mechanical stress in bone formation.17–20 There is some evidence that inflammation in AS is common in the transverse and spinous processes and pedicles,21 which neighbours the localisation we observed in the lateral vertebral body. It may be that the combination of inflammation and mechanical stress predisposes the posterolateral vertebral rim to syndesmophyte development, or that the mechanical forces in this region predispose it to more inflammation, or more persistent inflammation. Detailed three-dimensional studies of the distribution of inflammatory lesions in the vertebral bodies are needed to examine this question.
Variation in the localisation of syndesmophytes by vertebral level may further suggest a role of biomechanics in syndesmophyte growth. The localisation was prominent and similar for the three thoracic IDSs, but was generally not present at L1-L2, L2-3 and L3-L4. The sagittal orientation is similar for the lower thoracic vertebrae, but lordosis changes the orientation of the lumbar vertebrae, and plausibly the distribution of mechanical forces within the vertebrae. This might explain the differences in syndesmophyte distribution by vertebral level that we observed. Further study of the mechanical stresses at each spinal level may be informative.
Our study has several limitations. We examined a relatively small sample, which did not permit examination of differences by sex, duration of AS or other characteristics. However, the study had few inclusion criteria, and subjects were considered representative. Studying a larger sample longitudinally would allow better determination of where new syndesmophytes most commonly form, and would provide a test of our proposed model of development. We did not measure mechanical stress in the spine, and therefore can only infer its possible role in syndesmophyte localisation. We examined only six IDS in the thoracolumbar spine. The spatial distribution of syndesmophytes may be different in the cervical or upper thoracic spine. In our study, the height of posterolateral syndesmophytes relative to anterolateral syndesmophytes may be exaggerated by the fact that disc height within an IDS is variable and is usually larger anteriorly. This variability is larger for the more inferior IDSs.
Our findings have several implications in addition to the mechanistic hypotheses that they raise. The relatively uncommon presence of anterior syndesmophytes, and their presumed development later than syndesmophytes in the posterolateral region of the IDS, calls into question the reliance on plain radiography in general, and the modified Stoke Ankylosing Spondylitis Spine score in particular, for studies of biomarkers of spinal fusion and of radiographic progression. Correlations between biomarkers and the presence or progression of anterior syndesmophytes alone may not provide valid assessments if extensive syndesmophytes are present or are developing in other areas of the vertebral rim. Focus on anterior vertebral corners also diminishes the information contributed by each patient by omitting the regions of the vertebral bodies where syndesmophytes appear to develop most often. Substantial syndesmophytes may be present in the posterolateral or anterolateral rim without involvement of the anterior rim. Although CT involves greater radiation exposure than radiographs, the improved quality of information provided should allow research questions to be addressed more definitively and with fewer patients. These considerations suggest that wider use of CT scanning and the three-dimensional information it provides offer the best prospect for advancing research on syndesmophyte development in AS.
Acknowledgments
We thank Lori Guthrie, RN and Amanda Bertram for assistance.
References
Footnotes
Handling editor Tore K Kvien
Contributors MMW conceived the study. ST, JY, LY, JAF and MMW designed the study and ST, AD and MMW did the analysis. MMW drafted the manuscript and all authors provided critical review and approval of the final version.
Funding This work was supported by the Intramural Research Program, National Institute of Arthritis and Musculoskeletal and Skin Diseases, National Institutes of Health, and by the Clinical Center, National Institutes of Health, and the Johns Hopkins University School of Medicine General Clinical Research Center (grant number M01-RR00052 from the National Center for Research Resources/NIH).
Competing interests None declared.
Ethics approval NIAMS/NIDDK Institutional Review Board; Johns Hopkins Medical Institutions Institutional Review Board.
Provenance and peer review Not commissioned; externally peer reviewed.
Data sharing statement Data will be publicly available at the conclusion of the study.