Article Text

Abstract
Objectives To compare glucose tolerance and parameters of insulin sensitivity and β-cell function between chronic glucocorticoid (GC)-using and GC-naive patients with rheumatoid arthritis (RA).
Methods Frequently sampled 75 g oral glucose tolerance tests were performed in 58 chronic GC-using and 82 GC-naive patients with RA with established disease, with no known type 2 diabetes mellitus (T2DM), and 50 control subjects of comparable age with normal glucose tolerance. The associations between cumulative GC dose and disease characteristics and glucose tolerance state, insulin sensitivity and β-cell function were tested using multivariate linear and logistic regression models, correcting for patient characteristics.
Results Glucose tolerance state, insulin sensitivity and β-cell function did not differ between the two RA populations; de novo T2DM was detected in 11% and impaired glucose metabolism in 35% of patients with RA. In patients with RA, cumulative GC dose was associated with T2DM, which seemed mostly driven by the effects of cumulative GC dose on insulin resistance; however, the association decreased when corrected for current disease activity. Patients with RA had decreased insulin sensitivity and impaired β-cell function compared with controls, and multivariate regression analyses showed a negative association between the presence of RA and insulin sensitivity.
Conclusions GC-using and GC-naive patients with RA had comparable metabolic parameters, and had decreased insulin sensitivity and β-cell function as compared with healthy controls. Although cumulative GC dose was shown to have a negative impact on glucose tolerance state and insulin sensitivity, confounding by indication remains the main challenge in this cross-sectional analysis.
Statistics from Altmetric.com
Introduction
Patients with rheumatoid arthritis (RA) are at increased risk of developing cardiovascular disease, comparable to the risks seen in subjects with type 2 diabetes mellitus (T2DM).1 Additional impairment of glucose metabolism may contribute significantly to the accelerated atherogenesis in patients with RA.2 Fasting and postprandial glucose metabolism are determined by β-cell function (insulin production) and by the peripheral effects of insulin (insulin sensitivity) which increases glucose uptake in skeletal muscle and decreases glucose production by the liver. Glucocorticoids (GCs) impair hepatic and peripheral insulin sensitivity and induce β-cell dysfunction; however, the precise underlying mechanisms are still being investigated.3 4 Previously, patients with RA were shown to have impaired fasting insulin sensitivity (homoeostatic model assessment of insulin resistance (HOMA-IR) and fasting β-cell function (HOMA-B)), which correlated with disease activity and markers of inflammation.5,–,7 Consequently, prevalent diabetes was estimated to be up to 15–19% in patients with RA,8 9 an increased number as compared with the estimated T2DM prevalence of 4–8% in middle-aged men and women in the general population.10
The role of GCs in glucose intolerance in patients with RA has been one of paradox. Other than the electrolyte balance-regulating activity of their family member mineralocorticoids, GCs derived their name through their carbohydrate-regulating abilities.11 GCs play essential roles in glucose, lipid and protein metabolism in the fasted state, providing substrate for oxidative metabolism by increasing adipose tissue lipolysis (glycerol and non-esterified free fatty acids), skeletal muscle proteolysis and hepatic glucose production.12 The effects of GCs on glycogenolysis and glycogen synthesis are at present less clear. It is evident that GCs increase endogenous glucose production by the liver by enhancing gluconeogenesis. The contribution of glycogenolysis to endogenous glucose production is less well established.13 On the one hand, in animal models and in short-term clinical trials in healthy subjects, GCs were shown to impair glucose metabolism by weakening hepatic and peripheral insulin sensitivity and by inducing β-cell dysfunction.13 In retrospective, population-based studies, GC therapy was associated with incident diabetes,14 and the need for blood-glucose-lowering treatment in a cumulative dose-dependent way.15 In retrospective studies in patients with RA, GC exposure was shown to correlate with insulin resistance,16 and to predict diabetes.17 On the other hand, the use of GCs in chronic inflammatory states may improve glucose tolerance by their anti-inflammatory effects, as was demonstrated in a number of short-term studies using GC treatment;18 19 this was also shown in a study using methotrexate.20 In addition, confounding by indication should be kept in mind when evaluating the relation between GC use and glucose tolerance in patients with RA in observational studies. This is the possibility that patients with higher cumulative inflammation (ie, higher disease activity), resulting in a priori increased insulin resistance, were more likely to be given high-dose GCs than those with less inflammation (disease) activity. Thus, the impact of GC treatment on glucose metabolism in patients with RA requires further clarification.
Previous studies that have examined the effects of GCs on glucose tolerance, insulin sensitivity and β-cell function in patients with RA included a small number of patients,18 or relied solely on fasting parameters, that is, HOMA-IR and HOMA-B.16 As mentioned above, as insulin sensitivity and insulin secretion are inter-related, the use of the HOMA formulas, both of which use the same fasting variables—that is, fasting plasma insulin and glucose, may not be appropriate to discern changes in insulin sensitivity from changes in insulin secretion.21 For instance, if two subjects have the same fasting glucose level, but, one person achieves this with higher fasting insulin levels, this person is more insulin resistant (thus has lower insulin sensitivity), which is expressed by a higher HOMA-IR score. Similarly, from fasting glucose and insulin levels, a HOMA-B score is calculated which gives an impression of β-cell function. Although these model-derived indices are well validated, they provide no information about the stimulated, postload state.21 From dynamic tests, such as the frequently sampled oral glucose tolerance test (OGTT), indices of postload insulin sensitivity and glucose-stimulated β-cell function may be calculated, in order to provide more detailed information on glucose metabolism.22
Therefore, in this study, we compared glucose tolerance and (fasting and dynamic) parameters of insulin sensitivity and β-cell function from frequently sampled OGTTs in a large group of chronic GC-using patients with RA versus GC-naive patients with RA. Furthermore, we included a control group of comparable age to create a perspective of our OGTT findings in patients with RA, and to assess the association of RA itself with measures of insulin sensitivity and β-cell function in subjects with normal glucose tolerance. Finally, we assessed the association between cumulative GC dose and disease characteristics with these metabolic parameters.
Methods
Population
Patients with RA with established disease—that is, defined as having a disease duration of >2 years, were recruited in four rheumatology clinics in the region of Utrecht, The Netherlands. Patients were either current and chronic GC users (RA+GC), which indicated GC treatment for at least 3 months, or they were GC usage naïve (RA−GC). Known T2DM (defined as receiving treatment) was an exclusion criterion. We included a control group (controls) with normal glucose tolerance and without first-degree relatives with T2DM, consisting of individuals who had undergone an OGTT for screening purposes for other studies at the Diabetes Centre of the VU University Medical Centre in Amsterdam. Accordingly, this group consisted of relatively overweight predominantly male individuals. We did not match the control population to the RA population, since our main focus was on studying the effects of GCs in patients with RA (particularly compared with GC-naive patients with RA). The healthy control group in our study served to show the perspective of the values in the patients with RA. An independent ethics committee approved the study and all subjects provided written informed consent before participation; the protocol was according to the ‘Declaration of Helsinki’.
Protocol
Participants visited the clinic after an overnight fast of a minimum of 10 h. A physical examination, including recording of height, weight and waist circumference was performed and fasting blood tests were carried out in all patients. In the patients with RA, in addition, the Disease Activity Score (DAS28 and DAS28-C-reactive protein)23 24 was calculated; history of disease-modifying antirheumatic drug (DMARD) taking, laboratory measurement of anti-citrullinated protein antibodies (ACPA) and x-ray examinations of hands and feet (to detect erosive damage) were also performed. Finally, all participants underwent a 2 h 75 g OGTT. Blood samples for determination of glucose, insulin and C-peptide were collected at times 0, 10, 20, 30, 60, 90 and 120 min, starting immediately after the ingestion of the 75 g glucose solution. Since insulin clearance may vary considerably between subjects,25 plasma C-peptide levels may provide additional information on β-cell function.
Analytical determinations
Plasma glucose was measured using a chemical technique on a DXC-800 analyser (Beckman Coulter, Los Angeles, California, USA). Plasma insulin was measured using an immunometric technique on an IMMULITE 1000 Analyzer (Siemens Medical Solutions Diagnostics, Los Angeles, California, USA). Plasma C-peptide was measured using an electrochemiluminescence immunoassay on the Modular E170 (Roche Diagnostics GmbH, Mannheim, Germany).
Data analysis
Normal glucose tolerance was defined as fasting plasma glucose (FPG) <6.1 mmol/l and a 2 h glucose value <7.8 mmol/l; impaired glucose metabolism (IGM) as FPG between 6.1 and 7.1 mmol/l or a 2 h glucose value between 7.8 and 11.1 mmol/l; T2DM as FPG >7.1 mmol/l or a 2 h glucose value >11.1 mmol/l. Areas under the 2 h glucose (AUCgluc), insulin (AUCins) and C-peptide (AUCc-pep) curves were determined using the trapezoidal rule. Insulin sensitivity in the fasted state was computed by HOMA-IR.26 Estimated metabolic clearance rate (MCRest/Stumvoll Index) and oral glucose insulin sensitivity (OGIS) were used to estimate postload insulin sensitivity.27 Various measures of β-cell function were calculated: HOMA-B was derived from fasting measures.26 Dynamic measures of β-cell function were derived from OGTT data and included: AUCc-pep/AUCgluc ratio over the 2 h period and the Insulinogenic Index (IGI): (insulint=30−insulint=0)/(gluct=30−gluct=0), as measures of early insulin secretion.28 The oral Disposition Index (DI) was calculated by multiplying IGI and OGIS, to adjust insulin secretion for insulin sensitivity. Insulin clearance was calculated by dividing AUCc-pep and AUCins.25
Statistical analysis
Comparison of parameters of glucose tolerance state, insulin sensitivity and β-cell function of RA±GC groups and controls
Data were presented as mean values±SD and as median (IQR) for non-normal distribution. Intergroup differences in continuous outcomes were tested by analysis of variance, and with the Kruskal–Wallis tests in cases of non-normal distribution. Differences between groups in dichotomous outcomes were tested with the χ2 test. Post hoc Bonferroni correction was applied to multiple testing by multiplying the p value by 2 (3 groups minus 1).
Associations between patient and disease characteristics and parameters of glucose tolerance state, insulin sensitivity and β-cell function
Associations between known determinants of insulin sensitivity and β-cell function (age, waist circumference, body mass index (BMI) and insulin clearance) and gender, and, within the RA populations, cumulative and daily GC dose and disease activity (DAS28 and its components, DMARD use, hand or feet erosions on x-ray examination, ACPA) and parameters of insulin sensitivity and β-cell function were investigated with linear regression analysis; associations of the above factors with IGM and T2DM were investigated with logistic regression analyses. Non-normally distributed variables were log transformed when used in multivariate linear regression analysis. In the multivariate analyses with OGTT outcomes as dependent variable, where the RA populations were compared with the controls, patients with RA with previously unknown T2DM, IGM or with first-degree relatives with T2DM were excluded (ie, fitting the exclusion criteria of controls). SPSS for Mac version 16.0 (SPSS, Chicago, Illinois, USA) was used for all statistical analyses. A p value <0.05 was considered statistically significant.
Results
Baseline characteristics
After screening 167 patients with RA, a total of 140 middle-aged patients with established RA were included; 82 were GC naïve (RA−GC) and 58 were current GC users (RA+GC). Of the 27 excluded patients with RA, 16 were patients with known T2DM (11 RA−GC and 5 RA+GC). In addition, 50 controls with comparable age were recruited. Subject characteristics are provided in table 1. As compared with patients with RA, controls had a higher percentage of male gender, and had a higher BMI and waist circumference; these factors were corrected for in the multivariate models. The RA groups had similar anthropometrics, but RA+GC had higher disease activity than RA−GC (table 1).
Baseline characteristics
Glucose tolerance state
The prevalence of previously unknown T2DM was comparable between the two RA groups (table 1). If those patients with RA who were excluded because of known T2DM (n=27) had been included, then the prevalence of T2DM would have been 19% (RA−GC 18% vs RA+GC 21%, p=0.9). Within the RA groups, both cumulative and daily prednisolone dose was associated with incident T2DM in univariate analyses (OR cumulative dose (g): 1.04; p=0.002; daily dose (mg): 1.13; p=0.048). This association was sustained after adjusting for disease activity and patient characteristics (DAS28, ACPA, erosions, DMARD history, disease duration, age, BMI, waist circumference and gender; OR cumulative dose (g): 1.04; p=0.03; daily dose (mg): 1.15; p=0.13), whereas it was decreased and less significant (a trend) after adjustment for current disease activity alone and patient characteristics (DAS28, age, BMI, waist circumference and gender; OR cumulative GC dose (g): 1.02; p=0.08; daily dose (mg): 1.11; p=0.3).
Metabolic responses during OGTT
Glucose levels during the OGTT did not differ between the RA groups, whereas AUCgluc was higher in patients with RA than in controls, which was mostly driven by higher glucose levels during the final 90 min of the test (figure 1A). Insulin levels were comparable between all groups (figure 1B); however, C-peptide secretion was higher in the RA groups than in controls (figure 1C), with no difference between the RA groups, indicating increased insulin clearance in patients with RA as compared with controls (data not shown). Insulin clearance was decreased in RA+GC as compared with RA−GC (data not shown).

Glucose and insulin levels during oral glucose tolerance test (OGTT). Mean (±SD) of glucose and C-peptide levels, respectively, are shown during an OGTT for control subjects (control), GC-naive patients with RA (RAGC–) and GC-using patients with RA (RAGC+). Intergroup differences were tested by analysis of variance, and with the Kruskal–Wallis test in cases of non-normal distribution. Post hoc Bonferroni correction was applied in cases of multiple testing (p value × 2). GC, glucocorticoid; RA, rheumatoid arthritis.
Parameters of insulin sensitivity
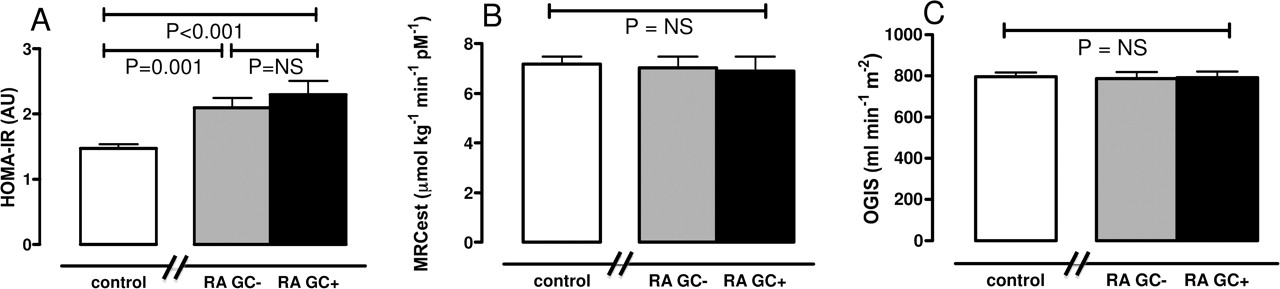
Parameters of both fasting (figure 2A) and postload insulin sensitivity (figure 2B,C) were comparable between the RA groups. In multivariate linear regression analyses (correcting for age, gender, BMI, waist circumference and disease activity) the presence of RA, waist circumference and cumulative GC dose were independent predictors of HOMA-IR (table 2). MCRest was negatively associated with DAS28, erythrocyte sedimentation rate, age, BMI and waist circumference (table 2); a similar pattern was observed for OGIS (data not shown). The healthy control group was more insulin sensitive in the fasted state, but had similar postload insulin sensitivity to that of the RA groups.

Insulin sensitivity indices. Mean (±SD) of insulin sensitivity indices (A) HOMA-IR (Fasting Index), and of the dynamic parameters (B) MCRest Index and (C) oral glucose insulin sensitivity (representing glucose clearance during a 2 h oral glucose tolerance test) are shown. Intergroup differences were tested by analysis of variance, and with the Kruskal–Wallis test in case of non-normal distribution. Post hoc Bonferroni correction was applied in cases of multiple testing (p value × 2). GC, glucocorticoid; HOMA-IR, homoeostatic model assessment of insulin resistance; MCRest, estimated metabolic clearance rate; RAGC−, GC-naïve patients with RA; RAGC+, GC-using patients with RA.
Association of risk factors and disease characteristics with HOMA-IR and MCRest
Parameters of β-cell function
HOMA-B was higher in RA+GC than in RA−GC (figure 3A), while all dynamic measures of β-cell function were comparable between the RA groups (figure 3B,D). Positive associations between the presence of RA and cumulative GC use with HOMA-B were found (corrected for age, gender, BMI, waist circumference and disease activity; data not shown). Age and both RA-GC and RA+GC were negatively associated with IGI (corrected for age, gender, BMI, waist circumference; data not shown), whereas no patient characteristics correlated with the DI (table 3). As compared with healthy controls, patients with RA had higher basal C-peptide secretion (higher HOMA-B), but impaired early insulin secretion, also when corrected for insulin sensitivity (figure 3B,C). The total amount of C-peptide secreted during the entire OGTT relative to glucose levels, was higher in patients with RA than healthy controls (figure 3D).

Parameters of β cell function. Mean (±SD) of β cell indices (A) HOMA-B (Fasting Index), and of the dynamic parameters (B) Insulinogenic Index and (C) Disposition Index, and of the (D) AUCc-pep/AUCgluc ratio are shown. Intergroup differences were tested by analysis of variance, and with the Kruskal–Wallis and Mann–Whitney tests in cases of non-normal distribution. Post hoc Bonferroni correction was applied in cases of multiple testing (p value × 2). AUC, area under the curve; DI, Disposition Index; GC, glucocorticoid; HOMA-B, homoeostatic model assessment of β cell function; IGI, Insulinogenic Index; RAGC−, GC-naïve patients with RA; RAGC+, GC-using patients with RA.
Association of risk factors and disease characteristics with the DI
Effect modification
As compared with patients with RA, controls had a higher percentage of male gender, and had a higher BMI and waist circumference; in addition, RA+GC patients had higher disease activity than RA-GC patients (table 1). These factors were studied for effect modification using interaction terms in the regression models mentioned below, and were shown not to modify the effects of patient and disease characteristics on glucose metabolism outcomes in the multivariate models (data not shown).
Discussion
In this study of patients with RA with established disease, chronic GC users and GC-naive patients had similar insulin sensitivity and β-cell function parameters; however, high cumulative or daily GC dose was associated with T2DM. In addition, in all patients with RA IGM and T2DM were frequently diagnosed, suggesting that glucose intolerance remains an underestimated problem in RA. As compared with a healthy control group, patients with RA had impaired insulin sensitivity and β-cell dysfunction, explaining their impaired metabolic state.
To our knowledge, this is the first study that has examined glucose metabolism in a relatively large sample of patients with RA with established disease in such detail. A few studies investigated glucose tolerance state in RA. One study showed an increased prevalence of T2DM in comparison with age-matched controls29; another study reported a 19% diabetes prevalence as part of a longitudinal medical record cohort on cardiovascular risk.8 Both studies relied on self-reported T2DM and did not perform glucose measurements. Because of the OGTT measurements of glucose at 0 and 120 min we were now able to register 11% T2DM prevalence in patients with RA with established disease without known T2DM, and in addition, identify high-risk patients, by detecting 35% prevalence of IGM. This shows that glucose intolerance is a considerable and underestimated problem in patients with RA with established disease, and might (partially) explain their increased cardiovascular risk.1
The subject of insulin resistance in RA has been examined in recent years, but was only evaluated by the fasting measure HOMA-IR.2 5 6 Unlike these studies, we were able to show a negative association of DAS28 with insulin sensitivity after correcting for potential confounders and other risk factors, which might have been because we also used stimulated measures of insulin sensitivity and because our sample size was larger.
Another important finding of our study was impaired β-cell function in patients with RA as compared with controls, as was shown by the decreased dynamic parameters IGI and DI, also when correcting for age, BMI and waist circumference (in the case of IGI). This indicates impaired insulin secretion during the early phase after glucose stimulation. So far, a limited number of other studies have reflected upon β-cell function in RA, and only used the fasting state measure HOMA-B. In one retrospective study HOMA-B was reduced in patients with RA with a higher level of inflammation in comparison with patients with RA with a lower level of inflammation,6 which seems in line with our findings of impaired β-cell function in patients with RA compared with the control population. In our analysis, HOMA-B was higher in patients with RA, which indicates increased basal C-peptide secretion. This seems contradictory in view of the decrease in β-cell function parameters obtained in the stimulated state. However, HOMA-B should always be interpreted in the context of prevailing insulin resistance.21 In our study, RA+GC participants had higher HOMA-IR values—that is, they were more insulin resistant. In order to maintain fasting glucose levels within the normal range, more insulin was secreted in the fasted state, which resulted in a higher HOMA-B score. However, this higher HOMA-B score does not imply improved β-cell function, but merely indicates the potential to compensate for reduced insulin sensitivity.
In addition, we examined the specific role of (cumulative or daily) GC dose and disease characteristics within patients with RA and found strong indications that RA+GC patients were less glucose tolerant in a dose-dependent manner: Although no relation was shown between (cumulative or daily) GC dose and dynamic tests of insulin sensitivity and β-cell function, cumulative and daily GC dose were associated with previously unknown T2DM, and negatively affected fasting insulin sensitivity (HOMA-IR), independently of age, gender, BMI, waist circumference and disease activity. In addition, RA+GC patients had a decreased insulin clearance, indicating hepatic insulin resistance, which is explained by the steeper insulin curve in the first part of the OGTT. Our results are in line with one other retrospective study of non-diabetic patients with RA16; that study analysed a successive group of patients with RA and showed that ever having taken oral prednisone and/or high doses of pulsed GCs was independently associated with decreased insulin sensitivity independently of BMI.
We acknowledge some limitations in our study design; first, the difference in anthropometrics between controls (with normal glucose tolerance) and patients with RA—that is, controls were primarily recruited for other studies at the VUMC Diabetes Centre and therefore consisted of more male subjects and had a relatively high BMI, and lower insulin clearance. Compared with these control subjects, patients with RA were more insulin resistant and had more β-cell dysfunction. Although the use of this control population, as compared with more lean, insulin-sensitive controls, may be suboptimal, it is likely that the impact of RA and the associated proinflammatory state on glucose metabolism as described here, may even be underestimated. Besides, in multivariate analyses we corrected for these anthropometrics and, furthermore, the control subjects served mainly to create a perspective for the insulin resistance and β-cell parameters of patients with RA. A second point is confounding by indication that might have caused the effects of GCs on glucose metabolism, since cumulative GC use might be a proxy for long-term disease activity, which itself influences glucose metabolism. This was shown also in our study by a decrease of the regression coefficient (β) for the association between cumulative or daily GC dose and T2DM when disease activity (DAS28) was added to the multivariate regression model.
In conclusion, because of (1) the stimulated-state measurement of glucose metabolism parameters, (2) the size of our population and (3) the contrast with control subjects, we were able to draw firm conclusions about the prevalence of glucose tolerance abnormalities in patients with RA with established disease and to confirm the relation between RA (activity) and insulin resistance and β-cell dysfunction. Chronic GC use was associated with metabolic toxicity in a dose-dependent way, but this association was difficult to assess owing to confounding by indication.
Until there is more clarity about the problem of glucose intolerance in GC-using patients with RA, it remains important to keep the duration of GC use short and to use the lowest possible dose, as is advised by the European League Against Rheumatism recommendations on RA treatment,30 and on systemic GC use.31 The question of how harmful the diabetogenic effects of long-term GCs are in patients with established RA needs further assessment in longitudinal (randomised) trials. These trials should measure glucose metabolism with stimulated-state measures, and examine whether GCs exert direct metabolic toxicity or secondary toxicity owing to other GC-related phenomena, such as abdominal fat and adipocytokines, which are known mediators of metabolic toxicity in RA.32
Acknowledgments
This research was performed within the framework of project T1-106 of the Dutch Top Institute Pharma. Rheumatologists Heurkens from Meander Medisch Centrum Amersfoort, Van der Veen from St Jansdal Harderwijk, Kadir from Maartenskliniek Woerden, Schenk and VanBooma-Frankfort from Diakonessenhuis Utrecht, are thanked for recruiting patients.
References
Footnotes
-
Funding This research was performed within the framework of project T1-106 of the Dutch Top Institute Pharma.
-
Competing interests JNH, MCvdG, DHvR, NJvdZ, DdU, WFL, JWGJ, PMJW and JWJB declared no conflicts of interest. MD disclosed advisory board membership for Abbott, Eli Lilly, Merck Sharp & Dohme, Novo Nordisk and Poxel Pharma; is consultant for Astra Zeneca/BMS, Eli Lilly, Merck Sharp & Dohme, Novo Nordisk, Sanofi Aventis; is on the speaker's bureau for Eli Lilly, Merck Sharp & Dohme, Novo Nordisk; through MD the Diabetes Center, VU University Medical Center receives all fees related to the activities mentioned above, as well as research support from Amylin Pharmaceuticals, Eli Lilly, Merck Sharp & Dohme, Novartis, Novo Nordisk, Takeda.
-
Ethics approval This study was conducted with the approval of the University Medical Center Utrecht.
-
Provenance and peer review Not commissioned; externally peer reviewed.