Article Text

Abstract
Objective: To examine the relationship between longitudinal fluctuations in synovitis with change in pain and cartilage in knee osteoarthritis.
Methods: Study subjects were patients 45 years of age and older with symptomatic knee osteoarthritis from the Boston Osteoarthritis of the Knee Study. Baseline and follow-up assessments at 15 and 30 months included knee magnetic resonance imaging (MRI), BMI and pain assessment (VAS) over the last week. Synovitis was scored at 3 locations (infrapatellar fat pad, suprapatellar and intercondylar regions) using a semiquantitative scale (0–3) at all 3 time points on MRI. Scores at each site were added to give a summary synovitis score (0–9).
Results: We assessed 270 subjects whose mean (SD) age was 66.7 (9.2) years, BMI 31.5 (5.7) kg/m2; 42% were female. There was no correlation of baseline synovitis with baseline pain score (r = 0.09, p = 0.17). The change in summary synovitis score was correlated with the change in pain (r = 0.21, p = 0.0003). An increase of one unit in summary synovitis score resulted in a 3.15-mm increase in VAS pain score (0–100 scale). Effusion change was not associated with pain change. Of the 3 locations for synovitis, changes in the infrapatellar fat pad were most strongly related to pain change. Despite cartilage loss occurring in over 50% of knees, synovitis was not associated with cartilage loss in either tibiofemoral or patellofemoral compartment.
Conclusions: Change in synovitis was correlated with change in knee pain, but not loss of cartilage. Treatment of pain in knee osteoarthritis (OA) needs to consider treatment of synovitis.
Statistics from Altmetric.com
The cause of pain in knee osteoarthritis remains elusive as the primary site of pathology in OA, cartilage, has no pain fibres.1 Many other structures around the knee such as the periosteum, subchondral bone, the fat pad, capsule and, inconsistently, the synovium have been shown to contain nociceptive fibres.1 In addition, inflammation itself appears to play a role in increasing input from peripheral nociceptors.2 Biopsies of patients with both early and late knee OA have shown low-grade chronic synovitis with production of pro-inflammatory cytokines.3 4
Magnetic resonance imaging (MRI) allows evaluation of multiple structures within the knee, including synovium, cartilage, menisci, bone marrow lesions and effusion. In cross-sectional studies of MRI in knee osteoarthritis (OA), bone-marrow lesions, periarticular lesions, knee effusions and synovitis have been shown to be more often present in persons with knee pain than in persons with a comparable amount of radiographic knee osteoarthritis but without pain.5–8 Fernandez-Madrid et al demonstrated that synovial thickening seen on non-contrast enhanced MRI in the infrapatellar region of knees with OA showed low-grade synovial inflammation on biopsy. This feature was present in 73% of knees with early OA.9
We have previously shown that this synovial thickening is present in persons with knee pain and OA much more often than in persons with OA but without pain.7 Among those with pain, the presence of MRI synovial thickening identified those with more severe pain. While this evidence suggests that synovial thickening may affect pain, these data are cross-sectional, making it impossible to evaluate the temporal relation of pain with synovial thickening. More persuasive evidence would emanate from a longitudinal study in which fluctuations in synovial thickening could be tied to fluctuations in the severity of knee pain. Herein, we provide such evidence. Our aims were to study the association between baseline and longitudinal changes in MRI-detected synovitis and changes in knee pain, and also to study the association between baseline and longitudinal changes in synovitis and cartilage loss in patients with symptomatic knee OA.
PATIENTS AND METHODS
Study population
Patients were recruited to participate in a natural history study of symptomatic knee OA, the Boston Osteoarthritis of the Knee Study. The recruitment for this study has been described in detail elsewhere.10 Briefly, patients were recruited from two prospective studies, one in men and one in women, of quality of life among veterans; from clinics at Boston Medical Center in Boston, Massachusetts; and from advertisements in local newspapers. Potential participants were asked two questions: “Do you have pain, aching, or stiffness in one or both knees on most days?” and “Has a doctor ever told you that you have knee arthritis?” For patients who answered yes to both questions, we conducted a follow-up interview in which we asked about other types of arthritis that could cause knee symptoms. If no other forms of arthritis were identified, then the individual was eligible for recruitment. A series of knee radiographs (PA, lateral and skyline) were obtained for each patient to determine whether radiographic OA was present. If patients had a definite osteophyte on any view in the symptomatic knee, they were eligible for the study. Because they had frequent knee symptoms and radiographic OA, all patients met American College of Rheumatology criteria for symptomatic knee OA.11
The study included a baseline and follow-up examinations at 15 and 30 months. At baseline, patients who did not have contraindications to MRIs had an MRI of the more symptomatic knee. MRIs of the same knee were also performed at follow-up visits. At each visit, pain in the imaged knee over the past week was assessed using a visual analogue scale (VAS, 0–100), and subjects were weighed with shoes off on a balance-beam scale. The Institutional Review Boards of Boston University Medical Center and the Veterans Administration Boston Health Care System approved the study.
MRI measurements
All MRIs were performed with a Signa 1.5T system (General Electric, Milwaukee, WI) using a phased-array knee coil. A positioning device was used to ensure uniformity among patients. Coronal, sagittal and axial images were obtained. Fat-suppressed spin-echo proton density and T2-weighted images (repetition time, 2200 ms; echo time, 20/80 ms) with a slice thickness of 3 mm, a 1-mm interslice gap, one excitation, a field of view of 11–12 cm, and a matrix of 256×128 pixels were obtained.
Cartilage morphology was assessed by a musculoskeletal radiologist (AG) using a semiquantitative, multi-feature scoring method (whole-organ magnetic resonance imaging score, WORMS) for whole-organ evaluation of the knee that is applicable to conventional MRI techniques.12 Intraclass correlation coefficients of agreement among the readers for cartilage readings ranged from 0.72 to 0.97.
Tibiofemoral cartilage on MRI was scored on all 5 plates (central and posterior femur; anterior, central and posterior tibia) in each of the medial and lateral tibiofemoral joints. The anterior femur was not included in this analysis, as this is part of the patellofemoral joint. Patellofemoral cartilage was scored on 4 plates (medial and lateral patella, and medial and lateral anterior femur). These were read using the fat-suppressed T2-weighted FSE images on a 7-point scale: 0 = normal thickness and signal; 1 = normal thickness but increased signal on T2-weighted images; 2 = partial-thickness focal defect <1 cm in greatest width; 3 = multiple areas of partial-thickness (Grade 2) defects intermixed with areas of normal thickness, or a Grade 2 defect wider than 1 cm but <75% of the region; 4 = diffuse (⩾75% of the region) partial-thickness loss; 5 = multiple areas of full-thickness loss wider than 1 cm but <75% of the region; 6 = diffuse (⩾75% of the region) full-thickness loss.
In WORMS, grade 1 does not represent a morphological abnormality but rather represents a change in signal in cartilage of otherwise normal morphology. Grades 2 and 3 represent similar types of abnormality of the cartilage, focal defects without overall thinning. Scores of 1 and 2 were exceedingly unusual. Therefore, to create a consistent and logical scale for evaluation of cartilage morphological change, we collapsed the WORMS cartilage score to a 0–4 scale, where the original WORMS scores of 0 and 1 were collapsed to 0, the original scores of 2 and 3 were collapsed to 1, and the original scores of 4, 5 and 6 were considered 2, 3 and 4, respectively, in the new scale.13 The intraobserver agreement for reading of cartilage morphology ranged from 0.65 to 0.78 (kappa). We defined a lesion as occurring in either the medial or lateral tibiofemoral compartment if it was present in the femur or tibia of that compartment. While we conducted analyses using this collapsed WORMS cartilage scale, analyses using the original scale yielded the same results.
On the baseline and follow-up MRIs, effusion was scored 0–3 based on volume. Bone-marrow lesions were scored only on the baseline MRIs using the WORMS scale also in which lesions are scored according to their size (0–3) within quadrants of the femur and tibia.
Synovial reading
Synovial thickening on MRI using sagittal T2-weighted and proton-density sequences was scored separately at 3 locations (infrapatellar fat pad, suprapatellar and intercondylar regions) using a semiquantitative scale (0–3) at all 3 time points (fig 1). Given the confirmation that these MRI findings connote inflammation in the synovium, we shall label these findings as synovitis.
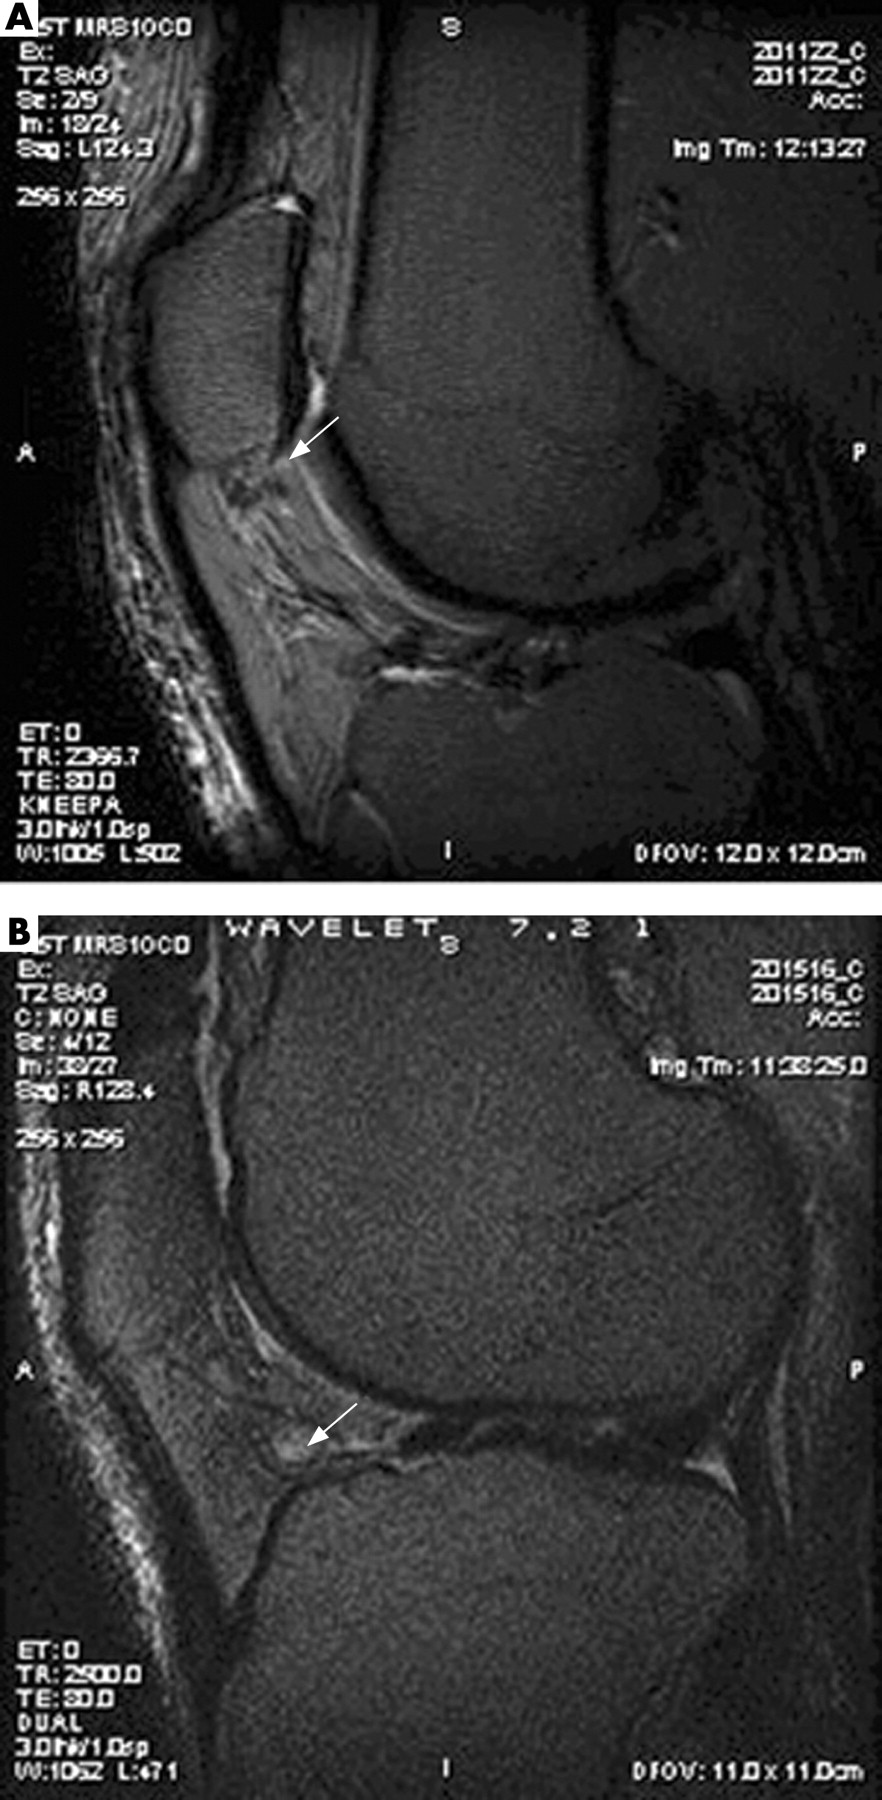
One reader (CLH) read synovitis on MRI’s. For each subject, MRIs were blinded to subject’s identity and read paired and in sequential order. The intraobserver agreement (kappa) for infrapatellar fat pad synovitis score was 0.63, intercondylar 0.49 and suprapatellar 0.20.
Validation of non-gadolinium synovitis scoring
To validate non-gadolinium scoring, 20 subjects with knee OA at University of Leeds underwent MRI using a sagittal T2 weighted fat suppressed sequence and a gadolinium enhanced T1 weighted fat-suppressed sequence. A trained reader scored the infrapatellar fat pad for synovial thickening on a 0–3 scale using just the T2 sequence without reference to other sequences (as above). The same reader then scored the infrapatellar synovitis using the same scoring system using just the postgadolinium sagittal sequence again without reference to other sequences. The films were blinded and presented to the reader in random order for the 2 reads, which took place 1 week apart. Of the 20 knees, 13 showed contrast (gadolinium) enhanced and non-contrast enhanced scores that were identical (ranging from 0 to 3). As expected, in 6 knees, the non-gadolinium images underestimated the amount of synovial thickening seen on the contrast enhanced image. Only one knee showed an over-reading of synovial thickening on the non-contrast image (score of 2 vs 1).
Analysis
Synovitis scores at each location were added to give a summary synovitis score at each time point (0–9). Changes in synovitis score were calculated at each time point. In addition, an analysis was carried out for synovitis scores at each individual site.
To examine whether differences in VAS pain score can be explained by differences in synovitis both cross-sectionally and longitudinally, we applied the generalised estimating equation to test this hypothesis with the following statistical model:
Yit = β0+β1Xi0+β2(Xit–Xi0).
where Yit is the pain score assessed at baseline, at 15 months and at 30 months. Xi0 is the synovitis assessed at baseline, and Xit is the corresponding measure of synovitis assessed at time t, that is, baseline, 15 months and 30 months, respectively. The coefficient β1 measures the cross-sectional association of the synovitis at baseline and VAS pain score, and β2 measures the effect of changes in synovitis on changes of VAS pain score.
The interpretation of the estimate from the model is the expected change in pain over time (from baseline to follow-up including both 15 and 30 months) per unit change in synovitis score in the corresponding follow-up period for a given subject.
To examine whether cartilage loss can be explained by baseline synovitis, we used cartilage loss in each compartment (medial tibiofemoral, lateral tibiofemoral, and patellofemoral) in 30-month follow-up for analyses unless unavailable, in which case cartilage loss in 15 months was used. Cartilage loss took whole number values from 0 (no loss) to 4 (maximum loss) and was analysed as ordered categories using the proportional odds logistic regression model. A generalised estimating equations correction was applied to the regression model to account for the association in the cartilage loss outcome between regions within a joint. For change in pain and cartilage loss, analyses were adjusted for baseline cartilage scores, age, sex, BMI, effusion score (0–3) and bone-marrow lesion score (using WORMS), and change in both bone-marrow lesion score and effusion score. For cartilage loss, we adjusted additionally for baseline WORMS based meniscal score.
A similar method was used to examine whether cartilage loss can be explained by synovitis change. The change in synovitis in a 30-month follow-up was used for analyses unless unavailable, in which case the change of synovitis in 15 month follow-up was used.
RESULTS
We assessed 270 subjects (158 male, 112 female) with at least one follow-up MRI. Two hundred and thirty-three subjects were followed for 30 months, and 37 subjects were followed for 15 months. Demographic details are recorded in table 1. The mean age of the subjects was 66.7 years, BMI 31.5 kg/m2 and VAS pain score 44.2 mm. Most knees had evidence of synovitis at one of the 3 sites at baseline, and about 40% had a change in knee synovitis over time (table 1). The presence of synovitis at baseline was significantly correlated with the baseline Kellgren–Lawrence radiological grade. The Spearman correlation was 0.44, 0.32, 0.27 and 0.39 for the Kellgren–Lawrence grade and summary synovitis, synovitis in infrapatellar fat pad, intercondylar and suprapatellar regions, respectively.
There was no correlation of baseline synovitis with baseline pain score (Pearson correlation coefficient r = 0.09, p = 0.17); an increase in synovitis score at basleine was correlated with a slightly higher baseline VAS pain score (adjusted estimate per increase in one unit of synovitis 0.72, 95% CI; −1.15, 2.59). However, there was a correlation of change of pain with change of synovitis score (r = 0.21, p = 0.0003; adjusted estimate of 3.15 VAS score change (on 0–100 scale) per unit change in synovitis score 95% CI; 1.04, 5.26. p = 0.003). However, the change in effusion score over time was not associated with pain change (adjusted estimate 1.19, 95% CI; −8.08, 10.46. p = 0.80). Similar results were seen in both males and females.
Of the 3 locations for synovitis examined separately, none of the baseline synovitis scores was associated with baseline pain (table 2). However, for each site, the change in synovial score was associated with pain change. This relation was strongest for the change in synovitis in infrapatellar and intercondylar fat pads in which there was a 5.7-mm and 4.9-mm increase in pain, respectively, per unit increase in synovitis. The relation between change in synovitis at the suprapatellar region and change in pain was not significant.
Despite cartilage loss occurring in over 50% of knees from baseline to follow-up, baseline synovitis score was not associated with cartilage loss in the patellofemoral compartment and only in those with higher grades of synovitis in the tibiofemoral compartment (table 3). The change in synovitis score was not associated with cartilage loss in medial or lateral tibiofemoral compartments, but there was a trend towards increased cartilage loss in the patellofemoral compartment in those with worsening synovitis scores (table 3).
DISCUSSION
Our study demonstrates that the change in synovitis over time was correlated modestly with changes in knee pain, but not at all with loss of cartilage. The correlation was direct—an increase in synovitis was associated with worsening pain and a decrease with less severe pain. This effect on pain was independent of changes in knee-joint effusion. We have demonstrated for the first time that longitudinal changes in synovitis reflect changes in pain in knee OA. We failed to find any association of synovial inflammation with cartilage loss.
Our findings regarding synovitis and cartilage loss are in keeping with previous cross-sectional findings of no association between arthroscopic synovitis or degree of synovial thickening on MRI and cartilage loss on MRI in a cross-sectional study.14 We found little association between the change in synovitis score and cartilage loss, suggesting that the two processes, synovitis and cartilage loss, are, for the most part, independent.
Synovial thickening in the infrapatellar region, detected on non-contrast MRI imaging, like that used in this paper, has been shown to represent low-grade synovial inflammation when biopsied in knee OA.9 The synovial scoring we used was based on a previous study that demonstrated a good correlation between the MRI semiquantitative scores and MRI synovial volume measurements, suggesting that semiquantitative synovitis scores are valid and enable feasible evaluation of the synovium in OA cohorts.15 Gadolinium-enhanced MRI remains the gold standard for the assessment of synovitis on MRI. Although, we did not use gadolinium in our study, we did validate non-gadolinium scoring and found that non-contrast images can provide a valid measure of synovitis, as demonstrated by gold-standard gadolinium-enhanced MR images in knee OA.
Intra-articular sources of pain in knee OA such as the synovium have been suggested by other studies which have demonstrated the analgesic properties of intra-articular instillation of local anaesthetic,16 low-dose morphine17 and steroid.18–20 Another recent study suggested that intra-articular anakinra (interleukin-1 receptor antagonist) given to 7 patients with knee OA resulted in an improvement in pain, which paralleled improvements in MRI synovial scores.21 Also, NSAIDs appear to have a superior effect over acetaminophen for treatment of knee OA in several studies, and this could be related to their anti-inflammatory properties.22 23 These studies, along with our observation that changes in pain are associated with changes in synovitis, suggest that treatment of synovitis may be a key element in the management of pain in knee OA. A limitation of our study was that we did not collect sufficiently detailed information on the use of analgesics and NSAIDs to allow this to be utilised in the analysis.
The relation we found of synovitis change with pain change was significant but only modest. This weak correlation (r = .21) may be because there are other causes of change in pain intensity in persons with knee osteoarthritis but may also be due to the crude scale for synovitis change we used and our inability to score synovitis in all sites in which it occurs within the knee. Further, we had difficulty identifying suprapatellar synovitis on non-contrast images, and that accounts for the poor reliability of readings at this site. It may also explain why we found stronger relations of pain change with synovitis at other knee sites. Even so, our findings suggest that synovitis is likely to contribute to the fluctuations in pain experienced by persons with symptomatic knee OA and needs confirmation.
In conclusion, in this longitudinal MRI study, we found that a change in synovitis score was associated with changes in pain score. We did not demonstrate any association between synovitis or its change and cartilage loss. Our findings have clear-cut implications for the treatment of painful osteoarthritis of the knee, as they suggest that treatments targeted to synovitis may improve pain.
Acknowledgments
We are indebted to the study participants for generously giving their time.
REFERENCES
Footnotes
Supported by NIH AR47785.
Competing interests: None declared.
- Abbreviations:
- MRI
- magnetic resonance imaging
- OA
- osteoarthritis
- VAS
- visual analogue scale
- WORMS
- whole-organ magnetic resonance imaging score