


Abstract
Objectives. The aims of this study were to study physical activity (PA) in patients with RA by accelerometry and to determine to what degree their mobility is affected by disease activity.
Methods. A group of 50 RA patients, without lower limb clinical disease, and 50 age- and sex-matched healthy controls were included in this cross-sectional study. PA was assessed by accelerometry and with the International Physical Activity Questionnaire (IPAQ). We performed multiple regression analysis not only to compare PA between groups, but also to explore the relation between RA features, including disease activity and cardiovascular risk parameters, and PA. In a randomized group of 30 RA patients a test–retest study was carried out in order to determine the correlation between variations in disease activity and PA.
Results. The number of minutes of moderate and vigorous activity per day, as evaluated by accelerometry, was significantly lower in RA patients than in healthy controls. In RA patients, accelerometry and IPAQ demonstrated concordance to a moderate degree [quadratic weighed kappa index 0.27 (0.06–0.48), P = 0.02]. HAQ negatively correlated with both IPAQ and accelerometry data. The 28-joint DAS using CRP (DAS28-CRP) was also inversely related with IPAQ. Framingham score and metabolic syndrome were inversely associated with PA in RA patients. Interestingly, variations in PA by accelerometry inversely correlated with changes in RA disease activity (r = −0.42, P = 0.02).
Conclusion. In RA patients, accelerometry is a reliable technique to evaluate PA. This study not only showed that RA patients spend less time doing moderate and vigorous PA than healthy controls, but also PA, as assessed by accelerometry, was sensitive to any changes in disease activity.
Introduction
Despite extensive data in the medical literature demonstrating the beneficial effects of physical activity (PA) on cardiovascular disease and all-cause mortality [1], sedentarism is a major health problem worldwide, particularly in developed countries. PA is defined as body movement generated by skeletal muscles that results in energy expenditure [2]. Accurate measurement of total daily energy expenditure is possible using the doubly labelled water technique [2]. However, this technique can be cumbersome and is not available in all centres. Alternative approaches to assess PA include the use of triaxial accelerometers [3] and patient questionnaires.
Accelerometry is considered an important advantage in objective PA measurement due to the fact that it can capture salient behaviour characteristics including the frequency, intensity and duration of PA, as well as resting periods. Although accelerometry has already been employed in clinical OA trials [4–6], until recently it has not been used to evaluate PA patterns in inflammatory joint disorders such as RA [7, 8]. This is surprising since estimates of PA, as well as PA scores based on questionnaires, have been shown to be less reliable than assessments of total energy expenditure using accelerometers under various conditions [9, 10].
RA is a chronic, systemic, inflammatory disorder of unknown aetiology that if left uncontrolled leads to the destruction and deformity of joints due to the erosion of cartilage and bone. Because the central pathology of RA occurs within the synovium of diarthrodial joints, pain, progressive inflammation and joint limitation are typical manifestations of the disease. Thus many RA patients tend to exercise less than what is currently recommended, which contributes to the increased cardiovascular risks observed with this disease [11]. For example, a study of PA in RA patients from 21 countries using a self-reporting questionnaire demonstrated that 60–80% were physically inactive, with no regular or weekly exercise. In this study, physical inactivity was associated with low a functional capacity and higher levels of disease activity, pain and fatigue [12]. Nevertheless, there is little data on the level of daily PA in RA patients vs healthy controls using objective procedures [13]. Moreover, there remain two important unanswered questions concerning PA vis-à-vis RA: (i) do patients who are sufficiently physically active suffer from less severe disease and (ii) does disease activity influence PA in RA patients? With regard to the former, there is considerably more evidence in favour of prescribing PA for RA patients than there is against [14]. However, there is currently no evidence that decisively answers the latter.
The main purposes of this study were to compare PA in a group of RA patients vs healthy controls through both objective (accelerometry) and subjective (IPAQ) methods and to explore the connection between disease inflammatory activity and PA in these patients. Secondary objectives were to assess the relationship of PA with both cardiovascular risk and quality of life in RA patients.
Methods
Study protocol
Clinical disease activity, disability, cardiovascular risk and PA were prospectively studied in a cohort of RA patients. At the same time, PA was determined in a group of healthy controls during basal visits. In addition to their basal visit, a group of RA patients was evaluated 6 months later. The institutional review board (Comite Etico de Investigacion Clinica del Hospital Universitario de Canarias) approved this study and all patients and controls signed a written informed consent.
Sample size
The number of patients recruited for this research was based on the results of a preliminary study. We assessed PA in 15 RA patients and 15 controls over 5 days (3 workdays and 1 full weekend) using accelerometry. The reference group showed a mean vector magnitude (VM) of 150.35 counts/min and the RA group 120.54 counts/min (common s.d. 50.01 counts/min). To achieve 80% power in our ability to detect any differences in the contrast null hypothesis (H0: μ1 = μ2) using a bilateral Student’s t-test for two independent samples with a 5% significance level, 45 patients had to be included in the experimental group and 45 patients in the control group.
Study participants
For the purposes of this cross-sectional study, 100 subjects (50 RA patients and 50 age- and sex-matched controls) were recruited in the rheumatology outpatient clinic during their programmed appointments from January 2009 to January 2011. The recruitment flow chart of RA patients is detailed in Fig. 1. Inclusion criteria for RA patients were (i) men or women 18–65 years old, (ii) confirmation by a rheumatologist as having fulfilled the diagnostic criteria for RA [15] and (iii) ≥ 1 but ≤ 10 years of disease activity. Exclusion criteria were (i) patients with swollen or pain joints or joint deformity of any origin in the lower limbs at the time of enrolment, as assessed by anamnesis, physical or X-ray exams, or who had undergone any type of joint surgery in the legs and/or hips, as stated in their medical records; (ii) patients meeting class III or IV in the Steinbrocker classification of functional capacity [16] and (iii) any contraindications to PA stemming from co-morbidities (pulmonary and/or cardiovascular disease, peripheral vascular disease or residual lower extremity neuromuscular effects from stroke). No medication restrictions were imposed on RA patients included in this study. Six months after the initial assessment, a group of 30 RA patients were randomly assigned for a second evaluation to examine both disease activity and PA by accelerometry using a computer-generated list of random numbers. Controls were recruited among the relatives of the RA patients after excluding those with joint disease based on anamnesis.
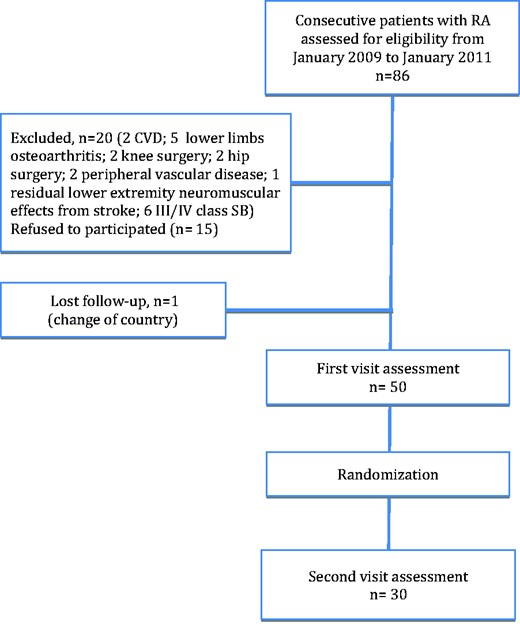
Recruitment flow diagram
CVD: cardiovascular disease; SB: Steinbrocker classification of functional capacity.
Physical activity
PA was assessed by both objective (accelerometry) and subjective (IPAQ) methods. The IPAQ is the most widely used PA questionnaire [17]. Patients were provided the long form [18] and data were collated and presented both as median minutes per week or median metabolic equivalent of task (MET)-minutes per week and as categorical cut point values (defined as low, moderate and high) following the guidelines for data processing and analysis outlined in the IPAQ (http://www.ipaq.ki.se/scoring.pdf). The questionnaire was administered immediately after the accelerometry measurement in order to evaluate the previous week, including the 5 days the device was used.
PA was also assessed using an RT3 triaxial accelerometer (StayHealthy, Monrovia, CA, USA), a portable electronic device that continuously measures acceleration along three axes [19]. Patients were instructed to carry the accelerometer, using an elastic waistband, on the left hip. Accelerometry data were recorded continuously over 5 days (3 workdays and 1 full weekend) at a sampling frequency of 1 min/subject and output was expressed in a counts-per-minute vector. No instructions were given to the subjects regarding their specific performance of PA, other than to take off the accelerometer when sleeping or during water activities. The dependent variable was VM, which was the square root of the sum of the squared accelerations of all three axes. The VM data were processed using custom-made Excel macros to identify the time spent at the three activity levels based on the published cut points [20]: light activity (650–1210 counts/min), moderate activity (1211–2893 counts/min) and vigorous activity (>2893 counts/min). Therefore, in our study, accelerometer data was interpreted as follows: activity kilocalories per day, total kilocalories (sum of activity and basal kilocalories) per day, total VM (in counts/min, including active and resting times), active VM (in counts/min of the active time), average total counts per day, number of low activity minutes per day, number of moderate activity minutes per day, number of vigorous activity minutes per day and numbers of minutes in both moderate and vigorous activity minutes per day (MVPA). In the group of RA patients whose PA was re-evaluated (n = 30), variations in MVPA (ΔMVPA) were expressed according to the following equation: ΔMVPA = MVPAfinal − MVPAinitial.
RA clinical assessment
In RA patients, disease activity was measured using the 28-joint DAS (DAS28) using ESR or CRP (DAS28-ESR or DAS-CRP, respectively) [21]. In the group of RA patients whose disease activity was re-evaluated, variations in DAS28 (ΔDAS28) were expressed according to the following equation: ΔDAS = DAS28final − DAS28initial.
DAS28 improvement was defined as a reduction in basal DAS28 > 1.2 points according to the European League Against Rheumatism (EULAR) criteria [22]. A substantial flare was defined as an increase in the basal DAS28 ≥ 1.2 points [23]. Disease disability was analysed with the HAQ [24].
Cardiovascular risk assessment
Metabolic syndrome was defined in accordance with the 2009 consensus on cardiovascular risks reached by several major organizations [25]. The Framingham Risk Score/Adult Treatment Panel (ATP) III [26] and Reynolds score [27] were measured to estimate the risk of cardiovascular events both in patients and controls.
Anthropometry and questionnaires
Subjects completed a cardiovascular risk factor and medication usage questionnaire and underwent a physical examination to assess patient anthropometric measures and blood pressure. The work activity of the participants was assessed dichotomously, comparing the unemployed with those who had jobs. Medical records were reviewed to ascertain the exact diagnosis and any medication regimens. BMI was calculated and expressed as kilograms per square meter. The waist circumference was measured at the smallest circumference between the rib cage and the iliac crest with the subject in a standing position. The hip circumference was measured at the widest circumference between the waist and the thighs. The waist-to-hip ratio was then estimated. Fatigue was measured with the Functional Assessment of Chronic Illness Therapy (FACIT) [28, 29]. Health-related quality of life was assessed using the 36-item Short Form Health Survey (SF-36) [30, 31].
Statistical analysis
The demographic and clinical characteristics of RA patients and controls (shown in Table 1) were compared using a chi-square test for categorical variables or a Student’s t-test for continuous variables [data are expressed as mean (s.d.)]. For non-continuous variables, a Mann–Whitney U-test was performed or a logarithmic transformation was carried out and data were expressed as the median [interquartile range (IQR)]. Since the values for IPAQ and accelerometry are expressed differently, an intraclass correlation coefficient was not feasible in a concordance analysis between the two methods. Thus both were divided in quintiles and a quadratically weighted kappa index was calculated. Correlations between PA and clinical features of RA, as well as comparisons between RA patients and controls, were performed through multivariate analysis, adjusting for age, sex and work activity. Data on the minutes of vigorous activity per day did not follow a normal distribution pattern and were evaluated using linear regression analysis following a logarithmic transformation. In a group of 30 RA patients, a second evaluation of disease activity and PA by IPAQ and accelerometry was conducted 6 months after the initial visit. The relationship between variations in the DAS28 and PA, as measured by accelerometry, was analysed using Wilcoxon rank tests for paired samples and their correlation was determined by univariate regression analysis. All analyses used a 5% two-sided significance level and were performed using SPSS software, version 19 (IBM, Armonk, NY, USA). A P-value < 0.05 was considered statistically significant.
Basal characteristics of patients and controls
| RA (n = 50) | Controls (n = 50) | P-value | |
|---|---|---|---|
| General characteristics | |||
| Women, n (%) | 44 (88) | 45 (91.8) | 0.75 |
| Age, mean (s.d.), years | 54.5 (7.4) | 52.2 (8.0) | 0.17 |
| Level of education | |||
| Elementary, n (%) | 39 (78) | 35 (70) | 0.36 |
| Post-secondary education, n (%) | 11 (22) | 15 (30) | 0.49 |
| BMI, mean (s.d.), kg/m2 | 29.20 (5.85) | 28.14 (3.66) | 0.27 |
| Hypertension, n (%) | 18 (36) | 12 (24) | 0.19 |
| Diabetes mellitus, n (%) | 8 (16) | 4 (8) | 0.11 |
| Tobacco use, n (%) | 13 (26) | 8 (16) | 0.13 |
| Work activity, n (%) | 25 (50) | 31 (62) | 0.23 |
| Metabolic syndrome, n (%) | 8 (16) | 4 (8) | 0.21 |
| ESR, mean (s.d.), mm/h | 25 (14.70) | 21 (11) | 0.04 |
| CRP, mean (s.d.), mg/l | 5.50 (5.60) | 3.3 (3.2) | 0.01 |
| RA features | |||
| Disease duration, mean (s.d.), years | 6.32 (4.66) | ||
| RF, n (%) | 32 (64) | ||
| HAQ, mean (s.d.) | 0.61 (0.68) | ||
| DAS28-ESR, mean (s.d.) | 3.74 (1.40) | ||
| DAS28-CRP, mean (s.d.) | 3.24 (1.36) | ||
| SDAI, mean (s.d.) | 12.03 (10.64) | ||
| SJC, mean (s.d.) | 1.90 (2.50) | ||
| TJC, mean (s.d.) | 3.90 (5.70) | ||
| Corticosteroids, n (%) | 25 (50) | ||
| DMARD, n (%) | 47 (94) | ||
| Fatigue and self-reported health-related quality of life | |||
| FACIT, mean (s.d.) | 17.36 (9.35) | ||
| SF-36 version 2, mean (s.d.) | |||
| Physical composite summary, mean (s.d.) | 41.10 (9.32) | ||
| Mental composite summary, mean (s.d.) | 44.18 (15.03) | ||
Dichotomous variables are expressed as n (%). P-values significant at a threshold < 0.05 are in bold. FACIT: Functional Assessment of Chronic Illness Therapy; SDAI: Simplified Disease Activity Index; SF-36: 36-item Health Survey; SJC: swollen joint count; TJC: tender joint count.
Results
Characteristics of the participants
The general and disease-related characteristics of the participants in this study are shown in Table 1. In our series, patients exhibited moderate disease levels as illustrated by the DAS28 [mean 3.75 (s.d. 1.40)] with half of them (50%) on treatment with prednisone. There were no differences between patients and controls with regard to age, sex distribution, BMI, waist circumference, presence of hypertension or metabolic syndrome and labour activity. As expected, analyses of ESR and CRP values revealed statistically significant differences between controls and patients.
Agreement between accelerometer and IPAQ data
When accelerometry (activity kcal/day) and IPAQ (MET-min/week) data for both RA patients and controls were analysed over a single continuum, the correlation proved statistically significant (r = 0.31, P = 0.01). However, if RA patient and control data were analysed separately, only the former maintained this association (r = 0.35, P = 0.02), the controls did not (r = 0.29, P = 0.08). When accelerometry and IPAQ were considered as quintiles, agreement was evident to a moderate degree, with a median quadratic weighed kappa index of 0.27 (IQR 0.06–0.48, P = 0.02). Other accelerometry parameters such as total kilocalories per day, total VM, active VM, average total counts per day, number of low activity minutes per day, number of moderate activity minutes per day, number of vigorous activity minutes per day and number of minutes in both moderate and vigorous activity per day (MVPA) did not correlate with IPAQ in RA patients (data not shown).
Comparison of PA in patients and controls
As measured by accelerometry, there were no differences between patients and controls in terms of activity kilocalories per day, total kilocalories per day, global VM, active VM and average total counts per day. When analysed in the contexts of time spent in low, moderate and vigorous activity, minutes of moderate activity per day [mean 22 min (s.d. 15) vs 29 (21), P = 0.05), minutes of vigorous activity per day [median 0.6 min (IQR 0.2–1.6) vs 2.2 (0.6–6), P = 0.00] and the sum of both, i.e. MVPA per day [mean 23 min (s.d. 16) vs 33 (27), P = 0.02], PA levels were lower in RA patients when compared with healthy controls (Table 2). As assessed by the IPAQ, however, there was no difference in PA between patients and controls, even when IPAQ data were divided into low, moderate and vigorous activity types (Table 2).
Comparison of physical activity in patients and controls
| RA (n = 50) | Controls (n = 50) | P-value | |
|---|---|---|---|
| Accelerometry | |||
| Activity kilocalories/day | 539 (214) | 515 (258) | 0.64 |
| Total kilocalories (sum of activity and basal kcal)/day | 2122 (316) | 1998 (424) | 0.15 |
| Total VM (counts/min) (sum of activity and resting time) | 150 (72) | 148 (74) | 0.89 |
| Active VM (counts /min) (only time in activity) | 294 (84) | 335 (122) | 0.07 |
| Total count/day | 192 395 (74 170) | 208 404 (116 727) | 0.34 |
| Number of minutes of low activity/day | 56 (33) | 51 (29) | 0.74 |
| Number of minutes of moderate activity/day | 22 (15) | 29 (21) | 0.05 |
| Number of minutes of vigorous activity/day | 0.6 (0.2–1.6) | 2.2 (0.6–6) | 0.00 |
| Number of minutes of MVPA/day | 23 (16) | 33 (27) | 0.02 |
| International Physical Activity Questionnaire | |||
| MET-min/week | 3609 (2795) | 3742 (3103) | 0.83 |
| Low activity, n (%) | 6 (12) | 4 (8) | 0.74 |
| Moderate activity, n (%) | 24 (48) | 23 (46) | 0.84 |
| Vigorous, n (%) | 20 (40) | 23 (46) | 0.54 |
Data were adjusted for sex, age and work activity and expressed as mean (s.d.) or median (interquartile range). P-values significant at a threshold < 0.05 are in bold. MET: metabolic equivalent of task; MVPA: moderate to vigorous physical activity; VM: vector magnitude.
Relationship between PA, cardiovascular risk and disease symptoms in RA patients
Table 3 shows the relationship between PA, disease activity and RA symptoms. In RA patients, age, BMI and waist-to-hip ratio had no correlation with PA. While the Reynolds cardiovascular risk was not associated with PA, the Framingham score was inversely related to PA when total VM was considered and nearly reached statistical significance when other measurements (i.e. accelerometry or IPAQ) were taken into account. Metabolic syndrome also inversely correlated with PA in assessments using IPAQ (when considered as continuous variables) or accelerometry (when considered as total kcal/day or MVPA-min/week, P = 0.02). Globally, HAQ negatively correlated with both IPAQ and total VM accelerometry data. Disease activity, as assessed by DAS28-CRP or SDAI, also negatively correlated with IPAQ (MET-min/week), but not with the accelerometer data. However, DAS28-ESR showed a nearly significant inverse relationship with accelerometry (MVPA) (P = 0.06). On the other hand, swelling and painful joint counts and ESR or CRP, globally, were not associated with PA as assessed by either accelerometry or IPAQ. Interestingly, corticoids intake (as a binary variable) negatively correlated with IPAQ parameters; this was also true of total VM and MVPA as determined by accelerometry. In contrast, neither health-related quality of life (SF-36) nor FACIT were related to PA in assessments using either IPAQ or accelerometry. Only FACIT showed a nearly significant negative relationship with IPAQ (MET-min/week) (Table 3).
Multivariate analysis of RA features using accelerometry and International Physical Activity Questionnaire (IPAQ)
| IPAQ | Accelerometry | |||||||||
|---|---|---|---|---|---|---|---|---|---|---|
| Total kcal/day | ||||||||||
| MET-min/week β coefficient (95% CI) | P-value | Vigorous activity OR (95% CI) | P-value | Total VM (counts/min) β coefficient (95% CI) | P-value | MVPA (min/week) β coefficient (95% CI) | P-value | β coefficient (95% CI) | P-value | |
| General characteristics | ||||||||||
| Age, years | 57 (−51, 166) | 0.30 | 1.04 (0.90, 1.20) | 0.57 | −2.47 (−5.70, 0.75) | 0.13 | −3.20 (−6.94, 0.54) | 0.09 | −6.7 (−16.3, 2.9) | 0.16 |
| BMI, kg/m2 | −16.7 (−155, 121) | 0.81 | 0.99 (0.84, 1.18) | 0.98 | −0.85 (−4.71, 3.00) | 0.66 | −2.61 (−7.19, −1.97) | 0.26 | 8.04 (−1.19, 17026) | 0.09 |
| Waist-to-hip ratio | 5336 (−7772, 18 445) | 0.42 | 0.02 (0.00, 1589) | 0.59 | −167 (−613.34, 279.80) | 0.45 | −349 (−882, 184) | 0.19 | 1638 (−155, 3452) | 0.07 |
| Cardiovascular risk | ||||||||||
| Reynolds | 72 (−232, 382) | 0.64 | 1.20 (0.57, 2.50) | 0.64 | −5.65 (−16.37, 5.05) | 0.29 | −9.27 (−2.42, 1.89) | 0.09 | −4.26 (−35.62, 27.09) | 0.78 |
| Framingham/ATP III | −248 (−629, 132) | 0.19 | 0.55 (0.24, 1.28) | 0.16 | −10.69 (−21.02, −0.34) | 0.04 | −10.22 (−21.75, 1.29) | 0.08 | −27.33 (−58.31, 3.63) | 0.08 |
| Metabolic syndrome | −93.9 (−153.1, −34.7) | 0.00 | 0.35 (0.04, 3.08) | 0.34 | −903.3 (−3121.8, 1315.2) | 0.41 | −83.17 (−153.57, 12.77) | 0.02 | −219 (−407, −33) | 0.02 |
| Disease activity and features | ||||||||||
| HAQ | −1623 (−2742, −503) | 0.00 | 0.25 (0.06, 1.02) | 0.05 | −43 (−81, −6.46) | 0.02 | −34.63 (−78.54, 9.29) | 0.12 | −105.5 (−218.7, 7.7) | 0.07 |
| DAS28-ESR | −380 (−884, 123) | 0.14 | 0.75 (0.48, 1.18) | 0.21 | −1.35 (−18.35, 15.65) | 0.87 | −15.56 (−33.41, 2.28) | 0.06 | −13.28 (−83.95, 57.38) | 0.71 |
| DAS28-CRP | −544 (−1082, 5) | 0.04 | 0.77 (0.49, 1.21) | 0.27 | −0.30 (−17.95, 17.35) | 0.97 | −14.95 (−34.40, 4.50) | 0.12 | 41.34 (−23.45, 106.12) | 0.20 |
| SDAI | −67 (−137, 2) | 0.05 | 0.97 (0.92, 1.03) | 0.36 | 0.05 (−2.20, 2.31) | 0.96 | −2.06 (−4.47, 0.35) | 0.09 | 3.67 (−4.70, 12.04) | 0.38 |
| SJC (n) | −130 (−496, 234) | 0.47 | 0.98 (0.84, 1.15) | 0.85 | 2.74 (−9.8, 15.29) | 0.65 | −8.52 (−20.63, 3.60) | 0.16 | 6.6 (−26.0, 39.3) | 0.70 |
| TJC (n) | −34 (−196, 127) | 0.67 | 0.88 (0.60, 1.30) | 0.53 | −0.86 (−5.99, 4.25) | 0.73 | −4.16 (−8.99, 0.66) | 0.08 | −4.3 (−17.5, 8.9) | 0.50 |
| ESR, mm/h | −31 (−87, 24) | 0.26 | 0.96 (0.89, 1.03) | 0.31 | −1.41 (−2.92, 0.09) | 0.06 | 0.45 (−1.39, 2.28) | 0.63 | −4.0 (−8.5, 0.5) | 0.09 |
| CRP, mg/dl | −65 (−220, 90) | 0.40 | 0.95 (0.79, 1.14) | 0.58 | 3.25 (−0.88, 7.39) | 0.12 | 3.54 (−1.55, 8.62) | 0.16 | 11.9 (−1.0, 24.8) | 0.07 |
| Disease duration, years | 76 (−99, 252) | 0.39 | 1.00 (0.81, 1.85) | 0.96 | 0.39 (−4.47, 5.10) | 0.89 | 2.67 (−2.89, 8.23) | 0.34 | 4.43 (−9.80, 18.65) | 0.53 |
| Corticosteroid intake | −1842 (−2823, −860) | 0.00 | 0.23(0.05, 10.3) | 0.05 | −46.42 (−68.41, −24.42) | 0.00 | −56.02 (−109.98, −2.05) | 0.04 | −70.01 (−326.03, 186.01) | 0.58 |
| Health-related quality of life and fatigue | ||||||||||
| FACIT | −83 (−170, 2.8) | 0.06 | 0.93 (0.84 - 1.04) | 0.23 | −0.20 (−3.09, 2.69) | 0.89 | −0.75 (−4.00, 2.51) | 0.64 | −2.0 (−10.2, 6.1) | 0.60 |
| SF-36 v2 | ||||||||||
| Physical composite | 31.8 (−94, 158) | 0.61 | 0.98 (0.90 - 1.06) | 0.58 | −0.21 (−3.51, 3.10) | 0.90 | −1.66 (−6.31, 2.99) | 0.46 | −1.9 (−12.7, 8.8) | 0.71 |
| Mental composite | 44.8 (−31.7, 121) | 0.24 | 0.98 (0.93 - 1.04) | 0.54 | 0.75 (−1.46, 2.96) | 0.49 | 1.17 (−1.57, 3.90) | 0.38 | 1.8 (−5.3, 9.1) | 0.60 |
Data were adjusted for sex, age and work activity. P-values significant at a threshold < 0.05 are in bold. FACIT: Functional Assessment of Chronic Illness Therapy; SDAI: Simplified Disease Activity Index; SF-36: 36-item Short Form Health Survey; SJC: swollen joints count; TJC: tender joints count; MET: metabolic equivalent of task; MVPA: moderate to vigorous physical activity; VM: vector magnitude.
Effects of disease activity on PA in RA patients
In order to determine whether the lower PA observed in RA patients with respect to controls was associated with disease activity, a second assessment of PA and disease activity was performed in a randomized group of 30 RA patients 6 months after their basal visits. Fig. 2 shows a composite plot of the variations in DAS28-ESR and MVPA (min/week) obtained by subtracting the values of the second visit from the basal visit in this group of patients. A significant inverse correlation was observed between these two parameters (r = −0.42, P = 0.02). The same analysis that utilized DAS28-CRP to evaluate RA activity also showed an inverse correlation with PA (r = −0.41, P = 0.049). When patients were analysed with respect to variations in their DAS28-ESR, the results were as follows: of those measuring either > 1.2 (patients with clinical improvement or flare) or < 1.2 (no change in clinical activity), both in absolute numbers, only patients with a variation > 1.2 points in DAS28-ESR experienced a significant change in accelerometry (Table 4).
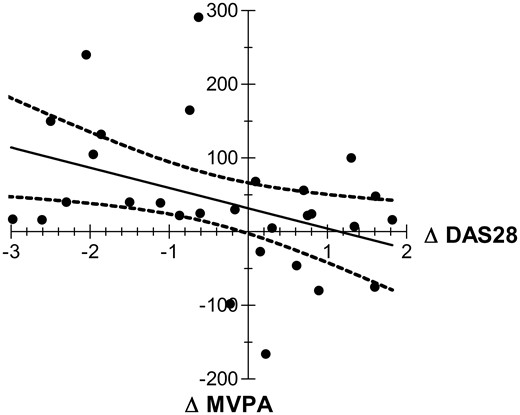
Correlation between variation in disease activity and physical activity in RA patients.
Correlation between variations in disease activity by DAS28-ESR (ΔDAS28) and time spent in moderate to vigorous physical activity (ΔMVPA) as determined by accelerometry in two consecutives measurements spaced 6 months apart in a group of 30 RA patients. The x-axis represents the variations in DAS28-ESR. Patients with an improvement are shown on the left side of the axis. The y-axis represents the variations in MVPA. Patients with improved physical activity are located on the upper side. There was a significant inverse correlation between both parameters (r = −0.42, P = 0.02).
Relationship between variations in disease activity and physical activity in RA patients
| ΔDAS28-ESR > 1.2 (n = 14) | ΔDAS28-ESR < 1.2 (n = 16) | |||||
|---|---|---|---|---|---|---|
| Visit 1 | Visit 2 | P-value | Visit 1 | Visit 2 | P-value | |
| MVPA, median (interquartile range) | 112 (35–148) | 165 (52–260) | 0.03 | 113 (55–164) | 145 (43–252) | 0.21 |
| ΔDAS28-ESR > 1.2 (n = 14) | ΔDAS28-ESR < 1.2 (n = 16) | |||||
|---|---|---|---|---|---|---|
| Visit 1 | Visit 2 | P-value | Visit 1 | Visit 2 | P-value | |
| MVPA, median (interquartile range) | 112 (35–148) | 165 (52–260) | 0.03 | 113 (55–164) | 145 (43–252) | 0.21 |
Wilcoxon rank test for paired samples. P-values significant at a threshold < 0.05 are in bold. ΔDAS28-ESR: change in the 28-joint DAS using ESR; MVPA: minutes of moderate to vigorous physical activity.
Discussion
The main conclusions of our work can be summarized as follows: (i) in terms of total PA, whether quantified by accelerometry or by IPAQ, there were no differences between RA patients and healthy controls, although accelerometry showed that RA patients spend significantly less time in activities that required PA of moderate or vigorous intensity compared with controls; (ii) in RA patients, PA inversely correlated with the presence of metabolic syndrome, the intake of steroids, the level of disability and clinical disease activity and (iii) disease activity seems to interfere significantly with the time that RA patients exert MVPA.
There is evidence to recommend the use of general PA in RA patients, not only because it reduces their cardiovascular risk, but also as a therapeutic tool for disease management [14, 32]. Furthermore, it is generally assumed that PA decreases in RA patients as a consequence of joint pain, restricted mobility, fatigue, reduced muscle mass, strength and endurance. However, there is no definitive evidence that daily PA is lower in RA patients compared with the general population. In this regard, a recent systematic review of PA in RA patients concluded that methodological considerations within the available studies precluded a definitive conclusion on PA levels in the general RA population at large [13]. This prompted us to analyse PA levels, both objectively (by accelerometry) and subjectively (by IPAQ), in a group of RA patients, comparing them with age- and sex-matched healthy controls. In order to ensure that any disabilities affecting bodily movement did not interfere with our PA assessments, especially in accelerometry evaluations, patients who had any sort of RA manifestations in their lower limbs were excluded from this study. Consequently, although our results cannot be extrapolated to the general RA population, they nonetheless constitute a model for studying the relationship between disease activity and PA in RA patients.
In our study, although a noticeable correlation was observed between IPAQ and accelerometry in the assessment of PA, the former was unable to reveal any differences in PA between controls and RA patients. In other settings, such as with healthy adults [33], older adults [9] and persons with multiple sclerosis [34], IPAQ has shown reasonable agreement with accelerometry. Although the use of IPAQ in RA patients has been limited, low IPAQ levels have been associated with the number of hospital admissions and with the length of hospitalization in this patient population [35]. In fact, as in the general population, BMI and body fat in patients with RA were inversely correlated with PA as assessed by the IPAQ [36]. Despite the fact that the IPAQ revealed no differences in PA when comparing RA patients and controls, this questionnaire did show an inverse correlation with certain features of the disease, including metabolic syndrome, HAQ and DAS28 score and/or corticoids intake. Compatible results using the IPAQ for the HAQ and DAS28 were previously obtained in a study that evaluated the effects of TNF-α on PA in RA patients [37]. In agreement with a recently published work [8], accelerometry also showed an inverse relationship between PA and disability by the HAQ in our patients.
In our study, the assessment of PA using accelerometry clearly showed that RA patients spend significantly fewer minutes per day in moderate and vigorous activities than do control patients. A classic paper [38] using the doubly labelled water method (the gold standard) showed that the PA levels in 20 RA women tended to be lower than in 20 gender-matched controls (P < 0.07). In that work there was a significant correlation (P < 0.04) between the gold standard and a uniaxial accelerometer in the assessment of energy expenditure. In subsequent studies accelerometry has been used to study PA in RA, concluding that this population is less physically active than expected [39, 40]. Recently a systematic review of the literature investigating PA, energy expenditure and aerobic capacity concluded that RA patients spend more time in light and moderate activity and less in vigorous activity than controls [41]. This is in agreement with the results presented in this work.
A number of studies have demonstrated that physically inactive RA patients have significantly worse cardiovascular risk profiles compared with those who are physically active [42–44]. Our results show that PA, when assessed by accelerometry, tends to be inversely correlated with cardiovascular risk or with the presence of metabolic syndrome in RA patients. Accelerometry has been previously used to evaluate the relationships PA has with both metabolic syndrome and cardiovascular risk in the general population. Two studies, one in the USA [45] and other in Japan [46], both sought to determine the associations between accelerometer-determined PA and the odds of having metabolic syndrome. The results indicated that adults who maintain an active lifestyle are likely to have a lower incidence of metabolic syndrome. We would suggest that periodic assessments of PA by accelerometry might be a useful tool for assessing and modifying the exercise habits of RA patients and, consequently, for reducing the high cardiovascular risks in this population [12].
Interestingly, multivariate analysis showed that RA patients with higher disease activity, whether reflected by the DAS28 or SDAI, tended to have lower PA, as assessed both by the IPAQ and accelerometry. When a second determination of PA (accelerometry) and disease activity (DAS28-ESR) was carried out, the relationship between the variations with respect to the basal levels of both parameters correlated inversely, particularly in the patient group that exhibited changes in DAS28-ESR consistent with an RA flare or improvement. Currently the scores used to quantify RA activity show a non-negligible degree of subjectivity. Our data suggest that disease activity negatively impacts the PA capacity in RA patients. It is therefore reasonable to assume that the systematic assessment of PA by accelerometry might constitute a useful tool for a more objective evaluation of disease activity in RA patients. Although the design of our study allows the interpretation of data, in the sense that lack of PA might increase disease activity in RA patients, the fact that patients with active disease take advantage of resting and conversely those with low disease activity benefit from PA, makes this alternative interpretation very unlikely.
In conclusion, we found that PA is lower in RA patients compared with the general population, though only in terms of moderate and vigorous activity. Accelerometry is capable of identifying such differences, and even appears to be sufficiently sensitive to detect changes, specifically in those RA patients showing clinical improvements or flares.
Accelerometry is a reliable technique to evaluate physical activity in RA patients.
Accelerometry showed that RA patients spend less time doing moderate and vigorous physical activity than healthy controls.
Changes in disease activity inversely correlated with variations in physical activity as assessed by accelerometry in RA patients.
Acknowledgements
The authors would like to thank to all members of the Department of Rheumatology of Hospital Universitario de Canarias for their helpfulness in the acquisition of data.
Funding: This work was supported by a grant from the Spanish Ministry of Health (Fondo de Investigaciones Sanitarias) to F.D.G (FIS: 09/02209) and (FIS PI12/02499), cofinanced by the European Regional Development Fund.
Disclosure statement: The authors have declared no conflicts of interest.
References
Author notes
*Vanesa Hernández-Hernández and Iván Ferraz-Amaro contributed equally to this work.

Comments