


Abstract
Objectives. A clinico-pathological study in diffuse systemic sclerosis (SSc) patients was performed to analyse whether the skin histological organization and the pro-fibrotic signals elicited by TGF-β in fibroblasts vary according to the modified Rodnan skin score (mRSS).
Methods. Twenty-seven SSc patients underwent 45 skin biopsies with simultaneous measure of mRSS before or after treatment by immunosuppressive drugs, with or without autologous peripheral haematopoietic stem cell transplantation (HSCT).
Results. Double-blind optic microscopy analysis of the biopsies standard extracellular matrix stains allowed to define three histological subgroups: 6 with grade 1 weak fibrosis, 30 with grade 2 moderate fibrosis and 9 with grade 3 severe fibrosis. A significant ( P < 0.0001) was identified between the grades of fibrosis and the mRSS. In skin fibroblast cultures, Smad3 phosphorylation levels, as well as mRNA steady-state levels of two transforming growth factor (TGF)-β/Smad3 targets, COL1A2 and PAI-1, increased in parallel with the mRSS. When compared with pre-transplant values the degree of fibrosis observed after HSCT in the papillary and in the reticular dermis decreased in parallel with the fall in mRSS ( n = 5 consecutive patients with repeated biopsies).
Conclusions. The histological extent of skin fibrosis correlates closely with the mRSS. Both parameters appeared to regress after HSCT. The extent of TGF-β signalling activation in SSc skin fibroblasts appears to parallel the severity of disease.
Introduction
Systemic sclerosis (SSc) is a complex autoimmune disease characterized by predominant T-cell activation, auto-antibodies and cytokine release, which all contribute to diffuse micro-vascular injury, fibroblasts activation and increased production of collagen leading to diffuse vascular damage and sclerosis within the skin and internal organs due to progressive and widespread tissue fibrosis [ 1–3 ]. In diffuse SSc, the clinical extent of skin fibrosis is assessed by repeated measurements of the modified Rodnan skin score (mRSS) [ 4 ], which has been validated as a strong prognostic factor [ 5 , 6 ]. Rapidly progressive diffuse SSc, when associated with early pulmonary, cardiac or renal involvement within the first 3–5 yrs after the disease onset, has a 3–5 yr survival rate between 35% and 45%, depending on the severity of major organs’ involvement [ 5 , 6 ]. In severe forms of diffuse SSc, the use of monthly intravenous bolus cyclophosphamide was shown to induce a decrease in skin score and to improve pulmonary function in several phase II studies [ 7–9 ]. More recently, a placebo-control trial of oral cyclophosphamide for 1 yr among 158 patients with symptomatic SSc-related lung disease showed a modest but significant benefit on lung function, skin thickening and health quality of life [ 10 ]. In this context, we [ 10 ] and other European [ 11 ] and North American [ 12 ] groups, using intense myelo- and immuno-suppression by cyclophosphamide followed by autologous haematopoietic stem cell transplantation (HSCT), reported durable response with significant fall in the mRSS in two-thirds of the patients up to 3 yrs after HSCT.
In SSc patients, standard histopathological analysis of skin biopsies can be performed to strengthen the clinical diagnosis [ 13 ]. Excessive production of fibrillar collagen and changes in the architecture of connective tissue components are considered as the hallmark of SSc. Numerous in vitro and in vivo studies have shown over-expression of collagen genes and of various other extracellular matrix (ECM) molecules in SSc compared with normal fibroblasts [ 14 ]. The major cytokine involved in tissue fibrosis is transforming growth factor-β (TGF-β). TGF-β promotes collagen deposition by inducing the transcription of the types I, III and V fibrillar collagen genes and by inhibiting their degradation, via a decrease of matrixmetalloproteinases (MMPs) and an increase of tissue inhibitor of metalloproteinases (TIMP) expression [ 15–17 ]. TGF-β signals via serine/threonine kinase transmembrane receptors, which phosphorylate cytoplasmic mediators of the Smad family. The ligand-specific Smad2 and Smad3, interact directly with, and are phosphorylated by, activated TGF-β receptor type I. Upon phosphorylation at their SSXS carboxy-terminal motif, they form heteromeric complexes with Smad4. The resulting Smad heterocomplexes are then translocated into the nucleus where they activate target genes, binding DNA either directly or in association with other transcription factors. The inhibitory Smad, Smad7, prevents phosphorylation and/or nuclear translocation of receptor-associated Smads [ 18–20 ].
The present clinico-pathological study was designed in patients with diffuse SSc before or after treatment by immunosupressive drugs alone or followed by HSCT, and in healthy controls to evaluate: (i) the skin ECM organization using standard matrix stains and histological analysis (ii) the profibrotic signals elicited by TGF-β in fibroblasts cultures and (iii) whether the histological findings vary according to the clinical extent of skin involvement as assessed by the mRSS, and whether they can be modified after treatment by HSCT.
Methods
Patients
SSc patients met the American College of Rheumatology classification criteria for SSc [ 2 ] and those with overlapping syndromes were excluded. Patients with severe diffuse SSc and disease duration ≤4 yrs since development of the first non-Raynaud's phenomena leading to the diagnosis, plus a mRSS >15 and major organ involvement as defined for the ISAMAIR phase I–II study [ 21 ] and more recently for the European ASTIS trial ( http://www.astistrial.com ), were eligible for HSCT. The extent of skin involvement was evaluated by repeated measures of the mRSS [ 4 ], performed by the same clinical investigator blindly to the results of adapted paraclinical investigations for internal organ involvement, as described for HSCT candidates [ 11 ].
Skin samples
Punch skin biopsies (4 mm in diameter) were performed by the referring clinician in the Internal Medicine Department of the Saint-Louis and Saint-Antoine Hospitals, after consecutive patients had signed a written informed consent according to the declaration of Helsinki and approved by the hospital Saint-Louis local ethics committee. The biopsy site was chosen according to clinical criteria including: indurated and inflammatory area with recent evolution, excluding areas with close proximity to vasculature or tendons. Use of local anaesthesia and disposable surgical equipment were standard procedures. Skin biopsies were taken in the clinically affected areas of skin, before (three punches) and 6 months (one punch) after starting any treatment or at time of best clinical improvement, as estimated by the clinician and the evolution of the mRSS. After punch, biopsies were immediately placed on a hard sterile working area. One of the biopsies was fixed into paraformaldehyde-ethanol-acetic acid for 2 h followed by paraffin inclusion for histological analysis. Another biopsy was used to obtain fibroblasts by explant culture. Skin biopsies obtained from healthy volunteers on the same part of the body (arm, leg, abdomen) were used as controls.
Histological analysis and study classification
Consecutive serial sections were cut from paraffin embedded tissue with a manual microtome and stained with haematoxylin–eosin–safran on Masson's trichrome and Sirius red. For quantitative morphometric analysis, sections were analysed using standard light microscopy. Each biopsy was examined twice by two different pathologists blind to each other. The presence and distribution of sclerosis was assessed within the various layers of the dermis: papillary dermis (PD), superficial reticular dermis (SRD), median reticular dermis (MRD) and deep reticular dermis (DRD). Within each of these four dermal layers, the extent of fibrous thickening was assessed semi-quantitatively as follows: 0 = no fibrosis, + = light fibrosis, ++ = moderate fibrosis, +++ = extensive fibrosis. Three increasing grades of fibrosis were then defined as follows, in comparison with normal controls: (i) grade 1 = weak fibrosis, defined by the presence of: no fibrosis in the papillary dermis (PD = 0) and light fibrosis in the superficial reticular dermis (SRD ≤ +) or in the median reticular dermis (MRD ≤ +) or in the deep reticular dermis (DRD ≤ +); (ii) grade 2 = moderate fibrosis, defined by all the cases which do not belong to grade 1 or 3 and (iii) grade 3 = severe fibrosis, defined by the presence of: severe fibrosis in the deep reticular dermis (DRD = +++) and in the median reticular dermis (MRD = +++) irrespective of the degree in the superficial reticular dermis and in the papillary dermis, or severe fibrosis in the deep reticular dermis (DRD = +++) plus moderate fibrosis in the median (MRD = ++) and in the superficial reticular dermis (SRD = ++) as well as in the papillary dermis (PD = ++) ( Table 1 ).
Histological grade of fibrosis, as defined after double-blind standard optic microscopy analysis, according to the extent of fibrosis (0 = no fibrosis, + = light fibrosis, ++ = moderate fibrosis, +++ = extensive fibrosis) in the PD, SRD, MRD and DRD
| Histological grade of fibrosis | Papillary dermis (PD) | Superficial reticular dermis (SRD) | Median reticular dermis (MRD) | Deep reticular dermis (DRD) |
|---|---|---|---|---|
| Grade 1 ‘weak’ | 0 | ≤ + | ≤ + | ≤ + |
| Grade 2 ‘Moderate’ | others | others | others | others |
| Grade 3 ‘Severe’ | ++ | ++ | ++ | +++ |
| 0 to +++ | 0 to +++ | +++ | +++ |
Immunostaining
Five micrometre cryostat sections were taken from cryomatrix-embedded frozen specimen, fixed in acetone at −20° for 10 min and then incubated in phosphate buffered saline (PBS). The Ultratech HRP (Beckman Coulter, France) was used. Briefly, sections were incubated in PBS with 0.1% triton and washed three times in PBS. Endogenous peroxidases were inhibited using H 2 O 2 and samples were incubated for 1 h with Smad3, Smad4 or Smad7 antibodies (Santa Cruz Biotechnology). The sections were then incubated with biotinylated-conjugated goat anti-rabbit antibody for 10 min, washed three times in PBS before being incubated with a sptreptavidin–peroxidase reagent. The substrate chromogen was finally used to reveal the fixation of the antibody. Results were examined by standard light microscopy.
Cell cultures and reagents
Human fibroblasts were established by explanting skin punch biopsy (SSc patients or healthy controls) in Dulbecco's modified Eagle's medium supplemented with 10% heat-inactivated fetal calf serum, 2 mM glutamine and antibiotics (100 units/ml penicillin, 50 μg/ml streptomycin-G and 0.25 μg/ml Fungizone™) in 5% CO 2 at 37°C. Cells were used for experiments between passages 3 and 8.
Immunoblotting analyses
Confluent cultured fibroblasts were washed twice in 1X PBS and scraped directly into Laemmli buffer (62.5 mM Tris–HCl pH 6.8, 2% SDS, 10% glycerol, 0.5 mM PMSF). Protein concentration of lysates was assayed with the Bio-Rad (Hercules, CA, USA) protein reagent, and 40 μg of protein was denatured by heating at 95°C for 3 min prior to resolution by SDS-PAGE. After electrophoresis, proteins were transferred to PVDF membranes (NEN life science, MA, USA), immunoblotted with anti-phospho Smad3 (gift from E. Leof, Mayo Clinic, Rochester, MN, USA), anti-Smad3 (Clinisciences, CA, USA), and anti-βactin antibodies (Santa Cruz Biotech, CA, USA) respectively. After incubation with antibodies, filters were washed and incubated with a horseradish peroxidase-conjugated goat-anti-rabbit or anti-mouse secondary antibody (Santa Cruz Biotechnology) for 1 h. Filters were then washed, developed according to chemiluminescence protocols (ECL, Amersham Biosciences), and revealed with a PhosphorImager (Amersham Biosciences). Specific bands were quantified using the ImageQuant 5.2 software (Amersham Biosciences).
Reverse transcription-PCR analysis
Total RNA was extracted according to the manufacturer's instructions using Rneasy mini-kit (Qiagen). DNase I treatment (25 units, 15 min) of total RNA was directly performed on the spin columns to eliminate genomic contamination of the RNA samples. One microgram of total RNA was used for first strand cDNA synthesis using a RTPCR kit (Invitrogen) according to the manufacturer's instructions. Real-time PCR was performed with an ABI PRISM 7700 instrument (Applied Biosystems) using SYBRGreen PCR Core Reagents (Applied Biosystems). Reaction mixtures were incubated for 2 min at 50°C, followed by 10 min at 95°C and 40 cycles of 15 s at 95°C, 45 s at 60°C, 1.5 min at 68°C and finally 15 s at 95°C, 20 s at 63°C and 15 s at 95°C. For each mRNA, gene expression was corrected against GAPDH mRNA content in the same sample. Primer sequences used are: COL1A1forward 5′-GGGCAAGACAGTGATTGAATA-3′; COL1A2reverse 5′-ACGTCGAAGCCGAATTCCT-3′; PAI-1forward 5′-AGATCGAGGTGAACGAGAGTGGCACG-3′; PAI-1reverse 5′-TTTGTCCCAGATGAAGGCGTCTTTCC-3′; GAPDHforward 5′-GCTCCTCCTGTTCGACAGTCA-3′; GAPDHreverse 5′-ACCTTCCATGGTGTCTGA-3′.
Statistical analysis
Association of the mRSS with the histological grades was tested using a linear model (trend test). A P -value <0.05 was regarded as indicating statistical significance. Inter-observer agreement and intra-observer but inter-colouration agreement were assessed using weighted κ-statistics, with 95% confidence intervals (CIs).
Results
Patients
Twenty-seven patients (18 females), median age of 45 yrs (range: 23–65), with diffuse SSc (1, 2) underwent skin biopsies ( n = 45) either before ( n = 9) or after ( n = 36) treatment by various immunosuppressive drugs alone or followed by HSCT. Patient's clinical characteristics are shown in Table 2 .
Clinical characteristics of the 27 patients with SSc
| Patient | Biopsy number | Age /Sex | Ethnic origin | Disease duration (yrs) | mRSS | Skin biopsy | Organs | Medications |
|---|---|---|---|---|---|---|---|---|
| 1 | 1 | 54/M | Caucasian | 2 | 16 | Right leg | D, P, R, A | No treatment |
| 2 | 2.5 | 20 | Left forearm | D, P, R, A | Cyclophosphamide | |||
| 3 | 3 | 35 | Left forearm | D, P, R, A | Cyclophosphamide | |||
| 2 | 4 | 49/F | Caucasian | 5 | 21 | Right leg | D, P, A | No treatment |
| 3 | 5 | 44/F | West Indies | 5 | 8 | Left leg | D, P, C, A | No treatment |
| 4 | 6 | 55/F | Asian | 2 | 27 | Right forearm | D, P, A | Predn |
| 7 | 2.5 | 15 | Right forearm | D, P, A | Predn post-HSCT | |||
| 5 | 8 | 63/F | Caucasian | 3 | 21 | Left leg | D, P | Predn |
| 9 | 3.5 | 9 | Left leg | D, P | Cyclophosphamide | |||
| 10 | 4 | 7 | Right leg | D, P | No treatment | |||
| 6 | 11 | 51/F | Caucasian | 7 | 12 | Right leg | D, P, C | Cyclophosphamide + Predn |
| 7 | 12 | 57/M | Asian | 7 | 43 | Left arm | D, P, C, A | No treatment post-HSCT |
| 13 | 9 | 32 | Rigth arm | D, P, C, A | Rapamycin post HSCT | |||
| 14 | 10 | 23 | Right arm | D, P, C, A | Rapamycin post HSCT | |||
| 8 | 15 | 57/F | West Indies | 8 | 8 | Abdomen | D, P | No treatment post-HSCT |
| 16 | 9 | 1 | Abdomen | D, P | No treatment post-HSCT | |||
| 9 | 17 | 65/M | Caucasian | 7 | 15 | Right leg | D, P, C | No treatment post-HSCT |
| 18 | 9 | 4 | Right leg | D, P, C | No treatment post-HSCT | |||
| 10 | 19 | 45/M | Caucasian | 8 | 2 | Abdomen | D, P, C | No treatment post-HSCT |
| 20 | 9 | 3 | Right leg | D, P, C | No treatment post-HSCT | |||
| 11 | 21 | 32/F | West Indies | 10 | 11 | Left forearm | D, P, A, M | Predn post-HSCT |
| 12 | 22 | 57/F | Caucasian | 6 | 12 | Right Leg | D, P, C, A, M | Cellcept + Predn post-HSCT |
| 13 | 23 | 23/F | Caucasian | 6 | 20 | Right leg | D, P, C, A, M | Cellcept + Predn post-HSCT |
| 14 | 24 | 34/F | Caucasian | 18 | 4 | Abdomen | D, P, A | Methotrexate + Predn post-HSCT |
| 15 | 25 | 43/F | Caucasian | 5 | 33 | Right forearm | D, P, C, A | No treatment |
| 26 | 5.5 | 18 | Right forearm | D, P, C, A | No treatment post-HSCT | |||
| 16 | 27 | 56/M | Caucasian | 1 | 11 | Right forearm | P | No treatment |
| 28 | 1 | 18 | Right forearm | P | Predn | |||
| 17 | 29 | 46/M | Caucasian | 2 | 16 | Abdomen | D, P | Predn |
| 18 | 30 | 45/M | West Indies | 1 | 26 | Left leg | D, A, M | Predn |
| 19 | 31 | 42/F | West Indies | 2 | 37 | Left leg | D, P | Cyclophosphamide + Predn |
| 20 | 32 | 50/M | Caucasian | 1 | 35 | Left leg | D | Cyclophosphamide |
| 21 | 33 | 38/F | Caucasian | 3 | 18 | Right leg | D, P | No Treatment |
| 22 | 34 | 38/F | Caucasian | 2 | 15 | Left leg | D, P | No Treatment |
| 23 | 35 | 52/F | Caucasian | 7 | 6 | Left forearm | P, A, M | Predn |
| 24 | 36 | 51/F | Caucasian | 5 | 4 | Right forearm | D, P | Predn + Cellcept |
| 25 | 37 | 49/F | Caucasian | 4 | 29 | Right leg | D, P, C, A | Predn preHSCT |
| 38 | 4.5 | 17 | Left leg | D, P, C, A | Predn post-HSCT | |||
| 39 | 5 | 4 | Left leg | D, P, C, A | Predn post-HSCT | |||
| 26 | 40 | 35/F | West Indies | 4 | 23 | Right leg | D, P | No treat ment preHSCT |
| 41 | 7 | 5 | Right leg | D, P | Cellcept post-HSCT | |||
| 42 | 8 | 6 | Left Leg | D, P | Cellcept post-HSCT | |||
| 27 | 43 | 38/M | Caucasian | 2 | 22 | Right leg | D, P, A | Predn |
| 44 | 2.5 | 12 | Right forearm | D, P, A | Predn post-HSCT | |||
| 45 | 3 | 14 | Left forearm | D, P, A | Predn + Cell cept post HSCT |
Patients with diffuse SSc underwent 45 skin biopsies all together. Biopsy was performed either before ( n = 9) or after ( n = 36) treatment by various immunosuppressive drugs alone or with peripheral HSCT. Five patients underwent a repeated biopsy at the same site before and after HSCT.
D, digestive involvement; P, pulmonary involvement; R, renal involvement; C, cardiac involvement; A, articular involvement; M, muscular involvement; Predn, prednisolone; mRSS, modified Rodnan skin score.
Evolution of skin SSc ECM organization according to the severity of the disease
Double-blind optic microscopy analysis allowed to classify the 45 SSc skin biopsies in three different subgroups according to the extent and the pattern of fibrosis, as described in the material and methods section and shown in Figs 1 and 2 . Six biopsies were classified in the grade 1 subgroup with mild fibrosis, 30 biopsies in the grade 2 subgroup with a moderate degree of fibrosis, nine biopsies in the grade 3 subgroup with severe fibrosis. In the normal control skin biopsies, taken from similar parts of the body (arm, leg, abdomen), no ongoing fibrotic process was observed. After unmasking the double blind analysis, the distribution of the patients’ mRSS was analysed according to each histological degree of fibrosis within the three subgroups. As illustrated in Fig. 3 , the median mRSS were 4 (interquartile range: 2.5–7) for patients in subgroup 1, 15 (interquartile range: 9.5–20.8) for patients in subgroup 2 and 26 (interquartile range: 20–33) for patients in subgroup 3, respectively. A significant mean increase in mRSS according to the histological grades of fibrosis was found ( P < 0.0001, linear trend test). Inter-observer agreement for the histological grading was found to be good according to Landis and Koch guidelines [ 20 ], with a weighted κ at 0.72 (95% CI 0.42–1.00). Agreement between the two stains used was estimated at 0.81 (95% CI 0.46 to 1.00), thus denoting very good agreement.
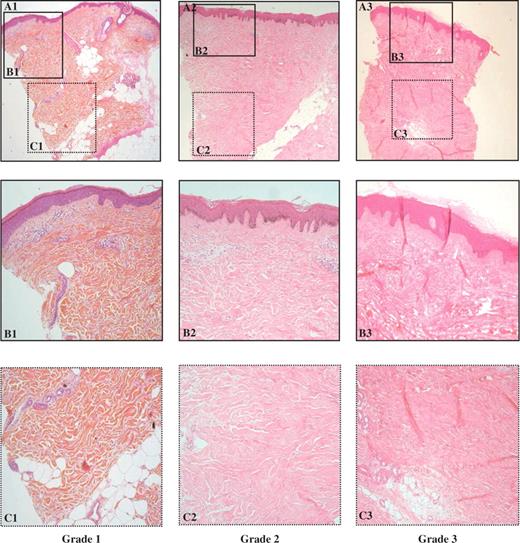
Histological patterns of skin fibrosis on standard optic microscopy analysis. A = 40×, B and C = 200×, using haematoxylin–eosin–safran trichrome staining. Three increasing grades (A1, A2, A3) of fibrosis were defined as in Table 2 .
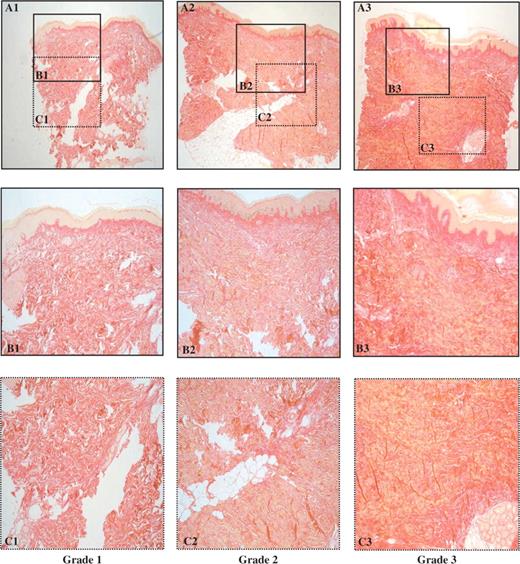
Histological patterns of skin fibrosis on standard optic microscopy analysis. A = 40×, B and C = 200×, using Sirius red staining specific for fibrillar collagens. Three increasing grades (A1, A2, A3) of fibrosis were defined as in Table 2 .
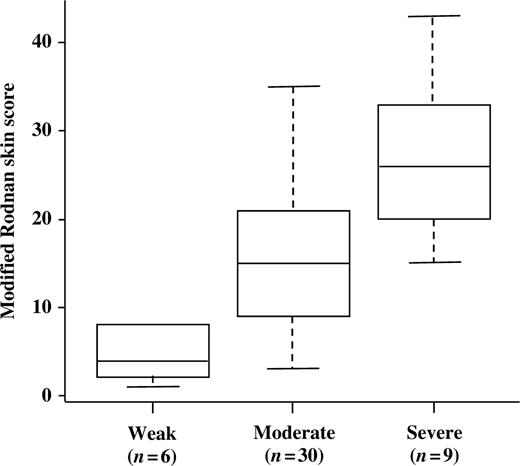
Correlation between the three histological subgroups of fibrosis and the mRSS. ( P < 0.0001, linear trend test). The boxes represent the first quartile (Q1), the median and the third quartile (Q3), while the whiskers extend from the minimum to the maximum of the distributions.
Involvement of the TGF-β/Smad signalling pathway in the SSc disease
Immunohistochemistry analysis of the Smad molecules was performed on SSc and normal skin ( n = 5–7). Positive staining for Smad3, Smad4 and Smad7 was detected in endothelial cells, keratinocytes and fibroblasts both in normal and SSc skin ( Figs 4 A, B and C respectively). No difference was observed between SSc and normal tissues regarding Smad4 and Smad7 expression ( Figs 4 B and C). In contrast, Smad3 staining was increased in the epidermis from SSc patients compared with normal epidermis. No difference in Smad3 expression was observed in SSc endothelial and SSc fibroblast cells compared with normal counterparts. In some SSc keratinocytes, Smad3, as observed for Smad4, was localized in the nucleus ( Fig. 4 A), indicating that the TGF-β signalling pathway is highly activated in SSc skin compared with normal skin.
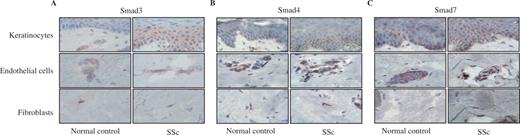
Immunohistochemistry of Smad proteins. Tissues sections derived from normal and SSc skin tissue were stained for Smad3 (A) , Smad4 (B) and Smad7 (C) by immunoperoxidase method. The expression and the localization of these proteins were analysed in keratinocytes (upper panel), endothelial cells (middle panel) and fibroblasts (lower panel). Serial sections were counterstained with haematoxylin–eosin. (Magnification 100×).
Phosphorylation of Smad3 in fibroblasts derived from the skin of SSc patients
We compared the level of Smad3 phosphorylation in protein extracts from SSc and normal fibroblasts obtained by explanting skin punch biopsy from three healthy donors and six SSc patients. As shown in Fig. 5 , a strong increase in Smad3 phosphorylation level was observed in SSc fibroblasts (lane 4–9) in comparison with normal fibroblasts (lane 1–3) demonstrating high levels of TGF-β signalling in SSc fibroblasts in culture. Specifically, an increase in phospho-Smad3 protein levels up to 5.2-fold was observed in SSc fibroblasts compared with normal fibroblasts. Most interestingly, the levels of Smad3 phosphorylation increased progressively with the value of the mRSS, therefore in parallel to the histological grade of fibrosis.
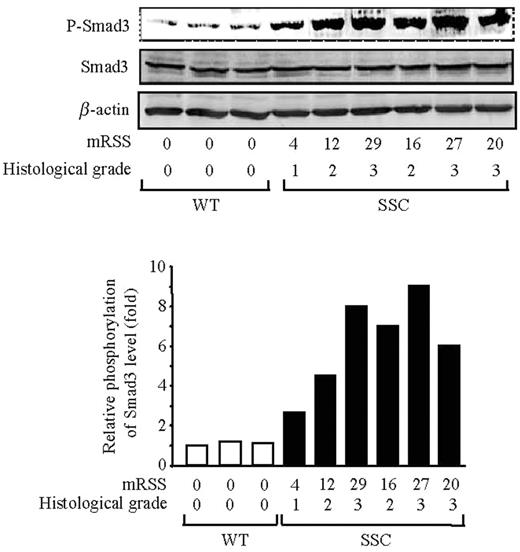
Correlation between Smad3 phosphorylation levels in fibroblast cultures and the mRSS of donor patients measured by the clinician at time of skin biopsy and the histological grade of fibrosis (defined in Table 2 ). Western analysis of whole-cell lysates for phospho-Smad3, Smad3 and β-actin levels. Lane 1–3: normal fibroblasts, lane 4–9: SSc fibroblasts. The ratio of phospho-Smad3 to Smad3 is plotted in the diagram as one representative experiment of three separate experiments (lower panel).
COL1A2 and PAI-1 mRNA steady state levels are increased in SSc fibroblasts
To better ascertain the correlation between the increased Smad3 signalling pathway in vitro and the patients’ skin score, we compared the mRNA level of COL1A2 and PAI-1 two TGF-β/Smad3 targets [ 22 , 23 ], by quantitative RT-PCR from SSc and normal fibroblasts obtained by explanting skin punch biopsies from three healthy donors and six SSc patients. As shown in Fig. 6 , elevated levels of COL1A2 and PAI-1 mRNA steady-state levels were observed in SSc fibroblasts as compared with normal fibroblasts. Similar to what was observed for Smad3 phosphorylation, the levels of COL1A2 and PAI-1 mRNAs were increased in parallel with the value of the mRSS, therefore with the histological grade of fibrosis, indicating that SSc skin fibroblasts maintain their activated/fibrotic phenotype following explant culture.
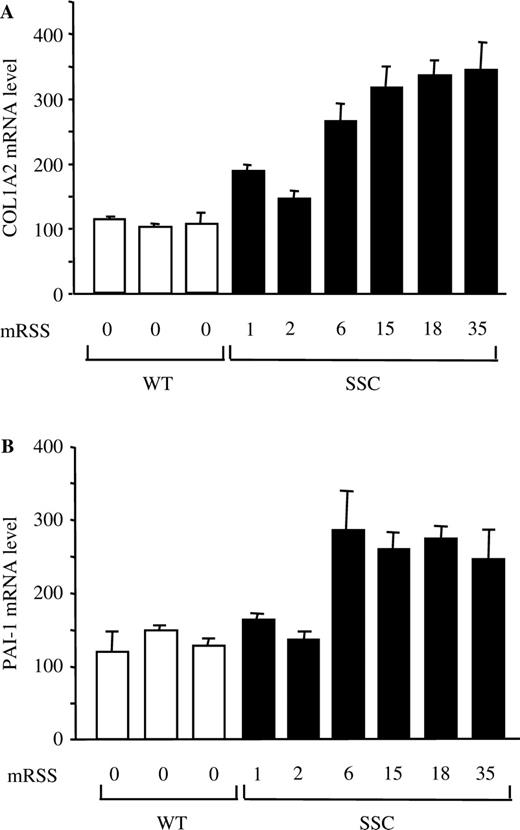
Elevated COL1A2 and PAI-1 mRNA levels in SSc fibroblasts. Total RNA was extracted from normal (white bars) or SSc (black) fibroblast cultured and relative COL1A2 ( A ) and PAI-1 ( B ) mRNA levels were determined by quantitative RT-PCR. Bars indicate mean ± s.d . of two independent experiments performed each with duplicate samples.
Decline of the SSc skin fibrotic process after HSCT
In five consecutive patients treated by HSCT ( Table 3 ), a repeated skin biopsy was performed in the same body area within 6 up to a maximum of 48 months after transplantation. Meanwhile, repeated clinical evaluation showed a fall in the mRSS compared with values at inclusion for each patient. Double-blind analysis of the skin biopsies performed at the same time showed regression of the histological degree of fibrosis both in the papillary dermis and in the three sublayers of reticular dermis after HSCT ( Fig. 7 ).
Histological and clinical evolution of the extent of skin fibrosis in the five SSc patients treated by HSCT
| DRD | MRD | SRD | PD | Grade of fibrosis | mRSS | |||
|---|---|---|---|---|---|---|---|---|
| Patient 4 | Biopsy 6 | before HSCT | +++ | +++ | ++ | + | 3 | 27 |
| Biopsy 7 | 9 months after HSCT | +++ | +++ | + | + | 3 | 15 | |
| Patient 15 | Biopsy 25 | before HSCT | +++ | +++ | ++ | + | 3 | 33 |
| Biopsy 26 | 9 months after HSCT | +++ | ++ | + | 0 | 2 | 18 | |
| Patient 25 | Biopsy 37 | before HSCT | +++ | +++ | ++ | + | 3 | 29 |
| Biopsy 38 | 9 months after HSCT | +++ | ++ | + | 0 | 2 | 17 | |
| Biopsy 39 | 30 months after HSCT | + | + | + | 0 | 1 | 4 | |
| Patient 26 | Biopsy 40 | before HSCT | +++ | +++ | ++ | + | 3 | 23 |
| Biopsy 41 | 36 months after HSCT | ++ | + | + | 0 | 2 | 5 | |
| Biopsy 42 | 48 months after HSCT | ++ | ++ | + | 0 | 2 | 6 | |
| Patient 27 | Biopsy 43 | before HSCT | +++ | +++ | +++ | + | 3 | 22 |
| Biopsy 44 | 6 months after HSCT | +++ | ++ | ++ | + | 2 | 12 | |
| Biopsy 45 | 12 months after HSCT | +++ | ++ | ++ | + | 2 | 14 |
PD, papillary dermis; SRD, superficial reticular dermis; MRD, median reticular dermis; PRD, deep reticular dermis; mRSS, modified Rodnan skin score at time of skin biopsy.
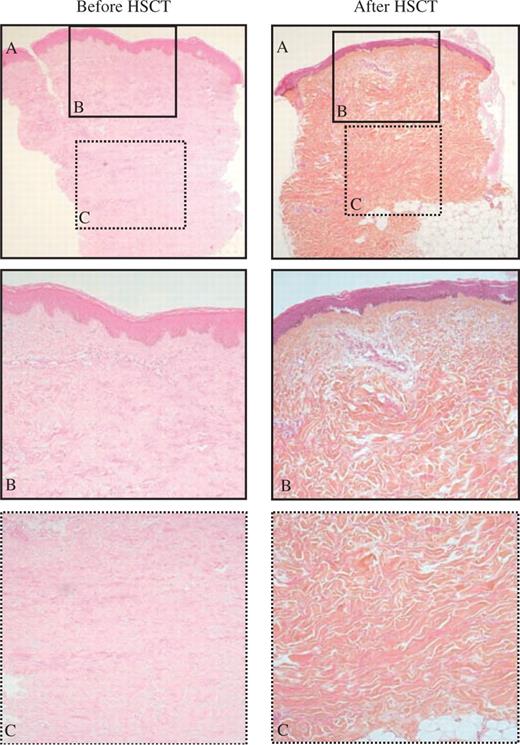
Regression of the SSc skin fibrotic process after autologous haematopoietic stem cell transplantation. Typical skin sections stained with haematoxylin–eosin–safran as observed in patient 27 before (biopsy number 44) and after (biopsy number 45) HSCT.
Discussion
Although the exact pathogenesis of SSc is still unknown, excessive deposition of collagen and of other connective tissue macromolecules in the dermis and in the subcutaneous tissue is the hallmark of both localized and diffuse SSc [ 1 ]. Activation of the immune response, especially T-cell activation [ 24 ], could also play a central role in the pathogenesis of SSc and is the rationale for using immunosuppressive drugs for the treatment of severe SSc [ 25 ]. However, the interaction between the various mechanisms accounting for enhanced collagen synthesis and activation of the immune response remains to be elucidated. There is now strong evidence that fibroblast activation contributes for a large part to the fibrotic process in SSc lesions. In vitro , cultured fibroblasts derived from SSc patients exhibit a fibrogenic phenotype with sustained activation of the genes encoding for the ECM proteins [ 26 ]. Assessment of the extent of fibrosis is difficult due to the SSc clinical heterogeneity [ 5 ].
To our knowledge only one study has yet analysed the correlation between the clinical severity of the skin involvement, as measured by the mRSS, and skin biopsy thickness [ 27 ]. This pioneering work showed a strong correlation between total and forearm skin scores and both wet and dry forearm skin biopsy weights, supporting the usefulness of the skin scores in differentiating SSc diseases subtypes. However, no other histopathological analysis was performed in this study. Other evaluations have been employed to quantify and document changes in SSc skin thickening over time. When studying the differences between localized and diffuse SSc in biopsy specimen of similar anatomic regions, Torres et al . [ 28 ] observed that the dermis was markedly thickened in 44% of the localized SSc patients and moderately thickened in 48% of the SSc patients. In addition collagen bundles in SSc were found mostly in the lower reticular dermis, whereas in localized SSc they were noted throughout the entire dermis [ 28 ]. In our study, using standard matrix and collagen staining techniques plus double-blind optic microscopy analysis, we classified the severity of cutaneous fibrosis in three subgroups with either weak (grade 1), moderate (grade 2) or severe (grade 3) histological degree of fibrosis. This arbitrary scoring system was first constructed by observing the process within the various anatomical structures and then by semi-quantitative scoring of the observed differences in optic microscopy, as recommended [ 29 ]. The same methodology has shown its benefits to assess various other pathological types of fibrosis such as in liver cirrhosis (child score), organ transplant chronic graft rejection [ 28 ] or lung fibrosis. Interestingly here, the extent of fibrosis within each layer of the dermis and the epidermis was quoted using the same classical scale from 1 to 3 for grading the intensity of the process, whereas the same scale had been used to construct the clinical mRSS. Semi-quantitative skin scoring by the modified Rodnan skin thickness score, using a simple scale from 1 (mild) to 3 (severe) of 17 skin sites (maximum score of 51) is reliable, reproducible and easy to use [ 4 , 30 ]. The inter-observer variability of the modified Rodnan skin thickness score has been documented in two independent studies in which multi examiners assessed many SSc patients in a blinded fashion [ 30 , 31 ]. In the present study, the clinico-pathological analysis of skin fibrosis was performed in patients with early rapidly progressing diffuse SSc either before ( n = 9) or after ( n = 36) treatment, including HSCT. In some cases, their mRSS was <15 due to improvement by previous immunosuppressive treatment. All samples were analysed twice, by two different investigators blinded to each other. This allowed to evaluate inter-observer agreement of the proposed score using κ-statistics. The inter and intra-observer agreements for histological grading were good, despite quite wide CIs due to the moderate sample size. The clinical severity of the disease correlated with changes in skin thickening as well as with the ECM molecular organization. The skin fibrosis process firstly appeared in the deep dermis and progressed toward the papillary dermis in parallel with an increase in its clinical extent as clinically assessed by the mRSS values.
TGF-β directly contributes to the fibrotic process via the modulation of the ECM genes transcriptional response. In this context, the second messengers involved in the TGF-β signalling pathway are of considerable interest. The profibrotic role of Smad3 has been established in the expression of type I collagen [ 32 , 33 ]. In addition to the stimulation of these matrix related genes, the Smad3/Smad4 complexes mediate the repression of collagenase genes [ 33 ] and the activation of PA-1 expression [ 22 ], further contributing to the TGF-β profibrotic action.
Mori et al . [ 34 ] performed immunohistochemical analysis of skin biopsies in non-lesional areas from 17 SSc patients, and examined Smad expression in fibroblast cultures from 5 SSc patients. Both experimental approaches showed that Smad2 and Smad3 expression and their nuclear translocation were increased in samples from SSc patients. No direct correlation between the status of Smad expression and the severity of the disease was previously established. Intriguingly, elevated Smad3 staining was consistently observed in the epidermal compartment of SSc skin compared with normal skin samples, accompanied with increased nuclear staining ( Fig. 4 A and B). Why keratinocytes exhibit elevated Smad3 expression will require further investigations. The weak Smad3 staining in the dermal compartment in vivo , both in normal and SSc skin, may be due to sparse cellularity. However, constitutive activation of the Smad pathway in SSc fibroblasts was demonstrated in cultured fibroblasts obtained by explant. Together, these data further emphasize the activation of the TGF-β/Smad pathway during the onset of SSc disease. Indeed, the clinical severity of the disease assessed by the mRSS paralleled the activation of TGF-/Smad signalling pathway, and elevated levels of COL1A2 and PAI-1 mRNA, two TGF-β/Smad3 targets, in cultured SSc dermal fibroblasts in comparison with normal controls. To our knowledge, such association has not been reported previously.
Dong et al . [ 35 ] previously reported a reduction of Smad7 expression in five SSc-derived fibroblast cultures as compared with fibroblast cultures from unaffected areas of the same patients. In our study, Smad7 expression was detected in keratinocytes, fibroblasts and in the vascular endothelium, with no difference between SSc lesions and normal controls, in accordance with observations by Mori et al . [ 34 ]. However, by definition in diffuse SSc, the skin involvement concerns the whole body surface, although with variable severity according to various sites. Sustained activation of TGF-β signalling in fibroblast cultures suggests that activation of the TGF-/Smad pathway may represent an intrinsic defect in SSc tissues fibroblasts, that could contribute to the development of autonomous SSc lesions in the absence of altered circulatory or systemic factors [ 36 ].
The five consecutive patients treated by autologous HSCT improved with either partial or complete clinical responses and a rapid fall in their mRSS, as already reported within the first year after HSCT in larger groups of patients [ 11 , 12 , 21 ]. The repeated skin biopsies obtained in the same body area before and after HSCT enabled us to observe regression of the fibrotic process first in the papillary dermis, then in the deep dermis. These promising results suggest that blockade of the autoimmune response after HSCT inhibits the signals leading to increased ECM synthesis. At this time, it is difficult to speculate about the relative contribution of HSCT per se vs immunosuppression in the results observed in SSc patients treated by HSCT. Ongoing prospective randomized clinical trials performed at a larger European ( www.astistrial.com ) or North American (SCOT trial) scale comparing autologous HSCT to monthly cyclophosphamide with clinical and skin biopsies studies in both groups of SSc patients will help address this issue.
In conclusion, we present for the first time a correlation between standard histological analysis of the various patterns of fibrosis in SSc tissue and the clinical severity of the disease assessed by the mRSS. We also unveil the association between P-Smad3 levels, representative of activated TGF-β signalling, and the fibrosis-related Smad target genes COL1A2 and PAI-1 , in SSc derived fibroblasts and the mRSS. Furthermore, we identify parallel clinical and histological regression of skin fibrosis in SSc patients after HSCT, which will have to be confirmed in a larger number of patients.
Acknowledgements
This work was supported by INSERM, PNRDerm (Programme National de Recherche en Dermatologie), the Association des Slérodermiques de France (ASF, www.slerodermique.com ), the Groupe Français de Recherche sur la Sclérodermie (GFRS, www.sclerodermie.org ), the Délégation Régionale à la Recherche Clinique (DRRC) from the Assistance Publique-Hôpitaux de Paris (AP-HP), the French Ministry of Health (PHRC 1997 AOM 97–030) and the Etablissement Français des Greffes (2003). We thank Mrs Douhaeret and Mrs Parlier for technical assistance.
The authors have declared no conflicts of interest.

Comments