


Abstract
Objective. To estimate the costs of glucocorticoid associated adverse events (GAEs) in patients with rheumatoid arthritis (RA).
Methods. We conducted a literature review of studies reporting GAEs in RA patients, and developed a Markov model with the following GAEs: fractures (vertebral, hip, pelvic), hypertension, diabetes, gastrointestinal complications, pneumonia, urinary tract infection, cataract and, in an extended model, myocardial infarction (MI) and stroke. Two-year total costs were calculated using direct medical costs (2001 US dollars) and by running 10,000 Monte Carlo simulations with probability values randomly selected from the GAE literature.
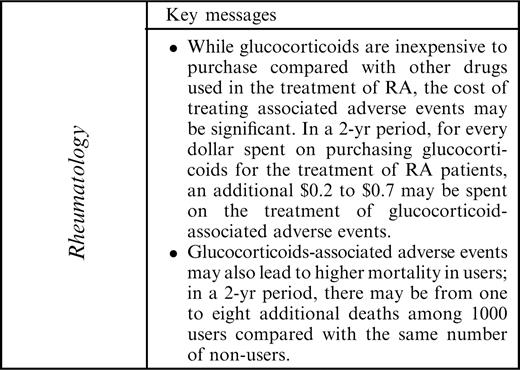
Results. On average, glucocorticoid users spent $445 more than non-users, or $0.46 for each dollar spent on purchasing the drug. When adding MI and stroke, users spent on average $430 more than non-users, or $0.44 for each dollar spent on purchasing the drug; this incremental cost ranged from $193 to $682 if MI and stroke were excluded, respectively. In 70% of the simulations there were more deaths among users than among non-users, in both the model with and without MI and stroke.
Conclusions. Although results varied depending on attributed GAEs, in general glucocorticoid users spent more than non-users on GAE treatment, and had higher mortality. Patients, providers and policy makers should consider these potential costs of GAEs when making treatment decisions.
Glucocorticoids are chronically used by an estimated 1 million Americans and are considered an affordable therapy for the treatment of many chronic inflammatory diseases [1]. In patients with early active rheumatoid arthritis (RA), glucocorticoids may reduce bone erosions [2–4]. However, serious glucocorticoid-associated adverse events (GAEs) occur frequently in a dose-dependent fashion [5, 6]. Bone loss leading to osteoporotic fractures is reported in up to 50% of patients using glucocorticoids chronically [7, 8]. A recent Dutch study conducted by van Everdingen and colleagues (the Utrecht trial) has been one of very few randomized placebo controlled trials of glucocorticoid monotherapy in RA; this study identified adverse events occurring in glucocorticoid users and controls, and thus those potentially attributable to glucocorticoid use [4]. The association between the occurrence of an adverse event and the use of glucocorticoids is often confounded by the concurrent use of other medications such as disease-modifying anti-rheumatic drugs (DMARDs) and non-steroidal anti-inflammatory drugs (NSAIDs). However, it is important to identify the consequences of adverse events likely to be attributable to glucocorticoid use since these agents represent an affordable therapeutic option that is often added to other regimens.
Healthcare costs associated with glucocorticoids include both those due to the purchase price as well as those resulting from their potential GAEs. For many medications the largest component of their cost is that resulting from associated adverse events [9, 10]. Therefore, despite the low price of glucocorticoids compared with other RA therapies, iatrogenic costs could be a significant component of the total cost of treatment with these drugs. To evaluate the healthcare costs of glucocorticoid-associated morbidity, we developed a decision analytic model that compared healthcare costs in glucocorticoid users and non-users.
Methods
Economic model development
We developed a Markov model with seven health states: no adverse events (NOAE), fracture (FRAC), hypertension (HTN), diabetes (DIAB), fracture and hypertension (FRACHTN), fracture and diabetes (FRACDIAB) and death (DEATH) (Fig. 1). In each of these states except DEATH, a patient could also acquire a gastrointestinal (GI) complication, a cataract or a serious infection, i.e. pneumonia and urinary tract infection (UTI) noted most commonly in an early study [5]. Osteoporosis fractures of interest were vertebral, pelvic and hip. Although the association of a myocardial infarction (MI) and stroke with glucocorticoid use is highly contentious [11–13], for completeness, we extended the model to include these costly adverse events.
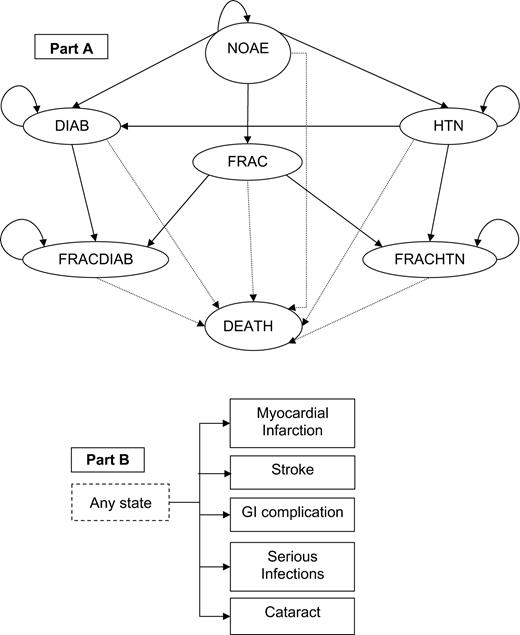
Patients started in the no-adverse-event state (NOAE) and at each cycle they could transition to the hypertension state (HTN), the diabetes state (DIAB), the fracture state (FRAC) or the death state (DEATH) (A). If a person in the HTN state developed diabetes, he/she would move to DIAB, or if he/she had a fracture, he/she would transition to fracture hypertension (FRACHTN) state. If a patient in the DIAB state developed hypertension, he/she would stay in DIAB, or if he/she had a fracture, he/she would move to fracture-diabetes (FRACDIAB). In any of the health states, patients could also acquire a GI complication, a cataract, a serious infection such as pneumonia and urinary tract infection, a myocardial infarction, or a stroke (B); these events lasted only one cycle. Patients could also transition to the DEATH state following an MI, a stroke, a hip fracture, or a GI complication.
The model had duration of 2 yr, divided into 6-month cycles. The length of follow-up was chosen to allow a direct comparison with the results of the unique Utrecht trial, and it was further justified by considering the waning effects of glucocorticoids on disease activity after approximately 2 yr of therapy [4, 13–16]. The hypothetical patient was a 60-yr-old individual with early RA and no other prevalent conditions such as diabetes or hypertension. We argue that glucocorticoids would be more expensive in patients with significant co-morbidities at the beginning of the 2-yr period than for patients without. To best assess the independent effect of glucocorticoids, a user was compared with a non-user who was not on any RA specific therapy, although glucocorticoid monotherapy is not commonly used in RA management.
The model starts with all individuals in the NOAE state. The probability of acquiring a GAE was the same no matter what health state patients were in, except for the probability of acquiring MI and stroke in patients with diabetes and hypertension. We assumed that patients could acquire only one of these relatively uncommon GAEs per 6-month cycle, and that GI complications, cataract, pneumonia, UTI, MI, or stroke lasted only one cycle. Patients who developed hypertension, diabetes or had a fracture moved to states HTN, DIAB and FRAC, respectively (Fig. 1). Hypertension and diabetes were acquired in the middle of the cycle, and thus, total costs were adjusted using the half-cycle correction. Patients in the FRAC, FRACHTN and FRACDIAB states differed from patients in other states because of a higher probability of subsequent fractures.
Further: (i) if a person in the HTN state had a fracture, he/she moved to the combined FRACHTN state; (ii) if a patient in the DIAB state had a fracture, he/she would move to FRACDIAB; (iii) if a person in the HTN state developed diabetes, he/she moved to DIAB; and (iv) if a patient in DIAB developed hypertension, he/she would stay in DIAB. We assumed that hypertensive treatment did not alter the average cost of diabetes since this would include the treatment of the high proportion of hypertensive diabetics [17, 18]. Moreover, from reviewing studies on diabetic and/or hypertensive patients, we found that the probabilities of suffering from a stroke or an MI were similar for a diabetic person with or without hypertension [18–25], while they were higher for a hypertensive person with diabetes than for one without diabetes [19, 26–28].
Incidence of glucocorticoid-associated adverse events
A literature review identified GAEs that have most commonly been associated with glucocorticoid use and it also determined the probability of occurrence. We searched for Medline and Pubmed articles published in English from 1980 to October 2004 that contained the terms: (i) rheumatoid arthritis and glucocorticoids, (ii) rheumatoid arthritis and adverse events, (iii) glucocorticoids and adverse events. Reference lists of the selected articles were reviewed for additional reports of interest.
We considered randomized controlled trials, open label trials and observational studies that met the following criteria: subjects in the treatment group received low-dose glucocorticoids (<15 mg/day prednisone or equivalent), subjects in the control group did not receive an active therapy and at least 6 months of GAE data were reported. Potential GAEs were those most commonly reported and for which probability estimates could be reliably quantified. Additionally, we restricted our attention to vertebral, hip and pelvic fractures because they were the most commonly identified osteoporotic fractures and those leading to the greatest morbidity [4, 29].
The literature search yielded 224 articles, of which 45 met inclusion criteria. Among those that did not meet these criteria 9 were excluded because they reported a duration of glucocorticoid therapy shorter than 6 months, 41 because both control and experimental groups received glucocorticoids, or participants were taking other medications in addition to glucocorticoids, 61 because probabilities could not be computed since the studies were reviews, meta-analyses or reported incomplete data, 35 because dosage was not specified or was above 15 mg/day and 33 because GAEs were recorded as decreases in bone mineral density, not as fracture rates. References for the selected studies are reported in Table 1.
Probabilities and unit costs of adverse events associated with glucocorticoid use and non-use
| Six-month probabilitya (%) | Costs (2001 USD) | |||||||
|---|---|---|---|---|---|---|---|---|
| Adverse event | Non-users | Users | References | Value | References | |||
| Osteoporotic fractures: | ||||||||
| Hip | 0.08 (0.00–0.36) | 0.14 (0.00–0.49) | 4, 6, 7, 58, 59 | $15,000 | 30–34, 36 | |||
| Vertebral | 0.04 (0.00–1.6) | 0.13 (0.12–5.56) | 4, 6, 7, 53, 57–60 | $1500 | 32, 36 | |||
| Pelvic | 0.03 (0.01–0.06) | 0.18 (0.05–0.63) | 4, 6, 7, 58 | $8500 | 30 | |||
| GI complication | 0.27 (0.05–1.24) | 0.90 (0.43–1.06) | 4, 5, 53, 61 | Out-patient $400, | 35, 37 | |||
| Hospitalization $7000, | 35, 37 | |||||||
| Surgery $32,000 | 35, 37 | |||||||
| Serious infections: | ||||||||
| Pneumonia | 1.66 (0.07–6.01) | 2.25 (0.29–7.72) | 4, 5 | $1500 | 38–40 | |||
| Urinary tract infection | 0.39 (0.07–1.24) | 0.44 (0.15–1.27) | 4, 5 | $100 | 41–43 | |||
| Cataract | 0.73 (0.00–1.41) | 2.38 (0.63–3.0) | 4–6, 62, 63 | $3800 | 44 | |||
| Myocardial infarction | 0.14 (0.00–0.22) | 0.36 (0.21–0.63) | 4, 5, 53 | $23,000 | 45, 46 | |||
| Stroke | 0.36 (0.07–1.24) | 0.28 (0.0–0.44) | 4, 5, 53 | $21,000 | 46, 47 | |||
| Hypertension | 0.52 (0.00–3.88) | 0.96 (0.0–0.47) | 4, 55, 61, 64 | Initial $1000, follow-up $300 | 47, 50, 51 | |||
| Diabetes mellitus | 0.34 (0.22–0.62) | 0.55 (0.0–1.27) | 4, 5, 64 | Initial $1400, follow-up $1500 | 48 (initial), 49 (follow-up) | |||
aAverage probability values weighted by sample size of reference studies, and lowest and highest values of probabilities from reference studies in parentheses.
We calculated the probabilities of developing GAEs by dividing the number of people with a GAE by the total number of patients in the appropriate treatment or control group in each of the selected studies. Probabilities were transformed into 6-month probabilities with the underlying assumption that they did not increase or decrease as a function of time. The formula used to transform an n-yr probability into an m-yr probability was Pm = 1 − (1 − Pn)m/n. We then specified triangular distributions for the 6-month probabilities of each GAE to be used in the Monte Carlo simulations described below. These distributions were assigned the lowest and highest probability values found in the literature for a specific GAE, and, as the most common value, the average probability value across all studies weighted by sample size (Table 1).
Costs of GAEs and further assumptions of the economic model
The costs of each adverse event are shown in Table 1. Table 2 contains other assumptions used in the economic model. We included only direct medical costs, and therefore we chose the perspective of a third party payer providing comprehensive healthcare coverage to patients. Costs were updated to 2001 US dollars (USD) by using the medical care component of the Consumer Price Index. Costs were discounted using the 6-month equivalent of an annual discount rate of 3%.
Additional inputs for the economic model
| Probability of | Values (%) | References |
|---|---|---|
| MI in diabetic patients (per 6-month cycle) | 0.9 | 18–25 |
| Stroke in diabetic patients (per 6-month cycle) | 0.6 | 18–25 |
| MI in hypertensive patients (per 6-month cycle) | 0.6 | 19, 26–28 |
| Stroke in hypertensive patients (per 6-month cycle) | 0.45 | 19, 26–28 |
| Secondary fracture | 20 | 65 |
| Symptomatic vertebral fracture | 30 | 32, 36 |
| Symptomatic pelvic fracture | 50 | 32 |
| Surgical removal of cataract | 30 | 66, 67 |
| Hospitalization for GI complications | 67 | 35 |
| Surgical treatment for GI complications | 39 | 35 |
| Death following hip fracture | 20 | 33, 34 |
| Death following MI | 20 | 46 |
| Death following stroke | 20 | 46 |
| Death following hospitalization for GI complication | 12 | 35 |
| Death following pneumonia | 15 | 39 |
| Death from other causes (per 6-month cycle) | 0.4 | 68 |
To obtain GAE costs, we conducted a Medline search for articles that contained the words cost and the specific adverse event in the title or abstract. We included cost and cost-effectiveness analyses conducted in the US, and selected the most recent studies to reflect current management of disease. We restricted our attention to studies that provided cost per event, or per year for chronic conditions, estimated costs using microcosting, or Medicare reimbursements, or charges adjusted with a cost/charge ratio.
The cost of a hip fracture ranged from $13,500 to $22,561 in the 6 months after the event [30–32]. These figures were similar to those used in previous economic models [33–35]. In this paper, we used a conservative value of $15,000 (Table 1). After examining costs and assumptions of two studies that reported costs of vertebral fractures, we conservatively estimated a cost of $1500 per symptomatic event (Table 1) [32, 36]. The cost of pelvic fracture was estimated at $8500 (2001 USD) per symptomatic fracture [30]. We assumed that 50% of these fractures are symptomatic since Chrischilles and colleagues estimated that for fractures other than at the hip, vertebra or wrist, approximately 55% required medical attention [32].
We used a recent study on the cost-effectiveness of low-dose corticosteroids versus NSAIDs and COX-2 inhibitors to obtain the cost of GI complications [35]. These were similar to the 2001 updated costs used by Ko and Deyo [37]. The cost of community-acquired pneumonia has been reported to be between $5250 and $10,500 (in 2001 USD) per patient hospitalized, and between $250 and $460 per patient not needing immediate hospitalization [38–40]. Since about 20% of individuals with community-acquired pneumonia need to be hospitalized [39], we calculated a weighted average cost of $1500 (Table 1). Studies of uncomplicated UTI in women have reported costs ranging from $50 to $150 depending on the treatment received [41–43]. We did not find studies that included the cost of complicated UTIs; however, since only 2% of cases are complicated [5], our chosen cost appeared reasonable. The cost of cataract surgery was derived from a study that investigated the cost of a complete episode of extracapsular cataract extraction [44].
The cost of a non-fatal MI ranges from about $9000 to $38,000, and that of a fatal case from $12,000 to $19,000 [17, 45, 46]. Assuming costs of $25,000 for a non-fatal MI, $15,000 for a fatal one and a 20% MI mortality [46], we used a cost per case of MI of $23,000 (Table 1). The cost of stroke was $21,000 based on studies that have included initial hospitalization, follow up and rehabilitation for a subset of survivors (Table 1) [17, 46, 47].
Diabetes costs were obtained from two reports of incremental costs in the 8 yr before and after diagnosis [48, 49]. In the year of diagnosis, the cost of a patient with this GAE was over $4600 higher than the cost of a person without it, and excluding the cost of diagnosis or initial hospitalization, it was more than $3200 higher [48, 49]. Thus, we set the cost of diagnosis of diabetes at $1400, and the 6-month follow-up cost at $1500 (Table 1).
The cost of hypertension chosen was $1000 in the cycle of diagnosis and $300 for the 6 month follow-up period (Table 1). In one study, the least costly treatment for hypertension was $794 in the first year and approximately $400 in the second and third [50], while the most expensive scenario was almost $1120 in the first year and $780 in the follow-up years [50]. Other investigators reported initial costs of almost $1200 and annual follow-up costs of about $700 to $800 [47, 51].
Analysis
We ran 10,000 Monte Carlo simulations randomly selecting probability values from the triangular distributions specified for the probabilities of GAEs. This technique allowed us to simultaneously examine combinations of multiple probability values of GAEs. All decision analyses were conducted using Data (version 3.9, Treeage Software, Cambridge, MA). We determined means, standard deviations and percentile values for the 2-yr total costs and number of deaths of users and non-users, and for the difference between the two groups. The simulations were repeated for the model without MI and stroke, and for the model with these cardiovascular adverse events.
We defined the iatrogenic cost factor (ICF) as the total cost of glucocorticoids (cost of purchasing the drug plus the cost associated with GAEs) divided by the cost of purchasing glucocorticoids, and the glucocorticoid-attributable ICF (G-IFC) as the cost of purchasing the glucocorticoids plus the difference in costs between users and non-users divided by the cost of purchasing the drug. Furthermore, we ran the Markov model using the probability values calculated from the Utrecht study to compare to the results of the simulations (Utrecht study scenario).
In sensitivity analyses, we used data from the Utrecht study to simulate the effect of more than one event per person with an event. In that study, there were 1.4 events of pneumonia and 2 events of vertebral fracture for each control patient experiencing these events, and there were 1.2, 1.4 and 1.5 events of pneumonia, vertebral fracture and UTI, respectively, for each glucocorticoid user experiencing these events [4]. Simulations were repeated eliminating one GAE at the time (by setting its probability equal to zero) to determine the effect of each one on the costs and number of deaths. Furthermore, we ran the simulations for different levels of costs (−25%, −50%, +25%, +50%, +100%), and increasing the duration of therapy to 10 yr. For all these simulations, we used the same random drawing of probability values.
Lastly, we recalculated the probabilities for users and non-users assuming that no GAEs would occur in the first 6 months and in the first year following the start of glucocorticoids. In order to do this, we assumed that the probability value reported in each study was still the cumulative rate of occurrence of the GAE over the follow-up period.
Results
In the model without MI and stroke, results from the Monte Carlo simulations determined that on average glucocorticoid users spent $1142 in a 2-yr period and non-users spent about $445 less (Table 3). The 2-yr retail cost for 10 mg per day of prednisone is about $970, yielding an average ICF of about 2.18 and a G-ICF of 1.46. In 2.8% of the simulations, users had lower costs than non-users. On average, the number of deaths in the 2-yr period was higher among users (Table 3). However, in about 30% of the simulations the number of deaths was lower among users than among non-users. If multiple events per person with GAE were considered, users would spend about $427 and have 0.006 deaths more than non-users (results not shown).
Two-year costs (2001 USD) of glucocorticoid-associated adverse events and number of deaths—results from Monte Carlo simulations
| Costs | Number of deaths | |||||||||||||
|---|---|---|---|---|---|---|---|---|---|---|---|---|---|---|
| Glucocorticoid | Glucocorticoid | |||||||||||||
| Non-users | Users | Δa | G-ICFb | Non-users | Users | Δa | ||||||||
| Model without MI and stroke | ||||||||||||||
| Mean | 696.8 | 1142.2 | 445.4 | 1.46 | 0.034 | 0.040 | 0.006 | |||||||
| s.d. | 155.0 | 165.9 | 227.4 | 0.007 | 0.009 | 0.012 | ||||||||
| Percentile | ||||||||||||||
| 5% | 454.2 | 872.9 | 64.4 | 1.07 | 0.023 | 0.027 | −0.013 | |||||||
| 25% | 585.6 | 1027.1 | 293.0 | 1.30 | 0.028 | 0.033 | −0.002 | |||||||
| 50% | 689.7 | 1139.5 | 444.9 | 1.46 | 0.033 | 0.039 | 0.006 | |||||||
| 75% | 799.7 | 1253.7 | 600.8 | 1.62 | 0.039 | 0.046 | 0.014 | |||||||
| 95% | 965.0 | 1417.1 | 817.2 | 1.84 | 0.047 | 0.056 | 0.026 | |||||||
| Model with MI and stroke | ||||||||||||||
| Mean | 1237.5 | 1667.1 | 429.6 | 1.44 | 0.039 | 0.045 | 0.006 | |||||||
| s.d. | 247.7 | 190.9 | 313.8 | 0.008 | 0.009 | 0.012 | ||||||||
| Percentile | ||||||||||||||
| 5% | 848.8 | 1355.0 | −94.5 | 0.90 | 0.028 | 0.032 | −0.013 | |||||||
| 25% | 1060.2 | 1535.0 | 219.1 | 1.23 | 0.033 | 0.038 | −0.002 | |||||||
| 50% | 1223.6 | 1666.4 | 437.5 | 1.45 | 0.038 | 0.043 | 0.005 | |||||||
| 75% | 1404.7 | 1797.9 | 646.6 | 1.67 | 0.044 | 0.051 | 0.014 | |||||||
| 95% | 1672.7 | 1984.4 | 933.3 | 1.96 | 0.052 | 0.061 | 0.025 | |||||||
aDifference between users and non-users.
bGlucocorticoid-attributable iatrogenic cost factor.
When we included MI and stroke, the costs for users and non-users were substantially higher than in the model without these cardiovascular events; however, the difference in costs between users and non-users was slightly smaller at about $430 (Table 3). The difference in number of deaths was 0.006 in this case also, but both users and non-users had a higher number of deaths (Table 3). In about 32% of the simulations users had fewer deaths than non-users. The average ICF was about 2.7 and the G-ICF was 1.44. If multiple events were considered, users would spend on average $411 and have 0.006 deaths more than non-users (results not shown).
Under the Utrecht study scenario, an RA patient on glucocorticoid therapy would spend about $1546, or $205 more than a non-user in a 2-yr period, and the G-IFC would be 1.21 (results not shown). There would be 62 deaths for every 1000 users, and 54 per 1000 non-users. If MI and stroke were included in the GAEs, users would spend $218 less than a patient not on therapy (results not shown). In this case, there would be about 67 deaths among 1000 users, and 63 among non-users, for a difference of 3.6 deaths. The smaller difference in the number of deaths compared with the scenario without stroke and MI is due to the fact that more non-users than users had strokes in the Utrecht trial [4].
The adverse events that had a larger impact on costs were GI complications and pneumonia (Table 4). In the model without MI and stroke, the difference in costs was smallest when GI complications were not considered (G-IFC of 1.34), while in the model with these cardiovascular events the difference was smallest when MI was not included (G-IFC equal to 1.20). Compared with baseline (Table 3), excluding pneumonia halved the number of deaths among users in both the models with and without MI and stroke (Table 4). The impact of hypertension and diabetes was modest on costs, and had no effect on the number of deaths even though individuals had higher risks of MI and stroke when they were in these chronic states (Table 4).
Two-year difference in costs (2001 USD) and number of deaths of glucocorticoid users and non-users when selected adverse events are not considered—results from Monte Carlo simulations
| Adverse event not included | Cost in users | Δa | G-ICFb | No of deaths in users | Δa | |||||
|---|---|---|---|---|---|---|---|---|---|---|
| Model without MI and strokec | ||||||||||
| Hip fracture (fx) | 1021.0 (153.9) | 407.8 (213.3) | 1.42 | 0.038 (0.009) | 0.006 (0.012) | |||||
| Vertebral fx | 1029.3 (147.6) | 363.2 (212.8) | 1.37 | 0.040 (0.009) | 0.006 (0.012) | |||||
| Pelvic fx | 1094.1 (164.9) | 400.0 (226.5) | 1.41 | 0.040 (0.009) | 0.006 (0.011) | |||||
| GI complication | 796.2 (157.4) | 326.5 (189.2) | 1.34 | 0.038 (0.009) | 0.005 (0.012) | |||||
| Pneumonia | 953.2 (141.8) | 401.3 (199.3) | 1.41 | 0.020 (0.001) | 0.001 (0.001) | |||||
| UTI | 1140.5 (166.8) | 406.1 (250.6) | 1.42 | 0.040 (0.009) | 0.006 (0.011) | |||||
| Cataract | 1057.2 (136.4) | 390.4 (225.2) | 1.40 | 0.040 (0.009) | 0.006 (0.012) | |||||
| Hypertension | 1018.6 (151.7) | 421.4 (208.6) | 1.43 | 0.040 (0.009) | 0.006 (0.012) | |||||
| Diabetes mellitus | 1044.7 (223.6) | 409.2 (223.6) | 1.42 | 0.040 (0.009) | 0.006 (0.012) | |||||
| Model with MI and stroked | ||||||||||
| MI | 1329.6 (176.9) | 193.4 (303.6) | 1.20 | 0.038 (0.007) | 0.004 (0.012) | |||||
| Stroke | 1483.4 (177.1) | 682.3 (236.8) | 1.70 | 0.043 (0.009) | 0.008 (0.012) | |||||
| Hip fx | 1546.6 (181.1) | 393.3 (305.5) | 1.40 | 0.043 (0.009) | 0.005 (0.012) | |||||
| Vertebral fx | 1553.2 (174.8) | 343.6 (302.0) | 1.35 | 0.044 (0.009) | 0.006 (0.012) | |||||
| Pelvic fx | 1621.8 (190.2) | 386.3 (313.4) | 1.40 | 0.045 (0.009) | 0.006 (0.012) | |||||
| GI complication | 1322.0 (180.2) | 308.2 (287.4) | 1.32 | 0.042 (0.009) | 0.005 (0.012) | |||||
| Pneumonia | 1483.0 (174.4) | 386.6 (296.6) | 1.40 | 0.025 (0.001) | 0.001 (0.002) | |||||
| UTI | 1666.9 (189.8) | 431.4 (310.8) | 1.44 | 0.044 (0.009) | 0.006 (0.012) | |||||
| Cataract | 1582.0 (189.0) | 374.6 (310.3) | 1.39 | 0.045 (0.009) | 0.006 (0.012) | |||||
| Hypertension | 1556.3 (183.2) | 403.9 (307.8) | 1.42 | 0.044 (0.009) | 0.006 (0.012) | |||||
| Diabetes mellitus | 1577.6 (186.3) | 399.3 (309.8) | 1.41 | 0.044 (0.009) | 0.006 (0.012) | |||||
aDifference between glucocorticoid users and non-users.
bGlucocorticoid-attributable iatrogenic cost factor.
cThe baseline cost of glucocorticoid users was $1142 (Δ = $445.4), and the number of deaths was 0.04 (Δ = 0.006).
dThe baseline cost of glucocorticoid users was $1667 (Δ = $429.6), and the number of deaths was 0.045 (Δ = 0.006).
Total costs of users and non-users, as well as the difference in these costs, increased almost linearly with increases in healthcare unit costs (results not shown). In both the model with and without MI and stroke, a reduction of all healthcare costs by 50% led to 50% lower costs for users, non-users and for the cost difference between these two groups. An increase in all healthcare costs by 50% led to a 51% increase in total costs of users, non-users and the difference between the two.
If the model was run for 10 yr instead of 2 yr, costs of users would be $6701, or $2280 more than non-users, about 5.9 and 5.1 times the same costs for the 2-yr period. The 10-yr ICF, 2.62, and the G-ICF, 1.55, were close to those for the shorter period. By the end of the period, there would be about 170 deaths per 1000 users, and 144 per 1000 non-users. In the model with MI and stroke, costs for users would be $8481, or $2127 more than non-users; these were about five times higher than the corresponding costs in the 2-yr period. The 10-yr IFC was 3.05 and the G-ICF was 1.51. The number of deaths was 184 per 1000 users and 162 per 1000 non-users, for a difference of 22, only 4 more deaths compared with the model without MI or stroke.
If GAEs were delayed by 6 months, on average, both users and non-users would spend less than in the case where GAEs were not delayed (Table 5). The difference in costs between users and non-users would be 28% and 34% lower than in the case where GAEs were not delayed in the model without and with MI and stroke, respectively (Table 5). If GAEs were delayed by 1 yr, users would spend on average $733 while non-users would spend $142 less in the model with MI and stroke, and users would spend $1107 and non-users $966 in the model with these events (Table 5). The difference in costs was about 50% and 67% lower than in the case where GAEs occurred from the beginning of the period in the model without and with MI and stroke, respectively.
Two-year costs (2001 USD) and number of deaths from glucocorticoid-associated adverse events (GAEs) developing 6 months or 1 yr from the beginning of therapy—results from Monte Carlo simulations
| Costs | Number of deaths | |||||||||||
|---|---|---|---|---|---|---|---|---|---|---|---|---|
| Glucocorticoid | Glucocorticoid | |||||||||||
| Non-users | Users | Δa | Non-users | Users | Δa | |||||||
| No GAEs in the first 6 months | ||||||||||||
| Model without MI and strokeb | ||||||||||||
| Mean | 605.8 | 928.6 | 322.8 | 0.068 | 0.073 | 0.005 | ||||||
| s.d. | 144.3 | 135.8 | 197.0 | 0.007 | 0.009 | 0.011 | ||||||
| Model with MI and strokec | ||||||||||||
| Mean | 1098.2 | 1380.5 | 282.3 | 0.073 | 0.077 | 0.005 | ||||||
| s.d. | 238.1 | 163.0 | 288.7 | 0.007 | 0.009 | 0.011 | ||||||
| No GAEs in the first year | ||||||||||||
| Model without MI and strokeb | ||||||||||||
| Mean | 518.7 | 733.2 | 214.5 | 0.066 | 0.07 | 0.004 | ||||||
| s.d. | 133.4 | 112.3 | 174.5 | 0.006 | 0.008 | 0.010 | ||||||
| Model with MI and strokec | ||||||||||||
| Mean | 965.7 | 1107.6 | 142.0 | 0.070 | 0.073 | 0.004 | ||||||
| s.d. | 228.6 | 144.8 | 271.2 | 0.007 | 0.008 | 0.011 | ||||||
aDifference between glucocorticoid users and non-users.
bThe baseline cost of glucocorticoid users was $1142 (Δ = $445.4), and the number of deaths was 0.040 (Δ = 0.006).
cThe baseline cost of glucocorticoid users was $1667 (Δ = $429.6), and the number of deaths was 0.045 (Δ = 0.006).
Discussion
Combining data from the literature on the adverse events associated with glucocorticoids in RA patients in a Monte Carlo simulation, we found that on average for each dollar spent on purchasing these drugs an additional $1.2 was spent on treatment of adverse events. However, only $0.46 of this additional cost was strictly attributable to glucocorticoid use. If MI and stroke were included as glucocorticoid-associated adverse events, $1.7 would be spent in addition to every dollar spent on purchasing the drug, of which $0.44 would be attributable to glucocorticoid use. Depending on the GAEs considered, this additional cost ranged from $0.34 to $0.43 in a model that did not include MI and stroke, and from $0.2 to $0.7 in a model that included these adverse events.
Considering only data from the Utrecht trial and not including MI and stroke, the difference in costs between users and non-users was about half of the mean difference found with our simulations. When MI and stroke were added, the results of the Utrecht trial were opposite to those of the simulations, i.e. users had lower costs than non-users. However, because of its small size and restricted generalizability, the Utrecht trial should be considered in the context of other reported studies [4]. Despite the scarcity of such glucocorticoid monotherapy studies, we were able to identify other studies that served as the basis for our estimates on the frequency of occurrence of GAEs, and thus arrive at more generalizable estimates of costs and mortality.
Our study is only one of very few attempts to calculate the total cost associated with glucocorticoid adverse effects. Previous economic studies of glucocorticoids have mainly addressed bone risk and strategies to prevent loss of bone mass [34, 35, 52]. In a cost-effectiveness analysis of low-dose glucocorticoids compared with NSAIDs, Bae et al. [35] estimated the iatrogenic cost of glucocorticoids due only to hip and other fracture, diabetes, cataract, glaucoma and infection. However, other GAEs are also worrisome and costly. In addition we considered hypertension, GI complications, MI and stroke; although we did not include glaucoma. We found that potential non-bone GAEs contribute substantially to healthcare costs, for example GI complications and pneumonia. Atherosclerotic vascular events weighed heavily on our estimated costs. However, cost differences between users and non-users were still substantial, even though these events were excluded. For example, when the association between MI and glucocorticoids use was not considered, the cost to users was almost $200 above that of non-users, and when stroke was not considered, the cost of users was about $680 higher than that of non-users.
The evidence of association between some of the GAEs we chose to include in our model is at times tenuous based on the absence of well-conducted studies in these areas [13]. Hypertension and MI are GAEs for which there is suggestive, albeit not definitive, evidence of an increased risk in glucocorticoid users. Although a number of investigations, including the Utrecht study, have postulated an association [4, 5, 53], attribution of MI to glucocorticoid therapy in RA is highly contentious [11, 12]. A small increase in the occurrence of hypertension for glucocorticoid users was noted by van Everdingen and colleagues and by other investigators [3, 4, 54, 55]. Due to its multifactorial aetiology, stroke is a GAE that is even more difficult to attribute to glucocorticoid use and most studies have not included stroke as a putative glucocorticoid adverse outcome. In the Utrecht study there was a trend towards a lower risk of stroke among those receiving glucocorticoids compared with non-users, and we therefore needed to include stroke in our analyses for completeness. Of interest, GI complications were actually less common among glucocorticoid users than among controls in the Utrecht study; this could be due to more substitute use of NSAIDs [4]. This is somewhat concordant with past literature showing that glucocorticoids alone lead to only a very modest increase in ulcer risk in some [5, 56] but not all studies [53, 57].
Our results highlight the variable literature on this topic but suggest a modest to moderate cost increase associated with glucocorticoid use if a broad array of studies on adverse effects are considered. However, one also needs to be cognizant of the potential health benefits of glucocorticoids seen over the same time period. Glucocorticoids have short- to moderate-term anti-inflammatory benefits and probably retard disease progression [3, 4, 14]. In the Utrecht trial, glucocorticoid users had significantly fewer bone erosions than non-users over the 2-yr time period, although the trial did not show a significant improvement in functional disability or general well-being [4]. Bae et al. [35] found that, among adults aged 50 and over, glucocorticoids were cheaper than NSAIDs and had lower morbidity and mortality associated with adverse events. Thus, the authors concluded that glucocorticoids were superior to NSAIDs based on the assumption that these two drugs were equally effective in the treatment of RA patients. Thus, further research into the cost-utility associated with the use of these drugs is clearly warranted. As a first step, the cost of potential adverse events is important new information when considering the use of glucocorticoid therapy. While glucocorticoids are inexpensive to purchase compared with other drugs used in the treatment of RA, the cost of the toxicity associated with these drugs may be significant.
Results of our study are subject to potential limitations. First, we may have overestimated the relative impact of glucocorticoid use on healthcare costs of RA patients because we compared glucocorticoid users with patients not on any systematic therapy; users of other therapies may be subject to other adverse events even more costly than GAEs. Second, we did not know the correlation among GAEs, and assumed that as the probability of a GAE increased, the probability of no adverse events would decrease; however, the probabilities of other GAEs may decrease instead. For this reason, we may have underestimated the probability of having no adverse events. Third, we did not consider a number of GAEs that were reported in the Utrecht study (i.e. skin ecchymoses, sleep disturbances, venous thrombosis and glaucoma) because either they did not have clearly identifiable costs or their occurrence with the lower-dose therapy used in RA was even more speculative than for the GAEs we included. Fourth, we assumed that the probability of occurrence of a GAE was constant over time, and this is not likely to be true for all GAEs. However, we recalculated costs assuming that GAEs were delayed by 6 months and 1 yr to partially address this limitation.
In summary, the incremental costs associated with GAEs exceeded $400 on a per person basis when all scientific evidence was considered. There was also a higher risk of mortality among users than non-users. A well-designed, albeit small clinical trial did not always support our general findings, highlighting why glucocorticoids remain a contentious, yet important component of our RA therapeutic armamentarium. Through careful consideration of the full spectrum of glucocorticoid risks and benefits patients, providers, payers and policy makers can arrive at more informed treatment decisions.
We wish to thank the participants of the CERTs external review committee and Steve Mennemeyer, PhD, for helpful discussions about this manuscript. This work was supported by grant number U18H510389 from the Agency for Health Care Research and Quality.
The authors declare no conflicts of interest.
References
Walsh LJ, Wong CA, Pringle M, Tattersfield AE. Use of oral corticosteroids in the community and the prevention of secondary osteoporosis: a cross sectional study.
Boers M, Verhoeven AC, Markusse HM et al. Randomised comparison of combined step-down prednisolone, methotrexate and sulphasalazine with sulphasalazine alone in early rheumatoid arthritis.
Kirwan JR. Systemic low-dose glucocorticoid treatment in rheumatoid arthritis.
van Everdingen AA, Jacobs JW, Siewertsz Van Reesema DR, Bijlsma JW. Low-dose prednisone therapy for patients with early active rheumatoid arthritis: clinical efficacy, disease-modifying properties and side effects: a randomized, double-blind, placebo-controlled clinical trial.
Saag KG, Koehnke R, Caldwell JR et al. Low dose long-term corticosteroid therapy in rheumatoid arthritis: an analysis of serious adverse events.
McDougall R, Sibley J, Haga M, Russell A. Outcome in patients with rheumatoid arthritis receiving prednisone compared to matched controls.
Michel BA, Bloch DA, Wolfe F, Fries JF. Fractures in rheumatoid arthritis: an evaluation of associated risk factors.
Solomon DH, Schneeweiss S, Glynn RJ, Levin R, Avorn J. Determinants of selective cyclooxygenase-2 inhibitor prescribing: are patient or physician characteristics more important?
Peris F, Martinez E, Badia X, Brosa M. Iatrogenic cost factors incorporating mild and moderate adverse events in the economic comparison of aceclofenac and other NSAIDs.
Kalbak K. Incidence of arteriosclerosis in patients with rheumatoid arthritis receiving long-term corticosteroid therapy.
Wolfe F, Mitchell DM, Sibley JT et al. The mortality of rheumatoid arthritis.
Bijlsma JW, Boers M, Saag KG, Furst DE. Glucocorticoids in the treatment of early and late RA.
Criswell LA, Saag KG, Sems KM et al. Moderate-term, low-dose corticosteroids for rheumatoid arthritis.
Conn DL, Lim SS. New role for an old friend: prednisone is a disease-modifying agent in early rheumatoid arthritis.
Boers M, Nurmohamed MT, Doelman CJ et al. Influence of glucocorticoids and disease activity on total and high density lipoprotein cholesterol in patients with rheumatoid arthritis.
Elliott WJ, Weir DR, Black HR. Cost-effectiveness of the lower treatment goal (of JNC VI) for diabetic hypertensive patients. Joint National Committee on Prevention, Detection, Evaluation and Treatment of High Blood Pressure.
Colhoun HM, Betteridge DJ, Durrington PN et al. Primary prevention of cardiovascular disease with atorvastatin in type 2 diabetes in the Collaborative Atorvastatin Diabetes Study (CARDS): multicentre randomised placebo-controlled trial.
Curb JD, Pressel SL, Cutler JA et al. Effect of diuretic-based antihypertensive treatment on cardiovascular disease risk in older diabetic patients with isolated systolic hypertension. Systolic Hypertension in the Elderly Program Cooperative Research Group.
Haffner SM, Lehto S, Ronnemaa T, Pyorala K, Laakso M. Mortality from coronary heart disease in subjects with type 2 diabetes and in nondiabetic subjects with and without prior myocardial infarction.
Tight blood pressure control and risk of macrovascular and microvascular complications in type 2 diabetes: UKPDS 38. UK Prospective Diabetes Study Group.
Estacio RO, Jeffers BW, Hiatt WR, Biggerstaff SL, Gifford N, Schrier RW. The effect of nisoldipine as compared with enalapril on cardiovascular outcomes in patients with non-insulin-dependent diabetes and hypertension.
Effects of ramipril on cardiovascular and microvascular outcomes in people with diabetes mellitus: results of the HOPE study and MICRO-HOPE substudy. Heart Outcomes Prevention Evaluation Study Investigators.
Lindholm L, Ibsen H, Dahlof B et al. Cardiovascular morbidity and mortality in patients with diabetes in the Losartan Intervention For Endpoint reduction in hypertension study (LIFE): A randomised control trial against atenolol.
Almdal T, Scharling H, Jensen JS, Vestergaard H. The independent effect of type 2 diabetes mellitus on ischemic heart disease, stroke and death: a population-based study of 13,000 men and women with 20 years of follow-up.
McMurray J. The health economics of the treatment of hyperlipidemia and hypertension.
Dahlof B, Devereux RB, Kjeldsen SE et al. Cardiovascular morbidity and mortality in the Losartan Intervention For Endpoint reduction in hypertension study (LIFE): a randomised trial against atenolol.
Major outcomes in moderately hypercholesterolemic, hypertensive patients randomized to pravastatin vs usual care: The Antihypertensive and Lipid-Lowering Treatment to Prevent Heart Attack Trial (ALLHAT-LLT).
Lukert BP, Raisz LG. Glucocorticoid-induced osteoporosis: pathogenesis and management.
Centers for Disease Control and Prevention. Incidence and costs to Medicare of fractures among Medicare beneficiaries aged > or = 65 years − United States, July 1991–June 1992.
Brainsky A, Glick H, Lydick E et al. The economic cost of hip fractures in community-dwelling older adults: a prospective study.
Chrischilles EA, Dasbach EJ, Rubenstein LM, Cook JR, Tabor HK, Black DM. The effect of alendronate on fracture-related healthcare utilization and costs: the fracture intervention trial.
Zacker C, Shea D. An economic evaluation of energy-absorbing flooring to prevent hip fractures.
Solomon DH, Kuntz KM. Should postmenopausal women with rheumatoid arthritis who are starting corticosteroid treatment be screened for osteoporosis? A cost-effectiveness analysis.
Bae SC, Corzillius M, Kuntz KM, Liang MH. Cost-effectiveness of low dose corticosteroids versus non-steroidal anti-inflammatory drugs and COX-2 specific inhibitors in the long-term treatment of rheumatoid arthritis.
Chrischilles E, Shireman T, Wallace R. Costs and health effects of osteoporotic fractures.
Ko CW, Deyo RA. Cost-effectiveness of strategies for primary prevention of nonsteroidal anti-inflammatory drug-induced peptic ulcer disease.
Omidvari K, de Boisblanc BP, Karam G, Nelson S, Haponik E, Summer W. Early transition to oral antibiotic therapy for community-acquired pneumonia: duration of therapy, clinical outcomes and cost analysis.
Dresser LD, Niederman MS, Paladino JA. Cost-effectiveness of gatifloxacin vs ceftriaxone with a macrolide for the treatment of community-acquired pneumonia.
Najib MM, Stein GE, Goss TF. Cost-effectiveness of sparfloxacin compared with other oral antimicrobials in outpatient treatment of community-acquired pneumonia.
Rubin N, Foxman B. The cost-effectiveness of placing urinary tract infection treatment over the counter.
Foxman B, Barlow R, D’Arcy H, Gillespie B, Sobel JD. Urinary tract infection: self-reported incidence and associated costs.
Le TP, Miller LG. Empirical therapy for uncomplicated urinary tract infections in an era of increasing antimicrobial resistance: a decision and cost analysis.
Steinberg EP, Javitt JC, Sharkey PD et al. The content and cost of cataract surgery.
Garber AM, Solomon NA. Cost-effectiveness of alternative test strategies for the diagnosis of coronary artery disease.
Sarasin FP, Gaspoz JM, Bounameaux H. Cost-effectiveness of new antiplatelet regimens used as secondary prevention of stroke or transient ischemic attack.
Thompson D, Edelsberg J, Colditz GA, Bird AP, Oster G. Lifetime health and economic consequences of obesity.
Brown JB, Nichols GA, Glauber HS, Bakst AW. Type 2 diabetes: incremental medical care costs during the first 8 years after diagnosis.
Nichols GA, Glauber HS, Brown JB. Type 2 diabetes: incremental medical care costs during the 8 years preceding diagnosis.
Ramsey SD, Neil N, Sullivan SD, Perfetto E. An economic evaluation of the JNC hypertension guidelines using data from a randomized controlled trial. Joint National Committee.
Buckley LM, Hillner BE. A cost effectiveness analysis of calcium and vitamin D supplementation, etidronate and alendronate in the prevention of vertebral fractures in women treated with glucocorticoids.
Million R, Kellgren JH, Poole P, Jayson MI. Long-term study of management of rheumatoid arthritis.
del Rincon ID, Williams K, Stern MP, Freeman GL, Escalante A. High incidence of cardiovascular events in a rheumatoid arthritis cohort not explained by traditional cardiac risk factors.
Hickling P, Jacoby RK, Kirwan JR. Joint destruction after glucocorticoids are withdrawn in early rheumatoid arthritis. Arthritis and Rheumatism Council Low Dose Glucocorticoid Study Group.
Piper JM, Ray WA, Daugherty JR, Griffin MR. Corticosteroid use and peptic ulcer disease: role of nonsteroidal anti-inflammatory drugs.
Chamberlain MA, Keenan J. The effect of low doses of prednisolone compared with placebo on function and on the hypothalamic pituitary adrenal axis in patients with rheumatoid arthritis.
Michel BA, Bloch DA, Fries JF. Predictors of fractures in early rheumatoid arthritis.
van Staa T, Leufkens H, Abenhaim L, Zhang B, Cooper C. Oral corticosteroids and fracture risk: relationship to daily and cumulative doses.
Harris ED Jr, Emkey RD, Nichols JE, Newberg A. Low dose prednisone therapy in rheumatoid arthritis: a double blind study.
Berntsen C, Freyberg R. Rheumatoid patients after five or more years of corticosteroid treatment: a comparative analysis of 183 cases.
Black RL, Oglesby RB, Von Sallmann L, Bunim JJ. Posterior subcapsular cataracts induced by corticosteroids in patients with rheumatoid arthritis.
Williamson J, Paterson R, McGavin D. Posterior subcapsular cataracts and glaucoma associated with long-term oral corticosteroid therapy. In patients with rheumatoid arthritis and related conditions.
Kirwan JR. The effect of glucocorticoids on joint destruction in rheumatoid arthritis. The Arthritis and Rheumatism Council Low-Dose Glucocorticoid Study Group.
Lindsay R, Silverman SL, Cooper C et al. Risk of new vertebral fracture in the year following a fracture.
Ellwein LB, Urato CJ. Use of eye care and associated charges among the Medicare population: 1991–1998.
Congdon N, Vingerling JR, Klein BE et al. Prevalence of cataract and pseudophakia/aphakia among adults in the United States.
Author notes
Center for Outcomes and Effectiveness Research and Education (COERE), 1School of Nursing and 2Center for Education and Research on Therapeutics (CERTs) of Musculoskeletal Disorders, School of Medicine, University of Alabama at Birmingham, USA.

Comments