


Abstract
Background. Osteopontin (OPN) is an extracellular matrix cell adhesion phosphoprotein with immunological activities including stimulation of macrophage chemotaxis, T-helper type 1 lymphocyte response and B-cell antibody synthesis. Overexpression of OPN has been associated with the development of the autoimmune/lymphoproliferative syndrome.
Methods. We measured the plasma concentration and ex vivo production of OPN, and the plasma proinflammatory IL-18 concentration in 54 SLE patients with or without renal impairment (RSLE group and SLE group, respectively) and 26 sex- and age-matched control (NC) subjects using an enzyme-linked immunoabsorbent assay.
Results. Plasma OPN concentrations were significantly higher in RSLE and SLE patients than in the NC group (both P<0.001). Increase in OPN concentration correlated positively and significantly with SLEDAI score in all SLE patients (r = 0.308, P = 0.023). The ex vivo production of OPN upon mitogen activation of peripheral blood mononuclear cells was significantly higher in the RSLE and SLE groups than in the NC group (both P<0.001). In RSLE patients, plasma OPN concentration showed a significant positive correlation with proinflammatory cytokine IL-18 concentration (r = 0.404, P = 0.037).
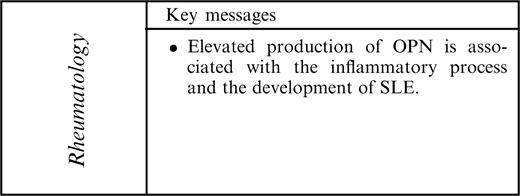
Conclusion. The above results suggest that the production of OPN is associated with the inflammatory process and SLE development, and may serve as a potential disease marker of SLE.
Systemic lupus erythematosus (SLE) is a prototypic systemic autoimmune disease characterized by various immunological abnormalities, including dysregulated activation of both T and B lymphocytes with the production of a large quantity of autoreactive antibodies [1, 2]. The aetiology and pathogenic mechanism of this immunological disorder have not been clearly elucidated. Aberrant production and imbalance of T-helper (Th) cell cytokines have been implicated in the pathogenesis of autoimmunity [3]. Our previous findings demonstrated that the plasma concentration of proinflammatory cytokine interleukin (IL)-18 was significantly elevated in SLE patients compared with controls [4]. Studies of Tokano et al. [5] and our studies [6] showed that plasma IL-12 concentrations in SLE patients were significantly higher than those of normal subjects. The combination of IL-12 and IL-18 is very critical for the induction of the innate immune response and inflammatory reaction in SLE [7]. We have previously found a positive correlation between the plasma IL-18/IL-4 ratio and SLE disease activity index (SLEDAI), suggesting an imbalanced cytokine profile with Th1 predominance [6]. Akahoshi et al. also reported that the ratio of intracellular interferon (IFN)-γ/IL-4 staining of Th cells did not support a predominance of Th2 in SLE [8]. In contrast, they found that there was a significant Th1 predominance among SLE patients with WHO class IV lupus nephritis and diffuse proliferative glomerulonephritis [8].
Osteopontin (OPN, early T-lymphocyte activation protein 1, Eta-1) is a secreted phosphorylated glycoprotein expressed in mineralized tissues (bone and teeth) and damaged renal tissues [9]. During inflammation, OPN is expressed by cells of both innate and adaptive immunity, such as natural killer (NK) cells, activated T cells, macrophages and resident fibroblasts [10, 11]. OPN is also called early T-lymphocyte activation protein 1 (Eta-1) because of its early production upon cell activation, and has been shown to enhance Th1 but inhibit Th2 response [12]. The in vitro production of OPN is modulated by IL-2, transforming growth factor-β, epidermal growth factor and platelet-derived growth factor [10]. Among multiple receptors for OPN, CD44 is the most characterized receptor that appears to mediate the cell chemotaxis and attachment [13, 14]. OPN plays various biological roles for host defence, bone formation, osteoclast activation and wound healing [12, 15]. Its cytokine activities include the stimulation of macrophage and T-cell migration [12, 16], protection against herpes viruses and bacterial infections through the activation of the Th1 response [12], and induction of Th1-cell-mediated autoimmunity [9].
Increased plasma concentration, protein expression and local production of OPN have been observed in sepsis [17], metastasis [18], multiple sclerosis [9, 19], autoimmune/lymphoproliferative syndrome [20], renal tissue of SLE patients [21] and rheumatoid joints of patients with rheumatoid arthritis [22]. However, the circulating level and ex vivo production of OPN in SLE patients and its correlation with disease severity has not been well defined. Therefore, the aim of our present study was to analyse the possible correlation between the plasma concentration of OPN and disease activity, and the ex vivo production of OPN upon mitogen activation in SLE patients with or without renal disease. Since we have previously observed that elevation in the plasma concentration of the proinflammatory cytokine IL-18 was correlated with SLEDAI in SLE patients, especially those with renal disease [4, 23], we also investigated the correlation between plasma IL-18 and OPN concentrations to further confirm the association of OPN with disease activity.
Patients and methods
SLE patients, control subjects and blood samples
Fifty-four Chinese SLE patients were recruited at the rheumatology out-patient clinic of the Prince of Wales Hospital, Hong Kong. Diagnosis of SLE was established according to the 1982 revised American Rheumatism Association criteria [24] and disease activity was evaluated with the SLEDAI [25]. The SLE patients were divided into two groups: 27 SLE patients with (or having a history of) renal disease (RSLE group) and 27 SLE patients without renal disease (SLE group). Forty sex- and age-matched healthy Chinese volunteers were recruited as controls (NC group). Twenty millilitres of EDTA venous peripheral blood were collected from each patient and control subject. The above protocol was approved by the Clinical Research Ethics Committee of The Chinese University of Hong Kong-New Territories East Cluster Hospitals, and informed consent was obtained from all participants according to the Declaration of Helsinki.
Assay of OPN and IL-18
Concentrations of OPN and IL-18 in plasma and ex vivo culture supernatant were measured by enzyme-linked immunosorbent assay (ELISA) using reagent kits from Assay Designs (MI, USA) and BioSource (CA, USA) respectively.
Whole blood assay
The method of Viallard et al. was adopted [3]. After a maximum storage period of 1 h of collected EDTA blood at room temperature, blood samples were diluted 1:1 with RPMI 1640 (Gibco Laboratories, NY, USA), and 1 ml aliquots were dispensed in each well of a 24-well plate (Nalge Nunc International, IL, USA). The blood culture was then incubated with or without phytohaemagglutinin (PHA, a T-cell mitogen; Sigma, MO, USA) at 5 μg/ml and lipopolysaccharide (LPS, a mitogen of B cells and macrophages; Sigma) at 25 μg/ml for 24 h at 37°C in a 5% CO2 atmosphere. After incubation, the cell-free supernatant of ex vivo culture was harvested and stored at −70°C for subsequent ELISA. The absolute number (cells/μl) of leucocytes (CD45+) of each whole blood samples was measured using the MultiTEST IMK kit with TruCOUNT tubes (Becton Dickinson, CA, USA) by the lyse/no-wash method with a multicolour FACSCalibur flow cytometer (Becton Dickinson) [26]. To normalize the individual difference in leucocyte number of each whole blood sample, the amount of ex vivo production for OPN was expressed as pg/106 leucocytes.
Statistical analysis
Since concentrations of OPN and IL-18 were not in a Gaussian distribution, the Mann–Whitney rank sum test was used for assessing the differences in OPN concentrations, and Spearman's rank correlation test was used to ascertain the correlations between plasma OPN, IL-18 and SLEDAI. The results were expressed as median (interquartile range). All analyses were performed using the Statistical Package for the Social Sciences (SPSS) statistical software for Windows, version 9.0 (SPSS, IL, USA). P<0.05 was considered to indicate a significant difference.
Results
SLE patients and control subjects
The age, sex, SLEDAI score, duration of diagnosis and drug treatment of the study groups are summarized in Table 1. The disease activity of SLE patients was evaluated by their clinical parameters; the proportions of the SLE group and RSLE group with active disease were 44.4 and 85.2%, respectively.
Characteristics of RSLE and SLE patients and control (NC) subjects
| RSLE | SLE | NC | |
|---|---|---|---|
| Number | 27 | 27 | 40 |
| Sex (female/male) | 26/1 | 26/1 | 39/1 |
| Age (yr): mean ± s.d. (range) | 36 ± 9 (22–55) | 38 ± 9 (19–51) | 40 ± 9 (19–55) |
| Duration of diagnosis (yr): mean ± s.d. (range) | 11.9 ± 7.3 (0.3–29.2) | 11.8 ± 5.7 (1.3–19.6) | NA |
| SLEDAI score: mean ± s.d. (range) | 8 ± 4 (2–18) | 3 ± 2 (0–6) | NA |
| Plasma creatinine (μmol/l): mean ± s.d. (range) | 110.2 ± 87.6 (57.0–472.0) | 76.0 ± 10.4 (57.0–101.0) | NA |
| Plasma urea (mmol/l): mean ± s.d. (range) | 8.4 ± 7.0 (2.8–36.5) | 5.1 ± 1.2 (2.6–7.5) | NA |
| Treatment with prednisolone | |||
| Patients: no. (%) | 24 (88.9) | 17 (63.0) | |
| Daily dose (mg) | 5.4 ± 3.7 | 3.8 ± 5.2 | NA |
| Treatment with hydroxychloroquine | |||
| Patients: no. (%) | 11 (40.7) | 16 (59.3) | |
| Daily dose (mg) | 88.9 ± 118.8 | 123.1 ± 110.7 | NA |
| Treatment with azathioprine | |||
| Patients: no. (%) | 14 (51.9) | 3 (11.1) | |
| Daily dose (mg) | 33.3 ± 35.4 | 11.5 ± 34.8 | NA |
Values are mean ± s.d. (range).
NA, not applicable.
Plasma concentrations of OPN and IL-18
As shown in Fig. 1, plasma OPN and IL-18 concentrations were significantly higher in SLE and RSLE patients than in control subjects [median (interquartile range): OPN in SLE patients 434 (337–614), RSLE patient 655 (503–909), control subjects 363 (309–413) pg/ml; IL-18 of SLE patients 242 (174–334), RSLE patients 263 (184–362), control subjects 158 (137–219) pg/ml, all P<0.001]. Table 2 shows that there was a significant positive correlation between OPN concentration and SLEDAI score in all SLE patients with and without renal disease (r = 0.308, P = 0.023). Plasma IL-18 concentration was also found to correlate positively with SLEDAI in both groups of SLE patients (P<0.05). In addition, IL-18 showed a significant and positive correlation with OPN in RSLE patients (r = 0.404, P = 0.037, Table 3).
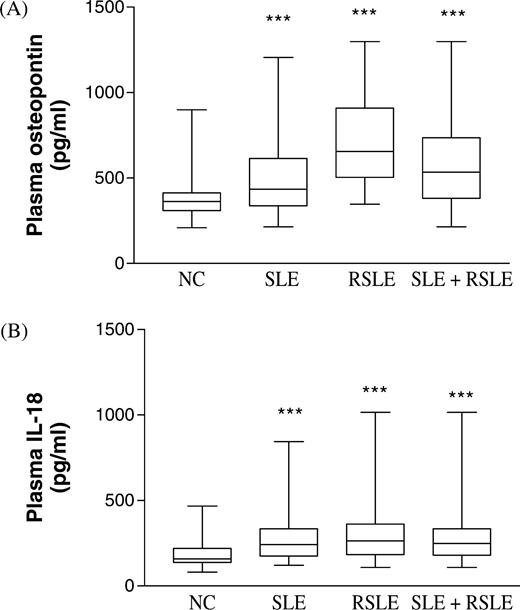
Plasma OPN and IL-18 concentrations of SLE and RSLE patients and control subjects. The Mann–Whitney rank sum test was used to assess the differences of concentration of (A) OPN and (B) IL-18 between the SLE, RSLE, SLE + RSLE and NC groups. Results are presented as box and whisker plots. ***P<0.001.
Correlations of plasma OPN and IL-18 concentrations with SLEDAI in SLE and RSLE patients
| Spearman r | P | |
|---|---|---|
| OPN | ||
| SLE | 0.040 | 0.842 |
| RSLE | 0.180 | 0.368 |
| SLE + RSLE | 0.308 | 0.023* |
| IL-18 | ||
| SLE | 0.377 | 0.017* |
| RSLE | 0.326 | 0.040* |
| SLE + RSLE | 0.258 | 0.021* |
| Spearman r | P | |
|---|---|---|
| OPN | ||
| SLE | 0.040 | 0.842 |
| RSLE | 0.180 | 0.368 |
| SLE + RSLE | 0.308 | 0.023* |
| IL-18 | ||
| SLE | 0.377 | 0.017* |
| RSLE | 0.326 | 0.040* |
| SLE + RSLE | 0.258 | 0.021* |
*P<0.05.
Ex vivo production of OPN
Figure 2 shows that PHA and LPS could significantly increase the release of OPN from peripheral blood mononuclear cells (PBMC) compared with medium control in NC [median (interquartile range), 46.3 (35.9–59.4) vs 39.9 (27.9–48.8) pg/106 leucocytes], the SLE group [99.1 (71.7–150) vs 85.6 (64.5–138) pg/106 leucocytes] and RSLE patients [166 (117–242) vs 133 (79.6–178) pg/106 leucocytes] (all P<0.001). Moreover, the production of OPN upon mitogen activation was found to be in the order RSLE>SLE>NC group (all P<0.005).
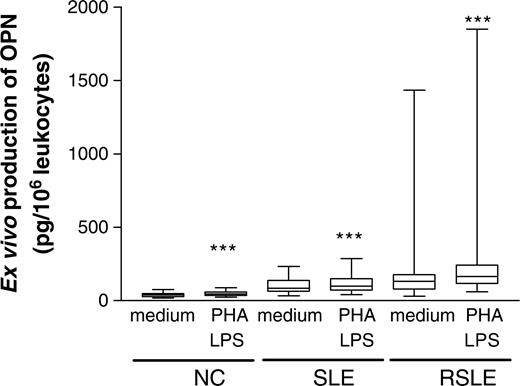
Ex vivo production of OPN upon mitogen activation of PBMC of SLE and RSLE patients and normal controls. The culture supernatant for OPN measurement by ELISA was derived from whole blood cultured with medium in the absence or presence of PHA (5 μg/ml) and LPS (25 μg/ml) for 24 h. Results are presented as box and whisker plots. The Mann–Whitney rank sum test was used to assess differences in concentrations between the RSLE, SLE and NC groups. ***P<0.001.
Discussion
SLE has been postulated to be an autoantibody-, immune complex- and Th2 cytokine-mediated disease [27]. However, previous studies have reported different results for the correlation of the Th1/Th2 ratio with SLE disease activity. One study showed a positive and significant correlation of the ratio with SLEDAI using in vitro-stimulated PBMC [3], while another reported a negative correlation of the ratio between IFN-γ/IL-10-secreting cells and disease activity by enzyme-linked immunospot analysis of freshly isolated PBMC [28]. Animal experiments using autoimmune mice found that the ratio of Th1/Th2 cytokine mRNA expression of IL-2 and IL-4, IFN-γ and IL-10 in polymorphonuclear neutrophils and PBMC exhibited a reciprocal relationship with disease severity [29]. However, several clinical studies have indicated that elevation in Th1 cytokines, including IL-12 [5], TNF-α [30] and IFN-γ [31], can mediate the inflammatory processes that lead to irreversible organ damage, such as renal failure in SLE [32]. The proinflammatory cytokine TNF-α was found to remain elevated throughout the course of disease [33], suggesting it has a significant role in the inflammatory process [32]. Our previous studies have also demonstrated that elevated production of inflammatory mediators such as IL-18, nitric oxide, soluble thrombomodulin and soluble vascular cell adhesion molecule-1 is associated with renal disease in SLE patients, and the elevation of IL-18 was correlated with disease activity in SLE patients with renal impairment [23, 34]. Altogether, these results suggest that Th1 predominance is important in SLE disease development. OPN is a cytokine that has been newly implicated in autoimmunity and other inflammatory processes [17–22]. To further elucidate the mechanism of Th1-mediated inflammation in SLE, we investigated the circulating level and ex vivo production of OPN and their correlation with plasma IL-18 concentration and SLE disease activity.
The results of our present study indicate that the plasma concentration of cytokine OPN was significantly increased in SLE patients compared with controls, and the elevation correlated positively with SLEDAI (Fig. 1 and Table 2). In addition, the plasma OPN concentration showed a significant positive correlation with proinflammatory cytokine IL-18 concentration in RSLE patients (Table 3). The plasma OPN and IL-18 concentrations in both RSLE and SLE patients did not show any correlation with the dosages of prednisolone, hydroxychloroquine and azathioprine. In conjunction with the inflammatory activities of IL-18, such as the induction of Th1 cytokine IFN-γ and activation of T cells, natural killer cells (NK) and cytotoxic T lymphocytes [35], OPN can enhance the Th1-mediated inflammatory process, activation of NK and T cells, and macrophage migration in the exacerbation of SLE. Acting together with other proinflammatory cytokines, including IL-1 and TNF-α, OPN may be an important cytokine for initiating and perpetuating the Th1 immune response and renal derangement in SLE. In fact, OPN has been shown, at least partly, to account for SLE nephritis, probably through the predominance of the Thl-type response in both peripheral and renal tissues [21].
We also observed that the ex vivo production of OPN upon mitogen activation of PBMC was higher in the RSLE group than the SLE and NC groups (Fig 2). Since OPN can be produced by activated T cells and macrophages, our results do suggest that T cells and macrophages in patients with severe disease activity are more sensitive to activation by T-cell and macrophage mitogen. Apart from Th1-cell activation, OPN can also activate macrophage adhesion [36], migration [36, 37] and cytokine release [12]. Our present findings therefore support the attribution of increased ex vivo production of OPN to the activation of macrophages and T cells in the inflammatory process during SLE exacerbation.
In conclusion, this study has provided new evidence for the association of the production of OPN with SLE disease development and renal derangement. In view of the above results, OPN may also act as a potential disease marker for the monitoring of SLE disease severity and therapeutic efficacy.
The authors have declared no conflicts of interest.
References
Viallard JF, Pellegrin JL, Ranchin V et al. Th1 (IL-2, interferon-gamma (IFN-gamma)) and Th2 (IL-10, IL-4) cytokine production by peripheral blood mononuclear cells (PBMC) from patients with systemic lupus erythematosus (SLE).
Wong CK, Li EK, Ho CY, Lam CW. Elevation of plasma interleukin-18 concentration is correlated with disease activity in systemic lupus erythematosus.
Tokano Y, Morimoto S, Kaneko H et al. Levels of IL-12 in the sera of patients with systemic lupus erythematosus (SLE)–relation to Th1- and Th2-derived cytokines.
Wong CK, Ho CY, Li EK, Lam CW. Elevation of proinflammatory cytokine (IL-18, IL-17, IL-12) and Th2 cytokine (IL-4) concentrations in patients with systemic lupus erythematosus.
Dinarello CA. Role of pro- and anti-inflammatory cytokines during inflammation: experimental and clinical findings.
Akahoshi M, Nakashima H, Tanaka Y et al. Th1/Th2 balance of peripheral T helper cells in systemic lupus erythematosus.
Chabas D, Baranzini SE, Mitchell D et al. The influence of the proinflammatory cytokine, osteopontin, on autoimmune demyelinating disease.
Pollack SB, Linnemeyer PA, Gill S. Induction of osteopontin mRNA expression during activation of murine NK cells.
Giachelli CM, Steitz S. Osteopontin: a versatile regulator of inflammation and biomineralization.
Ashkar S, Weber GF, Panoutsakopoulou V et al. Eta-1 (osteopontin): an early component of type-1 (cell-mediated) immunity.
Weber GF, Ashkar S, Glimcher MJ, Cantor H. Receptor-ligand interaction between CD44 and osteopontin (Eta-1).
Weber GF, Ashkar S, Cantor H. Interaction between CD44 and osteopontin as a potential basis for metastasis formation.
Liaw L, Birk DE, Ballas CB, Whitsitt JS, Davidson JM, Hogan BL. Altered wound healing in mice lacking a functional osteopontin gene (spp1).
O'Regan AW, Chupp GL, Lowry JA, Goetschkes M, Mulligan N, Berman JS. Osteopontin is associated with T cells in sarcoid granulomas and has T cell adhesive and cytokine-like properties in vitro.
Bautista DS, Xuan JW, Hota C, Chambers AF, Harris JF. Inhibition of Arg-Gly-Asp (RGD)-mediated cell adhesion to osteopontin by a monoclonal antibody against osteopontin.
Qin LX, Tang ZY. Recent progress in predictive biomarkers for metastatic recurrence of human hepatocellular carcinoma: a review of the literature.
Vogt MH, Lopatinskaya L, Smits M, Polman CH, Nagelkerken L. Elevated osteopontin levels in active relapsing-remitting multiple sclerosis.
Chiocchetti A, Indelicato M, Bensi T et al. High levels of osteopontin associated with polymorphisms in its gene are a risk factor for development of autoimmunity/lymphoproliferation.
Masutani K, Akahoshi M, Tsuruya K et al. Predominance of Th1 immune response in diffuse proliferative lupus nephritis.
Ohshima S, Yamaguchi N, Nishioka K et al. Enhanced local production of osteopontin in rheumatoid joints.
Wong CK, Ho CY, Li EK, Tam LS, Lam CW. Elevated production of interleukin-18 is associated with renal disease in patients with systemic lupus erythematosus.
Tan EM, Cohen AS, Fries JF et al. The 1982 revised criteria for the classification of systemic lupus erythematosus.
Bombardier C, Gladman DD, Urowitz MB, Caron D, Chang CH, Committee on Prognosis Studies in SLE. Derivation of the SLEDAI: a disease activity index for lupus patients.
Wong CK, Tse PS, Wong EL, Leung PC, Fung KP, Lam CW. Immunomodulatory effects of Yun Zhi and Danshen capsules in health subjects–a randomized, double-blind, placebo-controlled, crossover study.
Mohan C, Adams S, Stanik V, Datta SK. Nucleosome: a major immunogen for pathogenic autoantibody-inducing T cells of lupus.
Hagiwara E, Gourley MF, Lee S, Klinman DK. Disease severity in patients with systemic lupus erythematosus correlates with an increased ratio of interleukin-10: interferon-gamma-secreting cells in the peripheral blood.
Yu C, Sun K, Tsai C et al. Expression of Th1/Th2 cytokine mRNA in peritoneal exudative polymorphonuclear neutrophils and their effects on mononuclear cell Th1/Th2 cytokine production in MRL-lpr/lpr mice.
Davas EM, Tsirogianni A, Kappou I, Karamitsos D, Economidou I, Dantis PC. Serum IL-6, TNFalpha, p55 srTNFalpha, p75srTNFalpha, srIL-2alpha levels and disease activity in systemic lupus erythematosus.
Al-Janadi M, al-Balla S, al-Dalaan A, Raziuddin S. Cytokine profile in systemic lupus erythematosus, rheumatoid arthritis, and other rheumatic diseases.
Aringer M, Smolen JS. Tumour necrosis factor and other proinflammatory cytokines in systemic lupus erythematosus: a rationale for therapeutic intervention.
Segal R, Bermas BL, Dayan M, Kalush F, Shearer GM, Mozes E. Kinetics of cytokine production in experimental systemic lupus erythematosus: involvement of T helper cell 1/T helper cell 2-type cytokines in disease.
Ho CY, Wong CK, Li EK, Tam LS, Lam CW. Elevated plasma concentrations of nitric oxide, soluble thrombomodulin and soluble vascular cell adhesion molecule-1 in patients with systemic lupus erythematosus.
Dinarello CA. IL-18: A TH1-inducing, proinflammatory cytokine and new member of the IL-1 family.
Giachelli CM, Lombardi D, Johnson RJ, Murry CE, Almeida M. Evidence for a role of osteopontin in macrophage infiltration in response to pathological stimuli in vivo.
Author notes
1Department of Chemical Pathology and 2Department of Medicine and Therapeutics, The Chinese University of Hong Kong, Prince of Wales Hospital, Shatin, Hong Kong.

Comments