
Abstract
Objective. To examine whether a change in the presentation of incident gout happened over the last 20 years and to determine the risk of subsequent gout flares after an initial gout attack.
Methods. All incident cases of gout were identified among residents of Olmsted County, Minnesota, diagnosed in 1989–1992 and 2009–2010 according to the earliest date fulfilling the 1977 American Rheumatism Association preliminary criteria, or the New York or Rome criteria for gout. Patients in both cohorts were then followed for up to 5 years. Cumulative incidence and person-year methods were used to compare flare rates, and conditional frailty models were used to examine predictors.
Results. A total of 429 patients with incident gout (158 patients in 1989–1992 and 271 patients in 2009–2010) were identified and followed for a mean of 4.2 years. The majority of patients were male (73%) and the mean age (SD) at gout onset was 59.7 (17.3) years. Classic podagra decreased significantly from 74% to 59% (p < 0.001). Cumulative incidence of first flare was similar in both cohorts (62% vs 60% by 5 yrs in 1989–1992 and 2009–2010, respectively; p = 0.70), but overall flare rate was marginally higher in 2009–2010 compared to 1989–1992 (rate ratio: 1.24). Hyperuricemia (HR 1.59) and kidney disease (HR 1.34) were significant predictors of future flares.
Conclusion. Gout flares were common in both time periods. Hyperuricemia and kidney disease were predictors of future flares in patients with gout. Podagra as a presentation of gout has become relatively less frequent in recent years.
- GOUT
- FLARES
- EPIDEMIOLOGY
Gout has surpassed rheumatoid arthritis as the most common form of inflammatory arthritis in the United States1. The rising incidence and prevalence of gout have been demonstrated in several studies and among different populations2,3,4,5,6,7. In addition, we and others have shown that the burden of comorbidities in patients diagnosed with gout has changed2,3,4,5,6,7. Over the last 20 years, patients with gout have developed a higher likelihood of also being affected by obesity, hypertension, diabetes, hyperlipidemia, and renal disease2,3,4,5,6,7. It is unclear whether these changes in the occurrence of comorbidities at the time of gout diagnosis have been associated with a change in the clinical presentation of gout itself.
With this study, we examined possible changes in the clinical presentation of incident gout attacks over the last 20 years. Further, we determined the likelihood of subsequent flares after a first attack of gout and investigated predictors of subsequent flares.
MATERIALS AND METHODS
Gout cohort assembly
The Rochester Epidemiology Project (REP) is a medical record linkage system that gathers medical records from all healthcare providers in Olmsted County, Minnesota8. The REP provides ready access to medical records from the Mayo Clinic, the Olmsted Medical Center and its affiliated hospitals, local nursing homes, as well as a few private practitioners. Inpatient and outpatient records are included in the REP, allowing a nearly complete collection of all the records for the population and making the population of Olmsted County well suited for population-based studies.
Using the resources of the REP, residents of Olmsted County, Minnesota, age ≥ 18 years, were screened for a potential diagnosis of gout using diagnostic codes (International Classification of Diseases, 9th revision: code 274.x)2. Two time intervals were chosen separated by 20 years (January 1, 1989–December 31, 1992, and January 1, 2009–December 31, 2010). During these periods, cases were included as incident gout cases at the earliest date they fulfilled any of the 3 sets of gout criteria (1977 American Rheumatism Association preliminary criteria for gout9, Rome criteria10, or the New York criteria11). The medical records for each potential patient (outpatient and inpatient) were reviewed for ascertainment of gout diagnosis. Demographic, laboratory, and clinical data were abstracted by medical record review as previously described2. The study was approved by the institutional review board at both the Mayo Clinic (ID: 12-007239) and the Olmsted Medical Center (ID: 018-OMC-15). Informed consent was waived for minimal risk features of the study.
Flare definition
Identified patients with an incident diagnosis of gout were followed up for 5 years, death, or migration out of Olmsted County, whichever came first. Medical records were reviewed for the occurrence of subsequent flares, which were defined as follows: any provider contact (including phone calls mentioning gout flare or asking for prescription medication) for acute musculoskeletal pain AND provider diagnosis of an acute gout attack as the source for the patient’s pain. A period of 30 days was required between each gout flare and the next possible flare.
Statistical methods
Descriptive statistics (means, percentages, etc.) were used to summarize data. Patient characteristics were compared between cohorts using chi-square and rank-sum tests. The rate of subsequent gout flares was calculated as the total number of flares divided by the total person-years (PY) of observation in each cohort. Assuming the rates followed a Poisson distribution, 95% CI for the rates were obtained. Conditional frailty models with random subject effects (accounting for multiple flares per subject) were used to investigate risk factors for subsequent gout flares12. Each HR was obtained from a univariable model. Smoothing splines were used to examine the possibility of nonlinear trends in continuous risk factors [e.g., body mass index (BMI) and serum uric acid]. Cumulative incidence methods adjusting for the competing risk of death were used to estimate the time to first subsequent flare after incidence of gout. Analyses were performed using SAS version 9.4 (SAS Institute) and R 3.1.1 (R Foundation for Statistical Computing).
RESULTS
We identified a total of 429 patients with incident gout, 271 patients in the 2009–2010 time period, and 158 patients in the 1989–1992 time period. The majority of the patients were males and of white ancestry (Table 1). BMI increased significantly in the 2009–2010 cohort compared to the 1989–1992 cohort (mean 32 vs 28.6 kg/m2, respectively; p < 0.001). Similarly, associated comorbid conditions such as diabetes mellitus, hypertension, hyperlipidemia, and kidney disease were significantly increased in the later cohort. Isolated podagra [first metatarsophalangeal (MTP) arthritis] as the initial presentation of gout has become significantly less common among more recent patients (74% vs 59%; p = 0.001). Similarly, the presence of any podagra (isolated or with other joint involvement) has decreased from 80% in the 1989–1992 cohort to 67% in the 2009–2010 cohort (p = 0.004). Involvement of small finger and foot joints other than the first MTP during the initial attack has become more common in the more recent cohort.
Characteristics of patients among Olmsted County, Minnesota, residents with incident gout in 1989–1992 compared with 2009–2010 at the time of incident gout attack.
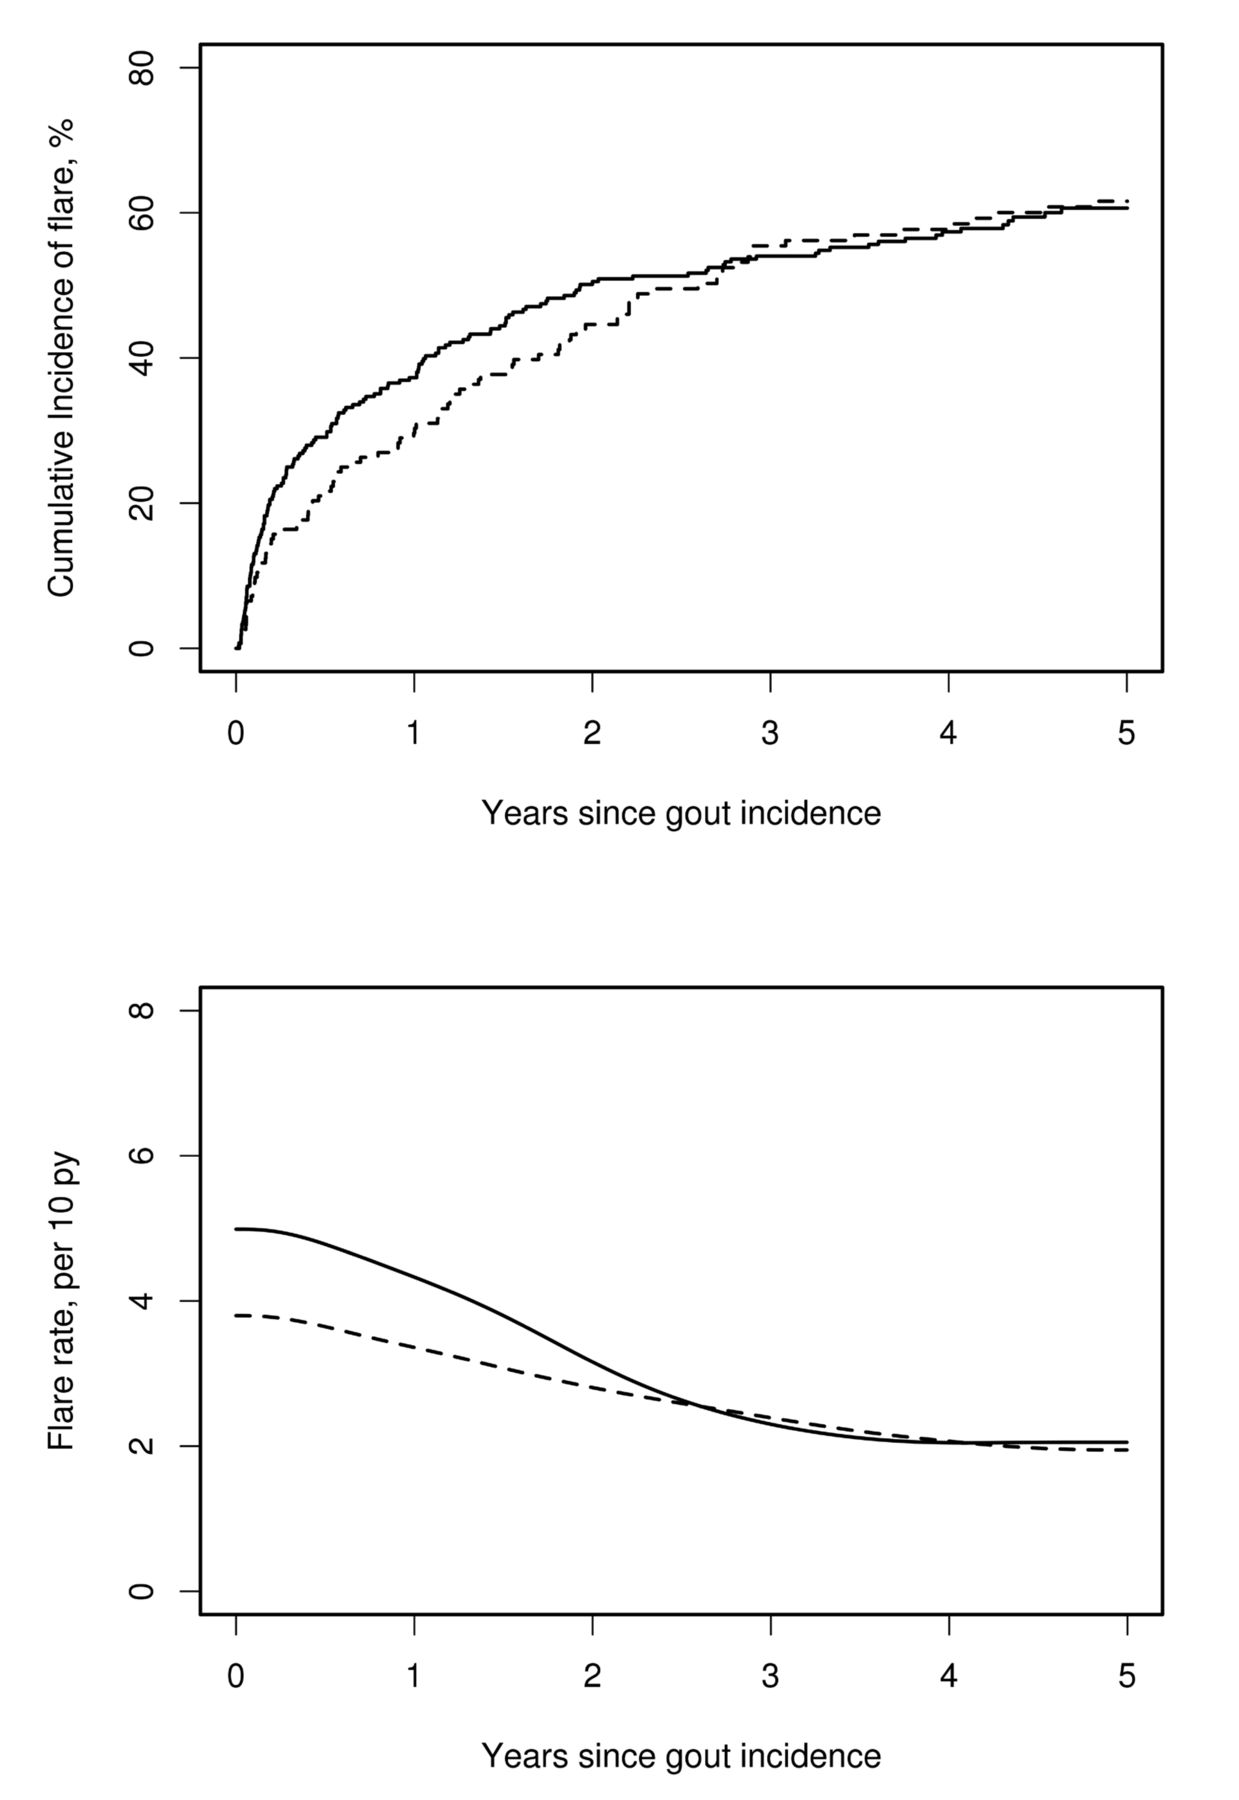
During followup, 158 patients in the 2009–2010 cohort and 90 patients in the 1989–1992 cohort developed gout flares. The cumulative incidence of the first subsequent gout flare was similar in both cohorts (p = 0.70; Figure 1, upper panel). During the first year after gout incidence, 30% (95% CI 22–37%) of patients in the 1989–1992 cohort and 37% (95% CI 31–43%) of patients in the 2009–2010 cohort experienced a gout flare. By 5 years after gout incidence, 62% (95% CI 54–70%) of the 1989–1992 cohort and 60% (95% CI 54–66%) of the 2009–2010 cohort had at least 1 subsequent gout flare.

Cumulative incidence of first subsequent flare after gout incidence date (upper panel) and rates of all subsequent flares (lower panel) among patients diagnosed with gout in Olmsted County, Minnesota in 1989–1992 (dashed line) and 2009–2010 (solid line). PY: person-years.
In the 5-year followup, 185 flares occurred in the 1989–1992 cohort, while 397 flares occurred in the 2009–2010 cohort. Despite the similarity between the cohorts in the overall rates of first subsequent flares, the incidence of all subsequent flares increased from 2.8 per 10 PY (95% CI 2.4–3.3) to 3.5 per 10 PY (95% CI 3.2–3.9), which corresponds to a 24% increase in the incidence of subsequent flares (rate ratio 1.24, 95% CI 1.04–1.47) in patients diagnosed with gout. Most of the excess flares in the 2009–2010 time period occurred during the first 2 years after gout incidence (Figure 1, lower panel). However, when adjusted for multiple flares within the same patient, this association was attenuated (HR 1.14, 95% CI 0.95–1.36; p = 0.15), indicating that a small number of patients with unusually high numbers of flares in the 2009–2010 cohort influenced the unadjusted comparisons between cohorts.
There has been some change in the clinical characteristics of subsequent flares that are similar to the changes observed for the first gout attack. Isolated podagra has decreased from 70% in the earlier cohort to 45% in the 2009–2010 cohort (p < 0.001). Monoarticular presentation has significantly lessened over this time period, from 92% in the 1989–1992 cohort to 75% in the 2009–2010 cohort (p < 0.001), with more patients experiencing oligo/polyarticular presentations in the later time period (Table 2).
Characteristics of first subsequent flare in patients with gout among Olmsted County, Minnesota, residents with incident gout in 1989–1992 compared with 2009–2010.
Several demographic and clinical variables were evaluated as possible predictors of subsequent flares. Serum uric acid levels ≥ 7 mg/dl for males and ≥ 6 mg/dl for females at the time of first flare were found to pose a significant risk for subsequent flares (HR 1.59, 95% CI 1.16–2.18). For every 1 mg/dl increase in serum uric acid level, the risk of subsequent flares increased by 13%. Among comorbidities, only the presence of renal insufficiency was significantly associated with subsequent gout attacks (HR 1.34, 95% CI 1.12–1.61; Table 3). None of the clinical characteristics at the time of incident gout such as specific joint or polyarticular involvement were significantly associated with subsequent flare risk.
Predictors of subsequent flares among Olmsted County, Minnesota, residents with incident gout in 1989–1992 compared with 2009–2010 based on univariable models.
DISCUSSION
There have been several notable changes in the clinical presentation of gout over the recent 2 decades. The “typical” presentation of first MTP arthritis (podagra) has become relatively less frequent, and more atypical presentations with small finger joint involvement are now more common. While these findings require confirmation in other cohorts, they suggest that clinicians now have to maintain a high index of diagnostic suspicion, even in situations in which gout would have been considered an unlikely diagnosis. As well, subsequent flares demonstrate similar changes in clinical presentation and are characterized by a significant increase in polyarticular involvement in the more recent cohort. The reasons for the change in the clinical presentation of incident gout as well as subsequent flares is unclear and requires further study. However, the marked change in associated comorbidities (i.e., obesity, cardiovascular, and renal disease) along with medication use between the 2 time periods could be related to the changes in gout presentation.
The risk of subsequent flares is an important factor in the clinical assessment and management decisions regarding use of uric acid–lowering therapy aiming at reducing future flare risk13,14,15. Data from the current study indicate that roughly 60% of patients will have at least 1 subsequent flare during the 5 years following their initial diagnosis. While several studies have mentioned a wide range of flare rates (21–65%) during their followup periods16,17,18,19,20, these differences could be attributed to the difference in methodology used along with the case definition used for gout flare in each study. More importantly, the correct timing of starting a patient on uric acid–lowering therapy is still a subject of clinical uncertainty. Many clinicians introduce uric acid–lowering therapy after the second or third flare. However, our data indicate that there are certain high-risk features such as high uric acid levels at baseline and presence of chronic kidney disease, which may justify an early, more aggressive uric acid–lowering approach21.
Important strengths of our study include the population-based design, which reduces the risk of referral/selection bias by including virtually all patients in a defined geographic area. Several criteria sets were applied to ascertain incident cases of gout, thereby mitigating the risk of accidentally including patients with other types of inflammatory arthritis. The criteria-based diagnosis of incident gout diagnosis improved the diagnostic accuracy over claims-based or coding-dependent diagnosis22.
Limitations of our study are inherent to its retrospective design. The diagnosis of incident gout as well as the recording of subsequent flares and clinical variables is dependent on a non-standardized clinical documentation. Clinical practices and documentation standards have changed over time and may result in systematic differences in the retrieval of clinical information between the 2 cohorts. We tried to mitigate the risk of incomplete case retrieval by using all 3 proposed criteria sets for gout. More recently, new gout criteria have been published, including new imaging modalities such as musculoskeletal ultrasound and dual-energy computed tomography17. Because these imaging modalities were not used during the 1989–1992 time period, but were available during the 2009–2010 period, we did not retrospectively apply the new American College of Rheumatology/European League Against Rheumatism criteria to the study cohorts. Similar to several other studies16,17,23,24, we used physician determination as the diagnostic criterion for subsequent gout flares. It is possible that subsequent flares were missed if the patient did not seek any provider contact during an acute attack.
Our study suggests that the clinical presentation of gout is changing. This finding adds to the mounting body of evidence that indicates that various aspects of gout, including incidence2,3,6,16, prevalence1,3,7,25, and associated comorbidities2,7,26,27 have transformed over recent decades. We were able to show that the “classic” presentation of gout, inflammatory arthritis of the first MTP joint, has become a relatively less frequent presentation. Conversely, the relative frequency of small finger or foot joint involvement (other than first MTP) has increased and polyarticular flares are now relatively more common.
Our findings quantify the risk of subsequent flares and identify important risk factors such as the extent of hyper-uricemia and the presence of renal dysfunction. These findings indicate that clinicians need to maintain a high level of suspicion for gout as a possible cause of joint pain and inflammation in atypical cases of inflammatory arthritis, and to guide the decision of whether a patient should be given uric acid–lowering therapy for flare prophylaxis.
Footnotes
This work was made possible using the resources of the Rochester Epidemiology Project, which is supported by the US National Institute on Aging of the National Institutes of Health (NIH) under Award Number R01AG034676 and Clinical and Translational Science Awards Grant Number UL1 TR000135 from the National Center for Advancing Translational Sciences, a component of the NIH. The content is solely the responsibility of the authors and does not necessarily represent the official views of the NIH.
- Accepted for publication June 26, 2019.
REFERENCES
- 1.
- 2.
- 3.
- 4.
- 5.
- 6.
- 7.
- 8.
- 9.
- 10.
- 11.
- 12.
- 13.
- 14.
- 15.
- 16.
- 17.
- 18.
- 19.
- 20.
- 21.
- 22.
- 23.
- 24.
- 25.
- 26.
- 27.