
Abstract
Objective. To evaluate and determine the most effective immunosuppressive therapy for the induction treatment of proliferative lupus nephritis (PLN) based on renal remission.
Methods. A systematic review of randomized controlled trials was conducted. The outcomes were renal remission at 6 months: (1) normalization of serum creatinine [(sCr), or within 15% of the normal range, i.e., sCr < 132 µmol/l — creatinine remission]; and (2) proteinuric remission (prU < 0.5 g/day/1.73m2). A Bayesian network metaanalysis was used.
Results. The OR (95% credible interval) of inducing an sCr remission at 6 months was 1.70 (0.51, 6.87) for mycophenolate mofetil (MMF) versus cyclophosphamide (CYC); 2.16 (0.38, 13.36) for tacrolimus (Tac) versus CYC; and 1.25 (0.13, 10.51) for Tac versus MMF. For proteinuric remission the OR was 1.46 (0.81, 3.04) for MMF versus CYC; 1.96 (0.80, 5.11) for Tac versus CYC; and 1.34 (0.43, 3.90) for Tac versus MMF. The probability (95% credible interval) of inducing a creatinine remission at 6 months was Tac 56% (19%, 88%); MMF 51% (23%, 79%); and CYC 37% (28%, 47%). The probability of inducing a proteinuric remission was Tac 41% (23%, 63%); MMF 34% (23%, 50%); CYC 26% (20%, 32%); azathioprine 10% (1%, 55%); prednisone 11% (2%, 38%). None of the results were conclusive when examined in a sensitivity analysis.
Conclusion. There is currently insufficient evidence to determine which of these immunosuppressive agents is superior. The probability of renal remission is 50% or lower at 6 months.
- SYSTEMIC LUPUS ERYTHEMATOSUS
- LUPUS NEPHRITIS
- METAANALYSIS
- IMMUNOSUPPRESSIVE AGENTS
- DRUG THERAPY
- CLINICAL TRIALS
The outcome of systemic lupus erythematosus (SLE) has improved over the past 3 decades, as demonstrated by the current overall 10-year survival of greater than 90%1. Lupus nephritis (LN) is one of the most important manifestations of SLE. Renal involvement occurs in 30%–50% of patients, and its presence is associated with significant morbidity and mortality2. Thirty years ago, the longterm renal survival was reported to be < 50%3; today, with the more aggressive treatment regimens, the 10-year renal survival is increased to 70%–80%1. Almost all renal lesions begin within the first 3–5 years of SLE, and renal function compromise usually begins within the first decade of followup4. Therefore, aggressive management early in the course is considered essential for good longterm outcome of LN.
The mainstay of induction treatment of proliferative LN (PLN) is high-dose glucocorticoids in combination with another immunosuppressive therapy. Although there have been recent consensus guidelines for the treatment of LN2,5,6,7, protocols vary from center to center. Generally, European treatment protocols use high-dose glucocorticoids plus short-term low-dose cyclophosphamide (CYC) or mycophenolate mofetil (MMF)6. North American regimens generally use higher-dose CYC or MMF in addition to high-dose glucocorticoids5. Other medications including azathioprine (AZA) or tacrolimus (Tac) have been reported to have benefits as induction or maintenance therapy in some studies8,9.
Published metaanalyses have generally concluded that the addition of a second immunosuppressive therapy (CYC, AZA, or MMF) to prednisone alone plays a critical role both in preserving renal function and improving overall survival of patients with PLN, although results have not been uniformly consistent as to which agent is superior10.
An important risk factor for endstage renal disease is the failure to induce a renal remission11,12; therefore, the initial 6-month induction treatment phase is considered to be extremely important for the prognosis of this disease. Most therapeutic clinical trials in LN have described a 6-month induction phase followed by a maintenance phase.
The aim of our study was to determine which induction therapy is associated with the highest probability of inducing a renal remission in patients with PLN. A secondary aim was to determine the probability of inducing remission at 6 months.
MATERIALS AND METHODS
To determine the most effective induction therapy, we conducted a systematic review and synthesized the evidence using Bayesian network metaanalysis13. This method allows us not only to synthesize evidence from direct comparisons that have been done in high-quality comparative trials, but also to make indirect contrasts between 2 therapies that have never been directly compared in a trial.
Eligibility criteria
The study population was adult or pediatric patients with newly diagnosed active PLN. PLN was defined by diagnostic biopsy proof of Class III or IV (or III/V, IV/V) using either the World Health Organization Classification Criteria14 or the International Society of Nephrology/Renal Pathology Society 2003 Classification Criteria15 (for studies done after 2003). Newly diagnosed was defined as a diagnosis of PLN made within 6 months of randomization (some studies may have allowed an SLE flare before 6 mos of randomization).
CYC, AZA, MMF, Tac, and/or prednisone was begun at the induction phase as the initial therapy. A comparator was any therapy directly compared with any one of the above interventions. Outcome was the number of patients who achieved a renal remission. We defined renal remission in 2 ways: (1) primary outcome — creatinine remission: normal serum creatinine (sCr), or within 15% of the normal range (sCr < 132 μmol/l); and/or (2) secondary outcome — proteinuric remission: proteinuria within the normal range — 24-h urinary protein excretion < 0.5 g, per 1.73 m2 of the body surface area (prU < 0.5 g/day/1.73m2).
The rationale for dividing the outcome into 2 types of remission was based on the scarcity of studies that had published sufficient data to determine a combined creatinine and proteinuric remission.
The timing was the end of the induction phase, with an objective to examine the outcome at 6 months. The study design was randomized controlled trials (RCT).
Search strategy
A comprehensive literature search identified all relevant trials with the assistance of a research librarian (EMU). An optimized search strategy was used (Appendix 1, available online at jrheum.org) with MEDLINE (from 1946 to Week 1, July 2012) and EMBASE (from 1947 to Week 27, 2012). Search terms were “lupus nephritis,” “clinical trial,” “cyclophosphamide,” “azathioprine,” “mycophenolate mofetil,” “glucocorticoids,” and “tacrolimus.”
Study selection
After abstracts were reviewed for eligibility, full texts were retrieved and reviewed in an independent duplicate process (SYT, EDS). Disagreement was resolved by agreement. Ineligible studies were then excluded.
Critical appraisal
Two reviewers independently assessed risk of bias (ROB) using the Cochrane Collaboration tool16. Studies were each graded independently (SYT, EDS), and studies with a high ROB were excluded after a consensus was reached on each case.
Data extraction
Data were extracted from the included studies independently (SYT, EDS). Some data were extracted from plots, for example, Donadio, et al17. An arbiter (BMF) was used for confirmation, as well as for study selection and exclusion.
Treatment
We evaluated the relative effectiveness of the most commonly used agents: CYC, AZA, MMF, and prednisone alone. We also did analyses with Tac included.
Outcome
The outcome was the proportion of patients achieving renal remission in 6 months. Table 1 shows the number of responses and sample size for 2 outcomes. Table 2 presents study features.
Outcomes of the 12 studies used.
Features of the 12 studies used.
Evidence synthesis
A Bayesian network metaanalysis is especially useful in a rare disease, where indirect comparisons are made feasible13,28. Figure 1 schematically shows the analytical rationale. In our synthesis, CYC was treated as a common comparator since it has been accepted as a standard of care in many centers in most countries.

Network of evidence. A solid line denotes a direct comparison between 2 basic nodes; a dashed line denotes an indirect comparison between 2 functional nodes. The relative effect of 2 therapies as shown by an indirect contrast denoted by a dashed line, for example, Cyclo versus Aza, can be determined using this network through head-on comparisons that have already been done. The number of all possible pairwise comparisons in this case is 6. Numbers on the outer edges denote the study number in Table 2. Aza: azathioprine; Cyclo: cyclophosphamide; MMF: mycophenolate mofetil; Pred: prednisone alone.
Heterogeneity
Between-study heterogeneity was measured using the Q and I2 statistics16. A test for consistency or similarity was conducted before combining evidence29.
Publication bias
Trial registries [clinicaltrials.gov, clinicaltrialsregister.eu (eudract.ema.europa.eu)] and the Cochrane Controlled Trial Register (CCTR) were searched for unpublished and potentially negative trials. We examined for publication bias using a funnel plot. We also used, in sensitivity analysis, a skeptical prior specification (see Appendix 2, available online at jrheum.org) to correct for potential publication bias28.
Statistical analysis
A Bayesian network metaanalysis of 2-arm trials was used. Model specification used the standard BUGS code. A random effects model was used to incorporate between-study heterogeneity16,29,30,31,32.
In interpretation of results, OR was used as the effect measure. Results were interpreted from a Bayesian perspective. The 95% credible interval was calculated. The analysis was conducted using R (ver. 2.15.1), using the package R2WinBUGS with WinBUGS. RevMan was used to generate standard caterpillar plots.
RESULTS
Study selection result
Abstracts of 2965 references were reviewed. Full texts of 181 eligible studies were reviewed. Reasons for excluding 148 studies are presented in the flowchart of Appendix 3 (available online at jrheum.org). Thirty-three studies were considered for ROB assessment. Twenty-one studies with a high ROB were excluded for reasons as outlined in Appendix 4 (available online at jrheum.org). Therefore, 12 (181 – 148 – 21 = 12) studies were included for analysis.
Conventional analysis
A conventional metaanalysis was used to summarize and examine the data.
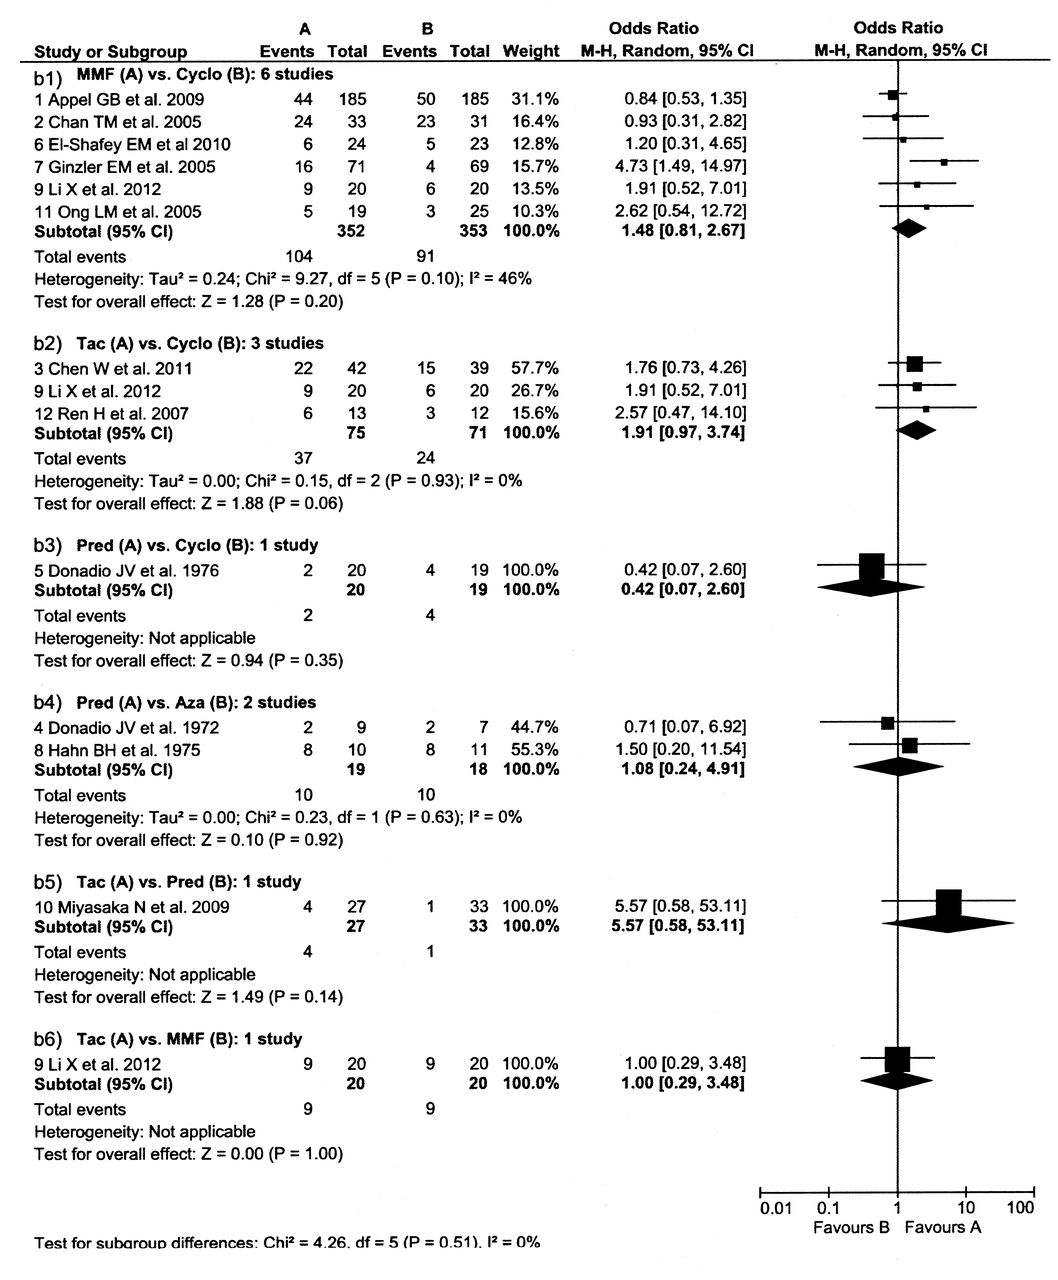
In a comparison of the effect of the 3 treatments on sCr (Figure 2A) with CYC: In this particular sample of studies, MMF was somewhat superior to CYC and Tac was superior to CYC in the individual comparisons of MMF or Tac to CYC (Figure 2A, MMF vs CYC, Tac vs CYC), but the differences were not statistically significant, with all of the CI crossing 1. There was no study meeting the entry criteria that compared AZA to CYC or prednisone alone to CYC.


Caterpillar plots of conventional (frequentist) metaanalysis of the 12 studies included. A. Two comparisons of 5 studies, using serum creatinine < 132 µmol/l as the outcome measure for renal remission.
B. Six comparisons of the 12 studies, using proteinuria < 0.5 g/day as the outcome measure for renal remission. For the M-H method used to combine OR see the Cochrane Handbook16. Aza: azathioprine; Cyclo: cyclophosphamide; MMF: mycophenolate mofetil; Tac: tacrolimus; Pred: prednisone alone; M-H: Mantel-Haenszel test.
There was no study that compared Tac versus MMF, but in the 2 plots where either one appeared somewhat superior to CYC (Figure 2A – MMF vs CYC, Tac vs CYC), the 2 therapies appeared to be equivalent. This result was based on an indirect comparison between Tac versus MMF that was empirically calculated using the 2 OR: 2.01/1.72 = 1.17, with similarity (or combinability) assumed. There were no studies that compared MMF versus AZA or prednisone alone, neither were there studies that compared Tac versus AZA or prednisone alone.
In a comparison of the effect of the 5 treatments on proteinuria (Figure 2B), MMF was somewhat superior to CYC, Tac was superior to CYC, and CYC was superior to prednisone alone in the individual comparisons of MMF, Tac, or prednisone to CYC (Figure 2B, MMF vs CYC, Tac vs CYC, prednisone vs CYC), but the differences were not statistically significant, with all of the CI crossing 1. There was no study meeting the entry criteria that compared AZA to CYC. However, an indirect comparison between the 2 agents was empirically calculated using the 2 OR (AZA vs prednisone contrasted to CYC vs prednisone), which is given by (1/1.08) ÷ (1/0.42) = 0.39.
In the only small study that compared Tac to MMF (20 patients per arm), the therapies appeared to be equivalent (Figure 2B, Tac vs MMF). An indirect comparison between them was empirically calculated using the 2 OR (Tac vs CYC contrasted to MMF vs CYC), which is given by 1.91/1.48 = 1.29, favoring Tac. MMF appears superior to CYC (Figure 2B, MMF vs CYC). There were no studies that compared MMF to AZA or prednisone alone.
There were no significant differences in the 2 small studies that compared prednisone alone to AZA (a total of 18 on AZA and 19 on prednisone, Figure 2B, prednisone vs AZA).
Tac was somewhat superior to prednisone alone in the 1 study comparing these 2 therapies (Figure 2B, Tac vs prednisone). However, the CI crossed 1. The comparison of Tac to MMF and Tac to CYC are described above. There was no study that compared Tac to AZA. An indirect comparison between the 2 agents was empirically calculated using the 2 OR (Tac vs prednisone contrasted to prednisone vs AZA), which is given by 5.57 ÷ (1/1.08) = 6.02, favoring Tac.
For heterogeneity, the chi-square (from the Q statistic) was not significant, as shown in Figure 216: I2 = 62% and 46%, in the order of moderate to substantial between-study heterogeneity, which indicates that the studies are different and should be combined through a random effects approach.
Test results showed no evidence to reject the null hypothesis for testing the consistency or similarity assumption.
In checking for publication bias, using trial registries for unpublished trials and the CCTR for potentially negative trial results, we did not find additional trials that met our eligibility criteria. In our search results, the majority of studies showed a negative (null) result, which may suggest that publication bias did not occur. Funnel plots are presented in Appendix 5 (available online at jrheum.org), which suggests that publication bias is not likely to be a major concern in our synthesis.
Network metaanalysis
Table 3 shows OR and associated credible interval (caterpillar plots shown in Appendix 6, available online at jrheum.org). This analysis allowed for rigorous indirect comparisons of therapies such as CYC versus AZA. However, in many cases, the available evidence was limited and therefore more uncertainty was associated with those comparisons13.
Expected odds ratio (95% credible interval).
For the primary outcome, sCr, the first row of Table 3 shows the OR. This analysis was quite limited because there was original data only for comparisons of MMF versus CYC and Tac versus CYC (Table 1 and Figure 2A). The comparison of Tac versus MMF was made indirectly. In this analysis, Tac was shown most likely to be associated with an sCr remission at 6 months, followed by MMF and then CYC. However, the credible intervals were large and all crossed 1 (Table 3). Tac had the highest probability of ranking first (59%), followed by MMF (39%). MMF had the highest probability of ranking second at 50%, while CYC had the highest probability of having the lowest ranking at 73% (Table 4).
Expected probability of ranks for each therapy (95% credible interval).
The expected probability (95% credible interval) of inducing an sCr remission at 6 months was calculated and given by (1) Tac 56% (19%, 88%); (2) MMF 51% (23%, 79%); and (3) CYC 37% (28%, 47%).
Overall, it appears that MMF and Tac had similar probabilities of success, while CYC was the therapy that had the lowest ranking, but there is significant overlap of the credible interval.
For the secondary outcome, remission of proteinuria, the analysis showed that MMF was the therapy with the highest odds of success, followed by CYC, while AZA and prednisone alone had similar odds (Table 3). The expected ranking of each agent and associated probability are shown in Table 4. MMF had a 72% probability of being the best therapy while the other therapies had low probabilities (AZA 14%, CYC 8%, and prednisone alone 7%). CYC had the highest probability of being the second-best therapy (64%), while AZA had a 29% chance of being the third and 49% of being the fourth-best, and prednisone alone had a 47% chance of being the third and 36% of being the fourth-best.
A second analysis was then performed with Tac included (Table 3 shows OR and credible interval). As shown, the 95% credible interval for prednisone versus Tac does not cover 1, which means that it is > 97.5% probable that Tac is better than prednisone alone.
The expected probability (95% credible interval) of inducing a proteinuric renal remission at 6 months was calculated and given by (1) Tac 41% (23%, 63%); (2) MMF 34% (23%, 50%); (3) CYC 26% (20%, 32%); (4) AZA 10% (1%, 55%); and prednisone alone, 11% (2%, 38%).
There was only fair agreement between using the 2 outcomes, with an intraclass correlation coefficient = 0.54.
DISCUSSION
The current treatment of PLN includes prednisone and an immunosuppressive agent. Trials and previous metaanalyses in PLN have concluded that MMF is equivalent or superior to CYC during the induction phase of therapy2,5, while there have been fewer studies, with fewer patients in the studies, about the use of AZA and Tac. On the basis of the trial evidence, our study confirmed that the addition of a second-line agent is superior to prednisone alone. This study showed that MMF and Tac may be superior to CYC or AZA for the induction treatment of PLN in adults, but the data were not sufficient to be conclusive. Neither were there sufficient trial data to comment on the relative effectiveness of these therapies in pediatric patients with SLE.
We were able to generate a rank order for the effectiveness of immunosuppressive agents in the induction treatment of PLN. Although the evidence is not strong enough to draw any definite conclusions on the order of effectiveness, Tac and MMF appeared to be better than CYC. This was found to be true for both the sCr and proteinuric remissions. Of note, our OR of 0.33 or 0.31 for proteinuric remission associated with AZA versus CYC at 6 months was similar to the OR of 0.27 reported in a 10-month trial by Steinberg and Decker33. The expected probability of inducing an sCr remission at 6 months showed that Tac had the highest probability at 56%, followed by MMF at 51%, and then CYC at 37%. There was not sufficient data to comment on the probability for AZA. The expected probability of inducing a proteinuric remission at 6 months showed that Tac had the highest probability at 41%, followed by MMF at 34%, CYC at 26%, then AZA at 10%, and prednisone alone at 11%. There were too few studies with sufficient data using the combined outcome of both sCr and proteinuria to either allow us to compare therapies or to determine the probability of inducing remission.
Tac may be useful for PLN, but it has been insufficiently examined. Trials studying Tac in SLE have mostly been done in Asia, and therefore it is not clear whether these findings are generalizable to other populations. Moreover, the indirect comparison between trials may have been biased because participants with less severe PLN may have been enrolled in trials studying Tac; for example, 2 trials studying Tac20,27 used an exclusion criterion of sCr > 353.6 or 265.2 µmol/l, but trials not studying Tac (e.g., Appel, et al18) may have included participants receiving dialysis.
Bayesian network analysis can rigorously integrate more information, which is fundamentally different from the conventional analysis. In our study, OR were shown to be similar between using the 2 methods, which may serve as evidence for the consistency of results.
The rationale of metaanalysis is that results pooled from multiple studies, on average, will balance out, and will be closer to the underlying truth. An inference based on heterogeneous evidence may be more generalizable16,29, but the sparseness of evidence may limit the inference. The major limitations to our study included (1) there were few randomized controlled trials in PLN; and (2) except for the MMF versus CYC studies, the number of participants in each trial was small and the studies did not give data for both sCr and proteinuric response. In addition, the large degree of uncertainty that we saw suggests that the synthesized evidence is insufficient, and the fact that our results changed when we used a skeptical prior also suggests a lack of robustness. More studies in the future are therefore needed.
Safety may help determine the use of medications, and MMF and AZA are generally believed to have a better safety profile than CYC34, but we did not analyze safety profile in our study. It is also important to examine the differential manifestations or responses between ethnic groups, to derive specific inference applicable to pertinent populations; however, we were not able to account for the background discrepancies among included trials (e.g., by including them as covariates in a metaregression model) because there were too few trials, and important demographic information was not available in many of the included studies.
Another limitation of our study was that the uncertainty associated with each effect measure was large, indicated by the low precision of results. This was perhaps because only 1 included study compared CYC versus prednisone alone17, and all indirect contrasts were made possible through this comparison (and that study is rather old and showed very wide CI).
Our synthesis showed an OR of 5.69 of proteinuric remission for Tac versus prednisone; however, it may be that Tac and other calcineurin inhibitors have a specific antiproteinuric effect35. We were not able to fully evaluate using the primary outcome, even though, based on fewer studies, Tac was ranked higher than MMF or CYC using the primary outcome.
It has been suggested that induction of remission is crucial to ensure the best longterm outcome of PLN11,18. In our analysis, the probability for remission at 6 months was about 50% and 40% for creatinine and proteinuric remissions, respectively, for the best therapies. These data confirm the suggestion that the 6-month induction period may not be long enough to expect remission using current therapies36,37. In a study done by Lewis, et al38, it took up to 2 years for the patients with LN to attain renal remission (both sCr and proteinuric). In a recent study, the remission was reported to be 53% at 6 months and 83% at 18 months39. It is important to examine these agents’ effectiveness when used for longer than 6 months, but unfortunately, very few trials in our review reported remission data at 1 year or longer. In a future study we will examine their effectiveness when used for a duration beyond 6 months as maintenance treatment.
We have shown that there is currently insufficient evidence to be confident in the determination of which of MMF, AZA, Tac, or CYC has the highest probability of inducing renal remission in patients with PLN. This finding is likely related to the small number of patients studied in most trials, lack of consistent outcome variables among the trials, and the duration of 6 months used for induction trials. More trials are needed, and the induction phase may need to be longer than 6 months to induce remission.
ONLINE SUPPLEMENT
Supplementary data for this article are available online at jrheum.org.
Footnotes
-
Published online before print September 15, 2014, doi: 10.3899/jrheum.140050
- Accepted for publication April 11, 2014.
REFERENCES
- 1.
- 2.
- 3.
- 4.
- 5.
- 6.
- 7.
- 8.
- 9.
- 10.
- 11.
- 12.
- 13.
- 14.
- 15.
- 16.
- 17.
- 18.
- 19.
- 20.
- 21.
- 22.
- 23.
- 24.
- 25.
- 26.
- 27.
- 28.
- 29.
- 30.
- 31.
- 32.
- 33.
- 34.
- 35.
- 36.
- 37.
- 38.
- 39.