
Abstract
Objective. In previous studies cerebral blood flow (CBF) was found to be altered in patients with systemic lupus erythematosus (SLE) compared to controls. We investigated the relationships between CBF and clinical data from subjects with SLE with the aim of determining the pathologic factors underlying altered CBF in SLE.
Methods. A total of 42 SLE subjects and 19 age- and sex-matched healthy control subjects were studied. Dynamic susceptibility contrast (DSC) magnetic resonance imaging (MRI) was used to measure CBF. Patients and controls underwent complete clinical and laboratory evaluations in close proximity with their MRI studies.
Results. A higher CBF was present in the SLE group and was independently associated in statistical models with higher systolic blood pressure (SBP; p < 0.01). The intensity of the relationships (slope of curve) between CBF and mean arterial blood pressure, diastolic blood pressure, or blood levels of tissue plasminogen activator in the SLE group was significantly blunted relative to the control group.
Conclusion. These findings are consistent with an underlying cerebral hyperperfusion in SLE induced by elevated but nonhypertensive levels of SBP. The factors underlying this relationship may be functional and/or structural (atherosclerotic, thrombotic, thromboembolic, or vasculitic) cerebrovascular disease.
- SYSTEMIC LUPUS ERYTHEMATOSUS
- BRAIN
- CEREBRAL BLOOD FLOW
- MAGNETIC RESONANCE IMAGING
Systemic lupus erythematosus (SLE) is an autoimmune inflammatory disease affecting multiple organ systems, including the brain. Although the mechanisms of brain injury of SLE are complex and incompletely understood, numerous studies have reported structural, functional, and biochemical brain abnormalities in patients with SLE that underlie the clinical manifestations of neuropsychiatric SLE (NPSLE)1. Periventricular or deep white matter abnormalities including cerebral infarcts observed by magnetic resonance imaging (MRI) are present in over 50% of SLE cases2 and histopathologic studies have shown evidence of widespread, multifactorial vasculopathy leading to both focal and diffuse brain injury3. Studies have reported abnormalities in cerebral blood flow (CBF) in SLE4,5,6,7,8,9,10. The majority of the studies measured relative CBF with single-photon-emission computed tomography and found that CBF was lower in focal or broad regions of the brain with respect to a region presumed to be normal within the SLE subjects4,5,6,7,8,9,10. However, it has recently been demonstrated using dynamic susceptibility contrast MRI (DSC-MRI) that both CBF and cerebral blood volume (CBV) may be higher in normal-appearing brain tissue in patients with SLE than in healthy controls11. Elevated CBF has also been observed in other neurological disorders, including epilepsy12, stroke13, transient ischemic attack14, fibromyalgia15, metabolic brain disease16, and migraine17. However, the mechanisms underlying higher perfusion in these disorders are likely to be diverse and not necessarily identical to those underlying elevated CBF in SLE.
The purpose of our study was to investigate the relationships among CBF and clinical and laboratory data in SLE subjects and healthy controls to determine the mechanism or factors causing elevated CBF in SLE.
MATERIALS AND METHODS
Subjects
This study was approved by the University of New Mexico Institutional Review Board and conformed with the ethical standards of the Declaration of Helsinki. All subjects signed an informed consent document. The diagnosis of SLE was established in each subject using the American College of Rheumatology criteria18,19. A cohort of 42 SLE subjects (40 women, mean age 37.3 ± 12.8 years) and 19 age- and sex-matched healthy controls (17 women, mean age 31.9 ± 10.1 years) were studied. Twenty-six SLE subjects (62%) were positive for antiphospholipid antibody, 10 (24%) were positive for antiribisomal P antibodies, and 26 (65%) were positive for anti-dsDNA antibodies. Eighteen SLE subjects (43%) were diagnosed with active NPSLE using the neurological SLE Disease Activity Index (Neuro-SLEDAI) criteria20 as follows: seizures (2 patients), psychosis (3 patients), organic brain syndrome (5 patients), visual disturbance (1 patient), cranial neuropathy (2 patients), lupus headache (7 patients), and stroke (4 patients). Patients with past but not active NPSLE were excluded from the study. The 2 groups were similar in all demographic variables (Table 1). More extensive clinical data and findings on this cohort can be found in Table 2 and a previous report11.
Group statistics of selected clinical and laboratory test results.
Selected clinical and laboratory test results obtained for SLE subjects only. Data are mean ± SD.
Clinical and laboratory evaluations
Patients and controls underwent clinical and laboratory evaluations including specific measures of inflammation, coagulation, and fibrinolysis. Group differences in several of these tests are reported in Table 1. As part of the clinical evaluation, systolic (SBP) and diastolic (DBP) blood pressure measurements were obtained in the supine position from the brachial artery using an automatic sphygmomanometer. The mean arterial pressure (MAP) was derived as 2/3 DBP + 1/3 SBP. Mean disease duration, activity, severity, therapy, and serology of the patients with SLE, including antiphospholipid antibodies, are reported in Tables 1 and 2 and in our previous report11.
Magnetic resonance imaging
Anatomical MRI, DSC-MRI, and MR angiography to assess brain injury, cerebral perfusion, and cerebral atherosclerosis were performed on all subjects within 7 days of clinical assessment using a 1.5-Tesla Siemens Sonata scanner with an 8-channel head coil. The total examination time of the MRI protocol was roughly 1 h. Scout images were used to prescribe a series of whole-head T1-weighted, T2-weighted, and fluid-attenuated inversion recovery (FLAIR) images aligned with the interhemispheric midline and parallel to the anterior commissure-posterior commissure line. T1-weighted images [3-D fast low-angle shot sequence, TR/TE = 12 ms/4.76 ms, flip angle 20°, field of view (FOV) 256 mm × 256 mm, resolution 1 mm × 1 mm, 128 slices, slice thickness 1.5 mm] and T2-weighted images (turbo spin-echo sequence, TR/TE = 9040 ms/64 ms, turbo factor 5, FOV 220 mm × 220 mm, resolution 1.1 mm × 1.1 mm, 128 slices, slice thickness 1.5 mm) were acquired for anatomical segmentation of normal-appearing gray matter (GM), white matter (WM), and cerebrospinal fluid (CSF). The FLAIR image (variable flip, TR/TE/TI = 6000 ms/358 ms/2100 ms, averages = 2, slice thickness 1.5 mm, FOV 220 mm × 220 mm, matrix size 192 × 192) was used to manually segment lesions. The segmented GM, WM, CSF, and lesion maps were used to identify these regions in the processed perfusion maps. The DSC-MRI images21,22 were acquired with a perfusion-weighted echo planar imaging sequence (TR/TE = 1430 ms/46 ms, flip 90°, 20 slices, time course of 50 sequential acquisitions, FOV 200 mm × 200 mm, matrix size 128 × 128). Magnevist® contrast agent (gadopentetate dimeglumine) was injected into an antecubital vein at the standard dose of 0.1 ml/kg body weight using a power injector at 5 ml/s, starting 15 s after the start of scan acquisition, followed by 20 ml saline at the same rate. Raw DSC-MRI data were analyzed using the Penguin software (NordicImagingLab, Bergen, Norway) and the CBF maps constructed with Penguin were coregistered to the T1-weighted images to identify distinct brain regions within GM and WM as described11. Briefly, pixel intensity changes due to contrast (gadopentetate) passage over the time series of images are converted into pixel-by-pixel tissue contrast concentration curves, C(t). With user supervision, the software selects candidate arterial pixels to construct an arterial input function, AIF(t), based on the higher intensities and narrow time courses of the concentration changes. We attempted to locate and use pixels associated with the middle cerebral artery consistently for the construction of the AIF(t). A gamma variate function is fit to the raw C(t) and AIF(t) curves to capture just the first pass of the contrast bolus and used to represent C(t) and AIF(t) in further analyses. Calculation of CBF involves an equation relating C(t) to CBF and the convolution of AIF(t) and the residue function R(t), the fraction of contrast agent in the vasculature at any time: C(t) = CBF × [AIF(t) ⊗ R(t)], where ⊗ denotes the convolution operation. CBF maps constructed with Penguin were coregistered to the T1-weighted images to identify distinct brain regions within GM and WM. This procedure involved automatically segmenting the T1-weighted image into GM, WM, and CSF and coregistering the lesion map that was manually traced from the FLAIR image to the T1-weighted image. The T1-weighted image was warped into a standard brain template for identifying the major cortical and subcortical brain regions. Mean GM and WM CBF values for 4 cerebral regions (occipital, parietal, temporal, and frontal) and 4 subcortical regions (caudate, putamen, thalamus, and globus pallidus) for each hemisphere were determined. In order to resolve CBF in normal-appearing tissue from CBF in lesions, the mean regional cerebral or subcortical values of CBF were calculated without the lesion pixels included. This permitted comparison of normal-appearing tissue between groups (those with and those without lesions) without the confound of the lower lesion CBF values reducing the overall mean values for the region.
Statistical analysis
The primary goal of the statistical analysis was to identify factors most associated with the presence of elevated CBF in patients with SLE. Since a large number of clinical and laboratory variables were considered, the statistical strategy incorporated 3 levels of analysis with progressively increasing complexity and focus. At the first level, group differences in the various variables obtained for both controls and SLE subjects were examined with the Student t test and correlations between regional CBF and these measures were explored with univariate Pearson correlation analyses. In order for a clinical or laboratory variable to be a candidate for further analysis, the Pearson correlation with CBF was required to be significant (p ≤ 0.05) in at least 1 of the 16 GM or WM brain regions in which CBF was measured. To discount significant correlations that may have depended on outliers, a Spearman correlation analysis was also performed. Hence, both Pearson and Spearman correlations needed to be significant in order for a variable to be considered in further analyses. Using these criteria, 6 out of 36 variables collected from both SLE and control subjects qualified for further analyses (Table 3). The mean values and significance of group differences in the variables are given in Table 1.
Significant effects (p values) of the RM ANCOVA model.
In the second stage of analysis, each of these candidate factors was added as a covariate in a repeated measures (RM) analysis of covariance (ANCOVA) model. The use of RM ANCOVA follows the approach taken in our initial report on differences in CBF and CBV only, and is motivated by the fact that CBF varies substantially from region to region in the brain11. This regional variability would obscure small group differences in CBF in conventional t tests. In the current RM ANCOVA model, 8 brain regions were entered as a repeated factor (combined normal-appearing GM and WM CBF in occipital, parietal, temporal, frontal, caudate, putamen, thalamus, and globus pallidus regions), the 2 groups (SLE, controls) as a grouping factor, and the presence of lesions as a covariate. The brain regions used in computation of CBF excluded the lesions, but the presence of lesions still was included in the model as an important confounder. If the effects of group (SLE vs control) were rendered nonsignificant by addition of the covariate, then the factor would be considered a potential mediator between CBF and group. A common interpretation of such an effect is that the covariate “explains” (“intervenes” between) the group effect on the dependent variable. In each analysis, if the group-by-covariate interaction term were significant, then an interaction plot of CBF versus the covariate by group was examined to determine how the relationship between CBF and covariate differed in SLE and control groups. In the interaction plot for our model, we used the least-square means of the CBF values for each group while controlling for the lesion variable.
In the final stage of analysis, both univariate and stepwise multivariate regression models (forward/backward selection with p value ≤ 0.05 for variables to enter and to stay in the model) were used to directly explore the relationships between explanatory covariates identified in the various RM ANCOVA models and various physiologic measures in the study.
RESULTS
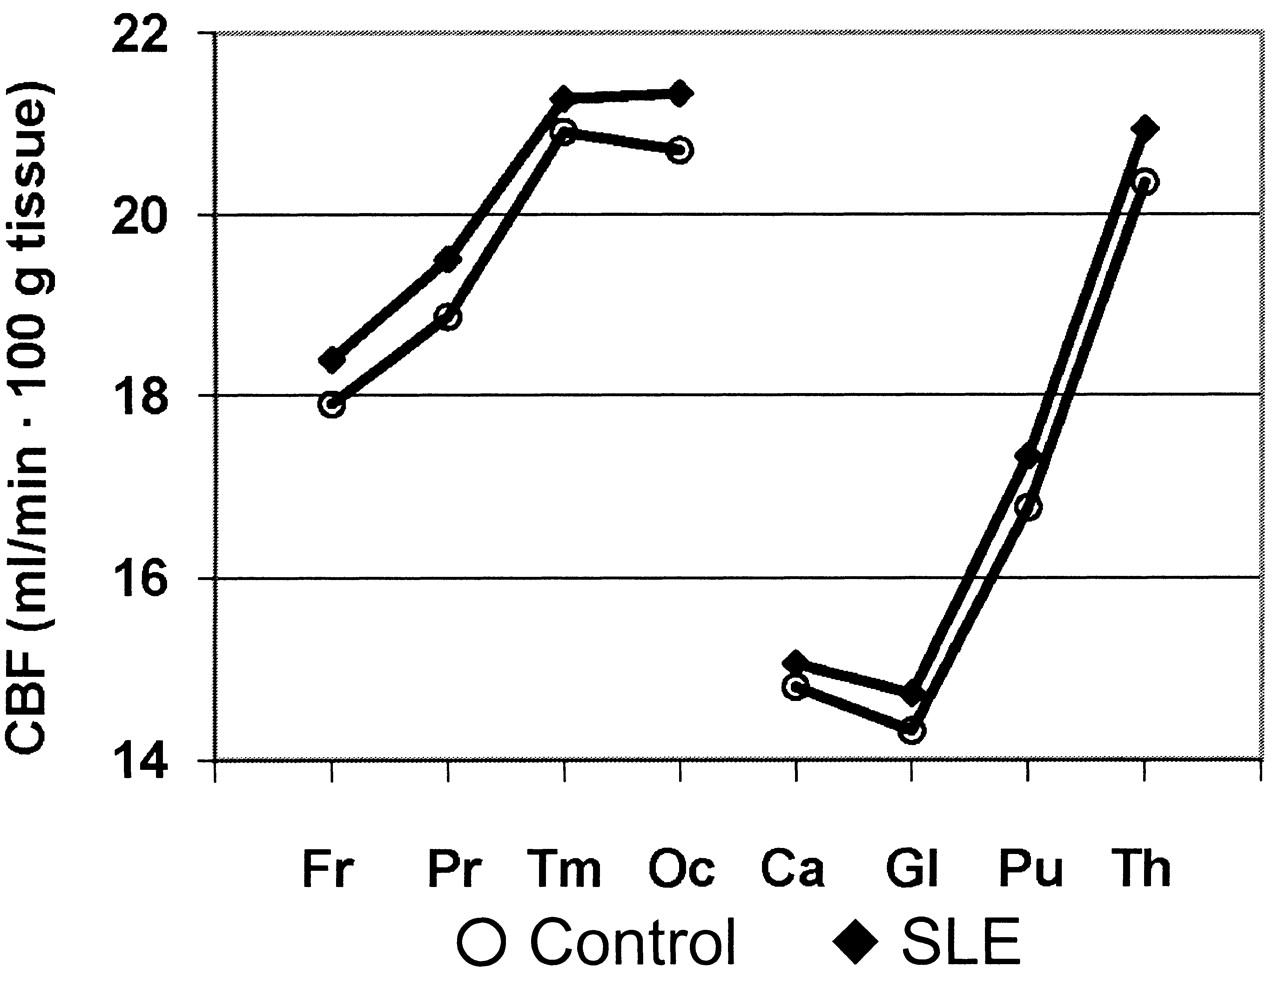
Group differences in combined GM and WM CBF in the 8 brain regions are illustrated in Figure 1. These plots demonstrate an anterior-to-posterior increase in CBF and overall higher CBF in patients with SLE relative to healthy controls, as reported previously11. Initial univariate correlation analyses revealed significant Pearson and Spearman correlations between regional CBF estimates and levels of 6 clinical variables: body mass index (BMI), MAP, SBP, DBP, platelet count, and tissue plasminogen activator (tPA). Three of the variables demonstrated significant group differences in Student t tests uncorrected for multiple comparisons (p < 0.05; Table 1). The means of MAP, SBP, and DBP were, respectively, 5%, 5%, and 4% higher in the SLE group, although the SBP difference was not significant. The platelet count was significantly higher in the control group.

Mean CBF values for each brain region in controls and subjects with SLE. Fr: frontal, Pr: parietal, Tm: temporal; Oc: occipital; Ca: caudate; Gl: globus pallidus; Pu: putamen; Th: thalamus.
Each of the 6 variables that correlated with CBF was entered as a covariate in an RM ANCOVA model with brain region as the repeated measure, group (SLE and control) and the presence of focal brain lesions (present or not present) as main effects, and a group-by-covariate interaction term. If the interaction effect was not significant (p > 0.05), the analysis was repeated with the interaction term absent from the model. Table 3 summarizes the results from this analysis. With no covariate in the model, the main effects of group and presence of lesion are both significant independent predictors of CBF, in agreement with our report in which GM and WM CBF were examined separately11. CBF was elevated in the SLE group with respect to the control group, and the group with lesions (23 of the 42 SLE subjects and 3 of the 19 controls) had lower CBF than the group without lesions. Posthoc tests with only SLE subjects demonstrated that SLE subjects without lesions significantly predicted higher CBF. However, active NPSLE had no significant influence on CBF, based on entering the Neuro-SLEDAI score as a covariate in the ANCOVA model. When the other clinical variables were added to the RM ANCOVA model as covariates, 5 demonstrated significant effects as independent predictors of CBF. Three variables, MAP, DBP, and tPA, showed a significant group-by-covariate interaction, indicating that the relationships between CBF and these variables within each group differed significantly. As can be appreciated in the interaction plots shown in Figure 2, these relationships appear to be blunted in the SLE group relative to the control group. Only 1 of the 6 variables, SBP, had an effect that was strong enough when entered as a covariate to render the group effect nonsignificant. Hence, although causality cannot be proven from correlation analyses, these results suggest (1) that the relationship between CBF and factors related to blood pressure and tPA differs significantly between patients with SLE and controls; and (2) that differences in SBP, in particular, may underlie the group differences in CBF observed in our study.

Analysis of covariance group-by-covariate interaction plots for mean arterial pressure (MAP), diastolic blood pressure (DBP), systolic blood pressure (SBP), and tissue plasminogen activator (tPA).
Since covarying with SBP uniquely rendered the group effect nonsignificant in the ANCOVA analyses, univariate correlation and stepwise multivariate regression models were used to explore the relationship between SBP and any of the clinical and laboratory variables obtained from subjects in the study. The aim of this analysis was to determine what underlying factors might be driving the SBP differences in groups, which in turn might explain the higher CBF in SLE subjects. Initial univariate analyses, uncorrected for multiple comparisons, revealed only 8 factors that correlated significantly with SBP that were not other measures of blood pressure. These factors are listed in Table 4. No significant correlation was discovered between corticosteroid (prednisone) dose and either CBF or any measure of blood pressure.
Correlation coefficients (r) and p values for measures that correlated significantly with systolic blood pressure (p ≤ 0.05) in either Pearson or Spearman corerlation analyses in one or both groups.
As expected, both body weight and BMI correlated strongly with SBP. However, neither mean weight nor BMI was significantly different between groups. Further, the mean white blood cell count was lower in the SLE group (although not significantly). Hence, although moderately correlated with SBP within or across groups, these factors are unlikely to account for the higher mean SBP in SLE subjects or underlie the effect of SBP as a covariate on the group CBF differences in the ANCOVA analysis. Of the remaining 5 factors, one, IgA antiphospholipid antibody (aPL-IgA), was measured only in subjects with SLE. Since aPL-IgA demonstrated a negative correlation with SBP and moreover, since aPL-IgA levels are expected to be absent or lower in healthy controls, this factor was also unlikely to account for the relationship between SBP and CBF group differences revealed in the ANCOVA analysis. The remaining 4 factors that correlated with SBP were blood urea nitrogen (BUN), tPA, plasminogen activator inhibitor 1 (PAI-1), and triglyceride levels. These factors were entered as independent variables in a stepwise multivariate regression model with SBP as the dependent variable. Group membership (SLE or control) was included as a binary independent variable to examine the contribution of group in predicting SBP. The best model selected by this analysis was one with group (p = 0.291), BUN (p = 0.026), and tPA (p = 0.010) as independent variables and an adjusted r2 of 0.20.
DISCUSSION
The results reveal 2 major findings: (1) increased CBF in the normal-appearing brain tissue of patients with SLE was statistically most strongly associated with SBP; and (2) the relationship between CBF and blood pressure in patients with SLE differed from the relationship in healthy controls, with SLE patients demonstrating a weaker correlation between CBF and either MAP or DBP. Since MAP is weighted much more by DBP (2/3) than by SBP (1/3), the similarity in the statistical relationship between MAP or DBP and CBF is not unexpected. However, only SBP was found to account statistically for the group effect on CBF, suggesting that the higher CBF observed in patients with SLE may be directly related to higher SBP in that group. Although the SLE subjects in this study were not clinically hypertensive as defined by the American Heart Association23, as a group they had higher blood pressure than the control group, with SBP demonstrating a difference at the greatest confidence level (p < 0.01). In posthoc correlation analyses, SBP was found to correlate with measures of SLE disease activity and/or severity such as renal dysfunction, thrombogenesis, and dyslipidemia.
Normal resting CBF is regulated against changes in cerebral perfusion pressure (MAP minus intracranial pressure) by changes in cerebrovascular resistance to blood flow through vasoconstriction or vasodilatation24,25. Vasomotor control is effected by vascular smooth muscle cells (the vascular myocytes of arteries and arterioles) or capillary pericytes, which, depending on the local state of neural activation, respond to various factors in a complex and exquisitely coordinated system that is far from being fully understood26. These factors could include the depolarizing effects of intravascular pressure on cell membranes, shear stress on endothelial cells, intramural vascular signaling, direct neuronal activation of myocytes and pericytes, or the response of vascular cells to various metabolic byproducts (e.g., hydrogen ions, free radicals, lactate, adenosine, CO2), neurotransmission factors (e.g., K+, Ca++, acetylcholine, dopamine, GABA, noradrenalin), or other vasoactive agents derived from local neurons, astrocytes or endothelium (e.g., NO, prostacyclin, substance P, endothelin, prostaglandins). A diminished vasomotor response to changes in blood pressure, therefore, could indicate a dysfunction in one or more of these systems.
In our study, a stronger relationship between CBF and either MAP or DBP was found within the healthy control group relative to the SLE group. While these findings might seem to run counter to the expectation that CBF would be better regulated against systemic blood pressure changes in healthy subjects, it is important to bear in mind that the cross-sectional data of the study do not reflect the dynamic responses of CBF to local neural activation or to challenges to CBF by changes in blood pressure in individual subjects. Rather, the data reflect the relationships among regional resting-state CBF in combined GM and WM and various clinical and laboratory variables taken a few days before the CBF measurement. Thus, caution must be exercised when interpreting the blunted relationship of CBF to MAP, DBP, or tPA observed in the SLE group with respect to any particular mechanism involved in autoregulation of CBF. These data simply demonstrate that a portion of the group variance in CBF across healthy individuals can be explained by the variance in MAP, DBP, or tPA. In light of this, what appears abnormal in the SLE group is a weakening of these relationships: variations in resting CBF across the brain are not as strongly related to MAP, DBP, or tPA across the SLE group. Hence, although not directly probing the vasomotor response in subjects, these data are nonetheless consistent with an abnormal vascular condition (vasculopathy or vasoregulatory abnormality) in the SLE group, which may have a multifactorial origin.
One factor that might underlie this abnormality is increased arterial stiffness (reduced compliance) due to increased vascular tone, resulting in vasoconstriction, atherothrombosis, thromboemboli, vascultis, or atherosclerosis27. Arterial stiffness limits increases of CBF by reducing distensibility and at the same time leads to increased SBP28. In our study, SBP correlated with a subset of markers of SLE disease activity and/or severity, such as renal dysfunction (BUN), thrombogenesis (platelets, tPA, and PAI-1), and dyslipidemia (triglycerides). While none of these markers was significantly higher in the SLE group, they are commonly of clinical significance in patients with SLE and can be associated with arterial stiffness and hypertension29. In a study on patients with kidney disease and elevated blood pressure, including 1 patient with SLE, Kuwabara, et al observed higher CBF in patients relative to healthy controls and also found a significant correlation between CBF and MAP30.
Another possible origin of an abnormal vasomotor function is the vascular endothelium. The endothelium has a central role in both regulation of vascular tone and production of tPA31, and endothelial dysfunction has been reported in SLE32,33,34,35,36. Endothelial dysfunction is also associated with and can be an initiating factor of atherosclerosis37,38. However, in our study, the mean blood level of endothelium-derived microparticles (CD144) in patients with SLE (157 ± 247 particles/μl plasma) was not significantly higher than that in controls (153 ± 125 particles/μl plasma), nor did levels of endothelium-derived microparticles correlate with CBF. Hence, there is no direct evidence that endothelial dysfunction underlies differences in CBF observed in our study.
Finally, we cannot exclude the possibility that transient factors not measured in our study contributed to elevated CBF or DBP in the SLE group at the time of MRI scanning, for example, physiological factors related to sudden changes in symptoms. However, the proportion of subjects experiencing such an event, and its effect size, would have to be substantial to account for the group differences observed. Similarly, due to the sample size and the heterogeneity of medications taken by subjects in the SLE group during the study, including corticosteroids, antihypertensive drugs, antiplatelet drugs, and antimalarials, it is not possible to evaluate with sufficient statistical power the effect of any one drug on CBF or blood pressure, other than prednisone, which showed no significant correlation with either measurement. Nonetheless, even though these medications would not be expected to increase CBF, we cannot exclude the possibility of a medication effect.
The higher CBF found in the SLE group relative to the control group in our study could be statistically accounted for by the higher SBP in the SLE group. The weaker relationship between CBF and either MAP, DBP, or tPA within the SLE group is consistent with vascular dysfunction (systemic vasculopathy) in the SLE group. Group differences and correlations with other physiologic measures, as well as findings by other groups, suggest that the higher SBP and blunted relationship of CBF with MAP, DBP, or tPA may derive from atherothrombosis, vasculitis, atherosclerosis, or a combination of these conditions. Although having on average a higher blood pressure than control subjects, the patients with SLE were not hypertensive, suggesting that the observed cerebrovasomotor changes were pathologic dysregulation of CBF at normotensive or prehypertensive levels. The investigation of CBF autoregulation in SLE to test these hypotheses will be a productive focus for future research.
Footnotes
-
Supported by grant RO1 HLO77422-01-A3 from the National Institutes of Health.
- Accepted for publication November 9, 2011.
REFERENCES
- 1.
- 2.
- 3.
- 4.
- 5.
- 6.
- 7.
- 8.
- 9.
- 10.
- 11.
- 12.
- 13.
- 14.
- 15.
- 16.
- 17.
- 18.
- 19.
- 20.
- 21.
- 22.
- 23.
- 24.
- 25.
- 26.
- 27.
- 28.
- 29.
- 30.
- 31.
- 32.
- 33.
- 34.
- 35.
- 36.
- 37.
- 38.