
Abstract
Objective. CD4+ T cells from patients with systemic lupus erythematosus (SLE) display defective function that contributes to abnormal activation of B cells and autoantibody production.
Methods. We compared the transcript and protein levels of Fyn and CD70 in CD4+ T cells from patients with SLE (n = 41) and healthy individuals (n = 34). The CD4+ T cells were isolated by positive biomagnetic separation technique. The quantitative analysis of messenger RNA was performed by reverse transcription and real-time quantitative PCR. The protein contents in the CD4+ T cells were determined by Western blotting analysis.
Results. We observed significantly higher levels of Fyn (p = 0.03) and CD70 (p = 0.029) transcripts in SLE CD4+ T cells than in controls. There was a significant increase in CD70 protein levels (p < 0.0001), but not Fyn protein levels (p = 0.081) in CD4+ T cells from patients with SLE compared to healthy individuals. In the group with high disease activity [SLE Disease Activity Index (SLEDAI) ≥ 9], we observed a significantly higher Fyn protein content than in controls (p = 0.030). There was no correlation between Fyn and CD70 protein levels in SLE CD4+ T cells and disease activity as expressed in the SLEDAI scale.
Conclusion. We confirmed previous observations of higher expression of CD70 in CD4+ T cells from patients with SLE. Our findings suggest that increased Fyn protein content in CD4+ T cells can be associated with high SLE disease activity.
- SYSTEMIC LUPUS ERYTHEMATOSUS
- CD70 EXPRESSION
- CD4+ T CELLS
Systemic lupus erythematosus (SLE) is a complex autoimmune disorder, characterized by a broad spectrum of clinical and immunological abnormalities1,2. Immune cells from patients with SLE exhibit various aberrations, including skewed cytokine production, lowering of cytotoxic T cell function, and increase of humoral response3–6. Abundant production of autoantibodies directed against self-antigens leads to formation of immunocomplexes that affect multiple organs6,7.
The interaction of the T cell receptor (TCR)/CD3 complex of T CD4+ cells with antigen bound to the major histocompatibility complex (MHC) of B lymphocytes is an essential step in B cell differentiation into plasma cells and antibody biosynthesis8. Binding of the TCR with a specific antigen leads to activation of Lck or Fyn nonreceptor tyrosine kinases9. Subsequently, these kinases result in phosphorylation of the cytoplasmic domain of the immunoreceptor tyrosine-based activation motif of CD3-zeta and ZAP-70 kinase9,10. The ZAP-70 kinase phosphorylates other signal proteins including LAT and SLP-769,11. This initiates numerous biochemical intracellular events, resulting in second messengers and transcription factor activation, and the expression of genes encoding proteins involved in immune response11,12.
Defective function of CD4+ T cells can contribute to abnormal activation of B cells in patients with SLE3–6. These defects are associated with changes in expression or activity of various molecules involved in CD4+ T cell stimulation3–5.
It has been demonstrated that Fyn gene depletion significantly reduces the clinical manifestation of lupus in MRL/lpr mice13. Moreover, the Fyn protein was proposed as a positive regulator of autoimmune disease in MRL/lpr mice13.
In addition to the interaction of the TCR with a specific antigen bound to the MHC, a number of costimulatory molecules are needed to help regulate T CD4+ cell stimulation and B cell differentiation into plasma cells8. One of the costimulatory molecules is CD70, also known as CD27 ligand14. It has been reported that CD70 overexpression in T cells contributes to SLE incidence and autoantibody production15–17.
We compared transcript and protein levels of Fyn and CD70 in CD4+ T cells from patients with SLE and healthy individuals.
MATERIALS AND METHODS
Patients and controls
Forty-one patients (39 women and 2 men) fulfilling the American College of Rheumatology classification criteria for SLE18,19 were chosen in a serial manner for investigation at the Institute of Rheumatology in Warsaw and the Department of Rheumatology and Clinical Immunology at the Poznan University of Medical Sciences (Table 1).
Demographic, organ involvement, and immunological findings of patients with SLE.
One, 5, 10, 5, 3 and 1 patients were receiving prednisone in doses of 5, 7.5, 10, 15, 20, and 52 mg, respectively, per day. Sixteen patients were receiving methylprednisone. Nine of these patients were also receiving hydroxychloroquine. In order to reduce the effect of corticosteroid medication on our results, patients who were taking prednisone or methylprednisone were asked not to take this medication for at least 24 h before blood was drawn. The protocol of the study was approved by the Local Ethical Committee of Poznan University of Medical Sciences. Written informed consent was obtained from all participating subjects.
Disease activity for the patients with SLE was assessed using the SLE Disease Activity Index (SLEDAI)20. The control group included 34 healthy individuals (32 women and 2 men). The mean age of controls was 37.3 ± 10.6 years. Both patients and controls were of Polish Caucasian origin. To reduce the effect of symptom misinterpretation by patients, we decided to use SLEDAI ≥ 9 as the threshold for active disease.
Antibodies
Rabbit polyclonal anti-Fyn antibody (sc-16), goat anti-rabbit horseradish peroxidase (HRP)-conjugated antibody, goat polyclonal anti-CD70 antibody (C-20), donkey anti-goat horseradish peroxidase (HRP)-conjugated antibody, and anti-actin HRP-conjugated antibody (clone I-19) were provided by Santa Cruz Biotechnology (Santa Cruz, CA, USA).
CD4+ T cell isolation
Each patient and control provided a 10 ml blood sample, collected into tubes containing EDTA. To isolate CD4+ cells from whole peripheral blood, we employed the positive biomagnetic separation technique using DETACHaBEADs® M-450 CD4, which were coated with anti-CD4 monoclonal antibody (Dynal Biotech, Lake Success, NY, USA). The purity of CD4+ cells was determined by flow cytometry analysis (n = 30). The content of CD4+ T cells was 94.6% ± 1.5%. Contaminating cell populations included CD14+ cells (2.6% ± 1.5%) and gamma-delta T cells (Vd2+ T cells), representing 1.2% ± 0.5%. Other cell subsets included CD8+ T cells, B cells (CD19+), natural killer cells (CD56+), plasmacytoid dendritic cells (CD123+ HLA DR+ CD14– CD19–), and myeloid dendritic cells (CD1c+ HLA DR+ CD14– CD19–), representing less than 0.8%.
Analysis of Fyn and CD70 transcript levels in CD4+ T cells
Total RNA was isolated according to the method of Chomczynski and Sacchi21. RNA integrity was confirmed by denaturing agarose gel electrophoresis, and the concentration was quantified by measuring the optical density at 260 nm. 1 μg RNA samples were treated with DNase I, and reverse-transcribed into cDNA using oligo-dT primers. Real-time quantitative polymerase chain reaction (RQ-PCR) was conducted in a Light Cycler real-time PCR detection system (Roche Diagnostics GmbH, Mannheim, Germany) using SYBR® Green I as detection dye, and target cDNA was quantified with the relative quantification method using a calibrator. The calibrator was prepared as a cDNA mix from all SLE and control samples, and consecutive dilutions were used to create a standard curve as described in the Relative Quantification Manual, Roche Diagnostics. For amplification, 2 μl of cDNA solution was added to 18 μl of QuantiTect® SYBER® Green PCR Master Mix (Qiagen GmbH, Hilden, Germany) and primers (Table 2). The quantity of Fyn and CD70 transcripts in each sample was standardized by human mitochondrial ribosomal protein L19. The Fyn and CD70 mRNA levels were expressed as a multiplicity of these cDNA concentrations in the calibrator.
Oligonucleotide sequences used for RQ-PCR analysis.
Electrophoresis and analysis
Sodium dodecyl sulfate-polyacrylamide gel electrophoresis (SDS-PAGE) and Western blot analysis were done for Fyn and CD70 protein contents in CD4+ T cells. CD4+ lymphocytes were lysed in lysis buffer, and 10 μg of protein was resuspended in sample buffer. The proteins were separated on 10% Tris-glycine gel using SDS-PAGE and transferred to PVDF membrane. Immunodetection was performed with rabbit polyclonal anti-Fyn antibody, goat polyclonal anti-CD70 antibody, and appropriate HRP-conjugated goat anti-rabbit antibody or HRP-conjugated donkey anti-goat antibody. The membranes were reblotted with anti-actin HRP-conjugated antibody to equalize protein loading of the lanes. To detect the examined protein from the same blot membrane we used stripping buffer. Bands were revealed using SuperSignal West Femto Maximum Sensitivity Substrate (Pierce, Rockford, IL, USA). The quantities of Western blot-detected Fyn, CD70, and ß-actin proteins were determined based on the band for optical density. The band densitometry readings were normalized to ß-actin loading control to calculate the Fyn or CD70 to ß-actin optical density ratio.
Statistical analysis
Statistical analysis, including power calculation, was conducted by StatSoft Inc. (2001). The Statistica data analysis software system, version 6, was used. The significance of differences between groups was determined using the nonparametric Mann-Whitney test. Correlations between Fyn and CD70 expression and disease activity expressed in the SLEDAI scale were assessed by Spearman analysis.
RESULTS
Fyn and CD70 transcript and protein levels in CD4+ T cells
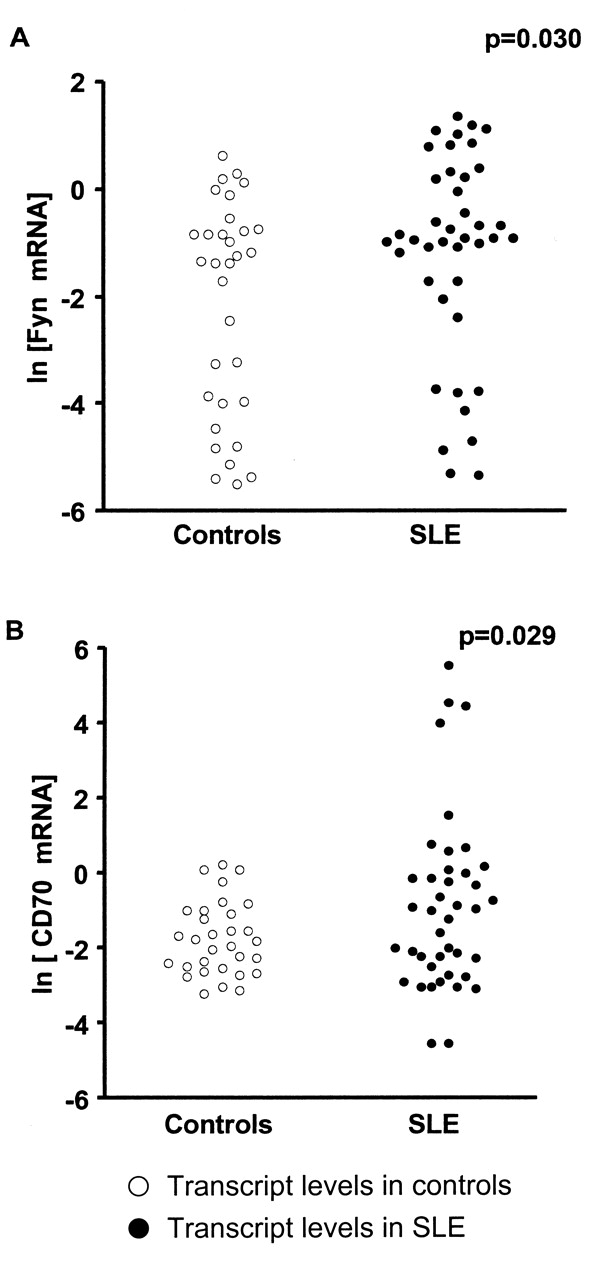
To compare Fyn and CD70 transcript and protein levels in CD4+ T cells from patients with SLE and controls we used RQ-PCR and Western blotting analysis. We observed significantly higher levels of Fyn (p = 0.03) and CD70 (p = 0.029) transcripts in SLE CD4+ T cells than in controls (Figures 1A and 1B, and Table 3). There was no significant increase in Fyn protein content in SLE CD4+ T cells compared to controls (p = 0.081; Figure 2A and Table 3). However, in the group with high disease activity (SLEDAI ≥ 9), we observed a statistically higher level of Fyn protein than in controls (p = 0.030; Figures 2B and 2D and Table 3). The statistical power of the Fyn protein study for all patients and patients with SLEDAI ≥ 9 amounted to 20% and 50%, respectively. To obtain a power of 80% for all patients with SLE we should increase the number of patients and controls to 250 each. A power of 80% for patients with SLEDAI = 9 can be reached with 45 each of patients and controls.

Fyn (A) and CD70 (B) transcript levels in CD4+ T cells from patients with SLE and controls. The CD4+ T cells were isolated from peripheral blood by positive biomagnetic separation technique, and immediately used for RNA isolation and reverse-transcription; and cDNAs were investigated by RQ-PCR relative quantification analysis. To normalize the quantity of transcripts in each sample, Fyn and CD70 mRNA levels were corrected to the amount of hMRLP19. The amounts of Fyn and CD70 messenger RNA were expressed as the natural logarithm of multiplicity of these cDNA copies in calibrator.

Fyn (A, B) and CD70 (C) protein contents and representative Western blot analysis (D) in CD4+ T cells from controls and patients with SLE. CD4+ T cell proteins were separated using SDS-PAGE, transferred, and the membrane was immunoblotted with primary antibody and HRP-conjugated secondary antibody. Membranes were reblotted with anti-ß-actin HRP-conjugated antibody to equalize protein loading of lanes. The amount of Fyn and CD70 proteins detected by Western blot was presented as the natural logarithm of Fyn or CD70 to ß-actin band optical density ratio. Fyn protein contents in CD4+ T cells from patients with SLE with high disease activity (SLEDAI ≥ 9) are shown in panel B.
Fyn and CD70 transcript and protein levels in CD4+ T cells from patients with SLE and controls.
We found significantly higher contents of CD70 protein in CD4+ T cells from patients with SLE compared to healthy controls (p < 0.0001; Figures 2C and 2D and Table 3). There was no correlation between Fyn and CD70 proteins in SLE CD4+ T cells and disease activity expressed in the SLEDAI scale (Figures 3A and 3B). We also did not observe correlations between age, disease duration, drug treatment, and Fyn and CD70 protein levels in SLE CD4+ T cells (results not shown).

Correlation between Fyn (A) and CD70 (B) protein levels in CD4+ T cells and clinical activity of SLE scored by SLEDAI20 scale was assessed by Spearman analysis (correlation coefficient r). CD4+ T cell proteins were separated using SDS-PAGE, transferred, and the membrane was immunoblotted with primary antibody and HRP-conjugated secondary antibody. Membranes were reblotted with anti-ß-actin HRP-conjugated antibody to equalize protein loading of lanes. The amount of Fyn and CD70 proteins detected by Western blot was presented as the natural logarithm of Fyn or CD70 to ß-actin band optical density ratio.
DISCUSSION
The skewed expression of genes encoding numerous proteins responsible for defective function of CD4+ T cells has been reported3–5. These proteins include signal molecules, transcription factors, components of TCR/CD3 complex, costimulatory proteins, and cytokines3–5.
CD70 belongs to the tumor necrosis factor (TNF) family and is expressed on activated CD4+, CD8+ T cells, and B cells14,22,23. The expression of CD70 is rapidly increased following mitogenic stimulation or stimulation with TNF-α, but CD70 is not expressed by unstimulated T cells14,22,23. CD70 overexpression in CD4+ T cells leads to B cell costimulation and immunoglobulin overproduction contributing to drug-induced and idiopathic lupus15,17. The CD4+ T cells from patients with active lupus exhibit reduced extracellular signal-regulated kinase (ERK) pathway signaling, decreased expression of DNA methyltransferase 1 (DNMT1), and DNA hypomethylation leading to CD70 overexpression15,17. Increased CD70 expression on the surface of CD4+ T cells is also due to direct inhibition of DNMT1 or ERK pathway, observed in patients with drug-induced lupus15,17,24. These observations were further proved by Sawalha and Jeffries, who observed that decreased expression of DNMT1 correlated with DNA hypomethylation and CD70 overexpression in CD4+ T cells in MRL/lpr lupus-prone mice25.
We found significantly higher expression of CD70 protein levels in SLE CD4+ T cells than in healthy individuals. However, we did not find a correlation between CD70 protein levels in SLE CD4+ T cells and disease activity. Our findings are consistent with those of Han, et al, who demonstrated a significant increase in the median of CD70+CD4+ T cell frequencies in patients with SLE compared to healthy individuals16. They also did not observe a correlation between CD70 expression in CD4+ T cells and SLE activity16. Oelke, et al indicated higher CD70 densities on surfaces of SLE CD4+ T cells than in controls15. However, they observed that the increase in CD70 expression was directly related to disease activity15. We also observed the effect of enhanced expression of CD70, but not of Fyn, on the production of IgG by autologous B cells (data not shown), which was consistent with the findings of Oelke, et al15.
We found no significant increase in Fyn protein levels in SLE CD4+ T cells compared to controls. However, in the group with high disease activity (SLEDAI ≥ 9), we observed statistically significant higher Fyn protein content than in controls. Although Fyn levels were higher in patients with active lupus (SLEDAI ≥ 9) than in controls, Fyn expression did not directly correlate with disease activity. These observations suggest that increased Fyn or CD70 expression does not perpetuate disease activity. An increased expression of Fyn can be associated with anergy and decreased interleukin 2 (IL-2) biosynthesis in T cells26–28.
Takahashi, et al postulated that Fyn provided a signal for both the expansion of autoreactive T cells and the biosynthesis of anti-DNA antibody by B cells in MRL/lpr lupusprone mice13. They observed that Fyn-deficient MRL/lpr mice exhibited significantly limited disease and lived longer than Fyn-expressing MRL/lpr mice13. Blasini, et al found that Fyn obtained from SLE peripheral blood T cells exhibited elevated tyrosine kinase activity29. However, they observed lower Fyn protein levels in SLE T cells than in controls29. This discrepancy between findings from Blasini, et al and our results may be due to differences in Fyn content between total peripheral T cells and the CD4+ T cell subset from patients with SLE.
Fyn and Lck kinases are inhibited by phosphorylation of their conserved C-terminal tyrosine residue, conducted by Csk kinase30,31. Csk-binding protein (Cbp) is an adapter protein that recruits Csk to lipid rafts localized in the plasma membrane32. Davidson, et al showed that Fyn bound to Cbp-Csk in glycolipid-enriched membrane rafts can stimulate calcium signals and enhance T-cell anergy, while these effects were not seen in Fyn-deficient mice26. Filby, et al demonstrated that the absence of Fyn in T cells enhances production of IL-2 and leads to an increase in T cell proliferation27. They reported that sustained Lck activation is needed for cytokine production and T cell division, while activation of Fyn kinase displays the opposite effect27. These findings may suggest that an increase in Fyn protein levels may partially support anergic properties and reduced production of IL-2 exhibited by CD4+ T cells from patients with SLE28,33.
We also observed significantly higher CD44, PP2A, CREM, and Syk protein levels in CD4+ T cells from patients with SLE compared to controls (data not shown), which were consistent with previous findings34–37. Moreover, we confirmed an increased expression of CD70 in SLE CD4+ T cells, and our findings suggest an association between increased Fyn protein in CD4+ T cells and high SLE disease activity. However, our results require confirmation in a significantly larger group of patients with SLE in other populations.
Acknowledgments
We acknowledge Margarita Lianeri for her assistance. We also thank Dr. Eliza Kwiatkowska and Dr. Marcin Hołysz for many helpful discussions and processing of figures.
Footnotes
-
Supported by grant No. N N402 2424 33 from the Polish Ministry of Scientific Research and Information Technology.
- Accepted for publication August 7, 2009.
REFERENCES
- 1.
- 2.
- 3.
- 4.
- 5.
- 6.
- 7.
- 8.
- 9.
- 10.
- 11.
- 12.
- 13.
- 14.
- 15.
- 16.
- 17.
- 18.
- 19.
- 20.
- 21.
- 22.
- 23.
- 24.
- 25.
- 26.
- 27.
- 28.
- 29.
- 30.
- 31.
- 32.
- 33.
- 34.
- 35.
- 36.
- 37.