

Abstract
Objective Observational research of axial spondyloarthritis (axSpA) is limited by a lack of methods for identifying diverse axSpA phenotypes in large datasets. Algorithms were previously designed to identify a broad spectrum of patients with axSpA, including patients not identifiable with diagnosis codes. The study objective was to estimate the performance of axSpA identification methods in the general Veterans Affairs (VA) population.
Methods A patient sample with known axSpA status (n = 300) was established with chart review. For feasibility, this sample was enriched with veterans with axSpA risk factors. Algorithm performance outcomes included sensitivities, positive predictive values (PPV), and F1 scores (an overall performance metric combining sensitivity and PPV). Performance was estimated with unweighted outcomes for the axSpA-enriched sample and inverse probability weighted (IPW) outcomes for the general VA population. These outcomes were also assessed for traditional identification methods using diagnosis codes for the ankylosing spondylitis (AS) subtype of axSpA.
Results The mean age was 54.7 and 92% were male. Unweighted F1 scores (0.59–0.74) were higher than IPW F1 scores (0.48–0.65). The full algorithm had the best overall performance (F1IPW 0.65). The Early Algorithm was the most inclusive (sensitivityIPW 0.90, PPVIPW 0.38). The traditional method using ≥ 2 AS diagnosis codes from rheumatology had the highest PPV (PPVIPW 0.84, sensitivityIPW 0.34).
Conclusion The axSpA identification methods demonstrated a range of performance attributes in the general VA population that may be appropriate for various types of studies. The novel identification algorithms may expand the scope of research by enabling identification of more diverse axSpA populations.
Observational research in large populations is important for studying uncommon outcomes and diseases in real-world settings1. In the field of axial spondyloarthritis (axSpA), there is a dearth of big data research due to challenges with identifying axSpA patients in large datasets. With advancements in imaging and treatment, it has become apparent that many patients with axSpA were previously unrecognized with traditional concepts of disease2,3. Despite our broader understanding of axSpA, big data axSpA research continues to be constrained by outdated axSpA definitions, since International Classification of Diseases, 9th and 10th revisions (ICD-9 and ICD-10, respectively) billing codes exist only for a single axSpA phenotype: ankylosing spondylitis (AS)4,5,6,7,8. As such, around half of the approximately 3.3 million Americans with axSpA have been excluded from big data axSpA research9,10, and data are sparse with important outcomes such as mortality, comorbidities, and treatment patterns in real-world axSpA populations8,11.
Even within the narrower AS disease spectrum, traditional methods for identifying patients are limited. AS research in large datasets typically relies on AS ICD codes12,13,14,15. However, AS ICD codes may not perform well for case identification in the United States16. Other methods may improve accuracy, such as supplementing AS ICD codes with chart review; however, studies requiring chart review have limited sample sizes since chart review is impractical for thousands of patients. Further, chart review is not possible in many large datasets since access to patient-level data is restricted. Other approaches may improve specificity, such as requiring an AS medication or a rheumatology visit in conjunction with AS diagnosis codes, but these approaches fail to capture important subsets of AS patients (i.e., untreated patients or patients receiving AS care from a primary care provider).
To address limitations with axSpA patient identification in large datasets, we developed algorithms that use structured and unstructured data to identify axSpA patients in national Veterans Health Administration (VHA) datasets17. These algorithms performed well in a sample of veterans enriched with risk factors for axSpA (area under the curve [AUC] 0.86–0.96)18. A similar approach was applied to a Boston-based population enriched with axSpA patients, and the results were similar (AUC 0.80–0.93)19. However, the axSpA-enriched populations are expected to be different from general (unenriched) populations, and the ability of the algorithms to accurately identify patients with axSpA in the general population was unknown. The goal of this study was to estimate the performance of axSpA identification algorithms in the general Veteran population.
MATERIALS AND METHODS
Data sources. This study used historical data from veterans enrolled in the VHA. The data source was the Corporate Data Warehouse (CDW), a national repository of data from the VHA medical record system (VistA) and other VHA clinical and administrative systems2. Data were housed and analyzed within the Veterans Affairs Informatics and Computing Infrastructure (VINCI)20. This research was conducted in compliance with the Declaration of Helsinki, with the approval of the University of Utah Institutional Review Board (IRB_00052363).
AxSpA identification methods. Five methods for identifying axSpA in large datasets were assessed (Table 1). These included 3 novel methods developed by our team: the Full Algorithm, the High Feasibility Algorithm, and the Early Algorithm. We also assessed 2 traditional methods that have been used in axSpA epidemiologic studies including ≥ 2 AS ICD codes ≥ 7 days apart from any source (AS codes, any specialty) and ≥ 2 AS ICD codes ≥ 7 days apart from a rheumatology encounter (AS codes, rheumatology). Details about algorithm development were previously published18,21. In brief, the Full Algorithm is the most comprehensive, with 3 natural language processing (NLP) models22 and 46 coded variables. The High Feasibility Algorithm included the 16 top-ranked coded variables. The Early Algorithm is similar to the Full Algorithm, except SpA ICD codes and rheumatology visits were not included, to enhance identification of earlier disease or less classic phenotypes. Random forest and 5-fold cross-validation were used to develop and test the algorithms23,24,25,26.
Methods for identifying axial SpA.
Population. To assess performance of the identification methods, an independent sample of 300 veterans with known axSpA status (axSpA vs no axSpA) was established with chart review. Since it was not feasible to chart review the tens of thousands of patients that would have been required to randomly capture a sufficient number of axSpA patients, we enriched this chart review sample with veterans at elevated risk for axSpA.
We used the Full Algorithm to estimate axSpA risk. Random forest cutoff scores from the Full Algorithm were used to quantify axSpA risk and assign each veteran to a risk quartile (i.e., cutoff scores of 0.75–1.00 for the highest risk quartile, 0.50–0.75 for the second highest, 0.25–0.50 for the third highest, and 0.0–0.25 for the lowest). Veterans were selected from each risk quartile for chart review. Rheumatologist chart reviewers used annotation software (eHOST27) to review and classify the 300 sampled veterans as having or not having axSpA, according to expert opinion and our previously published axSpA chart review guidelines18,21.
Inverse probability weighting for estimating algorithm performance in the general population. The performance estimates in axSpA-enriched populations are subject to partial verification bias20. Verification bias occurs when the reference standard has not been carried out in all patients because of ethical or practical reasons28 (i.e., the algorithms were developed in an axSpA-enriched sample rather than the general Veterans Affairs [VA] population). Verification is known to lead to biased accuracy estimates. To correct for verification bias and understand how the algorithms are expected to function in the general VA population, we applied inverse probability weighting (IPW). IPW enables calculating statistics standardized to a target population (general VHA population) that is different from the population in which the data were collected (axSpA-enriched sample)29. General population-level statistics were calculated by applying sampling weights based on the distribution of patients within each risk quartile (Supplementary Table 1, available with the online version of this article) and bootstrapping to obtain 95% CI.
Other statistics. Means, percentages, SD, and 95% CI were used to compare the subset of randomly selected veterans to the sample selected for chart review. Algorithm performance was evaluated with sensitivity, positive predictive values (PPV), and F1 scores, with and without IPW. The F1 score is an overall measure of performance that considers both the PPV (precision) and sensitivity (recall)30  . F1 is useful for assessing performance in low-prevalence conditions. F1 scores were used to select the optimal cutoff scores for determining a positive vs negative outcome with the algorithms. As expected in a low-prevalence disease, specificity, negative predictive value, accuracy, and receiver-operator curve analysis were not useful for differentiating between axSpA identification methods, since the differences between algorithms with each of these outcomes was very small.
RESULTS
Population. We randomly selected 150,000 veterans participating in the national VHA system between January 1, 2007, and June 30, 2017 (Figure 1). After excluding Veterans with < 2 outpatient encounters ≥ 7 days apart, there were 79,826 remaining veterans. They were classified into quartiles for axSpA risk determined by probabilities calculated from the Full Algorithm. Sixty-one patients were classified in the first (highest risk) quartile, 65 in the second quartile, 276 in the third quartile, and 79,424 in the fourth quartile. All patients in the first and second quartiles were selected for chart review. From the third quartile, 74 of the 276 patients were randomly selected for chart review, and from the fourth quartile, 100 of 79,424 patients were randomly selected for chart review. In total, 300 patients were selected for chart review.

Selection of patient sample for chart review. axSpA: axial spondyloarthritis; VHA: Veterans Health Administration.
Patient features were compared between veterans from the general population (with ≥ 2 encounters in the VHA system ≥ 7 days apart) vs patients selected to the chart review study sample (Table 2). Compared to the general VA population, the chart review patients were younger (54.7 vs 58.1 yrs) and had a higher comorbidity burden (Charlson comorbidity index 2.6 vs 2.1). The percentage of veterans with a clinically available positive HLA-B27 test result was higher in the chart review sample than the general VA population (8.0% vs 0.09%). Low back pain was more common in the chart review sample than the general VA population (12.0% vs 7.1%), and exposure to disease-modifying antirheumatic drugs (DMARD) was higher in the chart review sample (nonbiologic: 21.3% vs 1.6%, biologic: 22.0% vs 0.5%). The chart review patients were enrolled in the VA for a longer duration (7.7 vs 6.5 yrs). The chart review patients had more encounters within the VA system per year than the general VA population (37.9 vs 26.9), where VA system encounters were defined as provider visits and ancillary services (pharmacy, laboratory, radiology, physical therapy, social work, nutrition, chiropractic services, etc.). Per chart review, 30.3% of veterans in the chart review patients were classified as having axSpA. According to the 5 axSpA identification methods, 0.06–0.51% were classified as having axSpA in the general VA population vs 16.3–52.7% in the chart review sample.
Characteristics and axSpA classifications of the general VHA population and the chart review sample.
Performance of identification methods. For the Full Algorithm, Early Algorithm, and High Feasibility Algorithm, random forest cutoff scores (for classifying patients as having or not having axSpA) were evaluated with sensitivity, PPV, and F1 scores (exemplified with the Full Algorithm in Figure 2). We selected optimal cutoff scores of 0.50 for all 3 algorithms. These scores were applied to subsequent analyses.

Random forest cutoff scores for full algorithm. PPV: positive predictive value.
The unweighted sensitivities of the 5 identification methods ranged from 0.45 to 0.92 (Figure 3). The unweighted PPV ranged from 0.53 to 0.84, and the unweighted F1 scores ranged from 0.59 to 0.74. With IPW, the weights assigned to each risk quartile were proportional to the number of patients from the general veteran population in each risk quartile (first quartile 1.0, second quartile 1.0, third quartile 3.7, fourth quartile 794.2; Supplementary Table 1, available with the online version of this article). After applying IPW, the sensitivities of the 5 identification methods ranged from 0.34 to 0.90 (Figure 4). The Early Algorithm had statistically higher sensitivity (nonoverlapping 95% CI) compared to the High Feasibility Algorithm, AS codes (any specialty), and AS Codes (rheumatology). The PPV ranged from 0.38–0.84. The AS codes (rheumatology) had statistically higher PPV than the other 4 identification methods. F1 scores ranged from 0.48 to 0.65. The Full Algorithm had the numerically highest F1 score, but the F1 scores for all methods were statistically similar.

Performance of identification methods in the axSpA-enriched population, as measured by unweighted sensitivity, PPV, and F1 scores. AS: ankylosing spondylitis; axSpA: axial spondyloarthritis; PPV: positive predictive value.
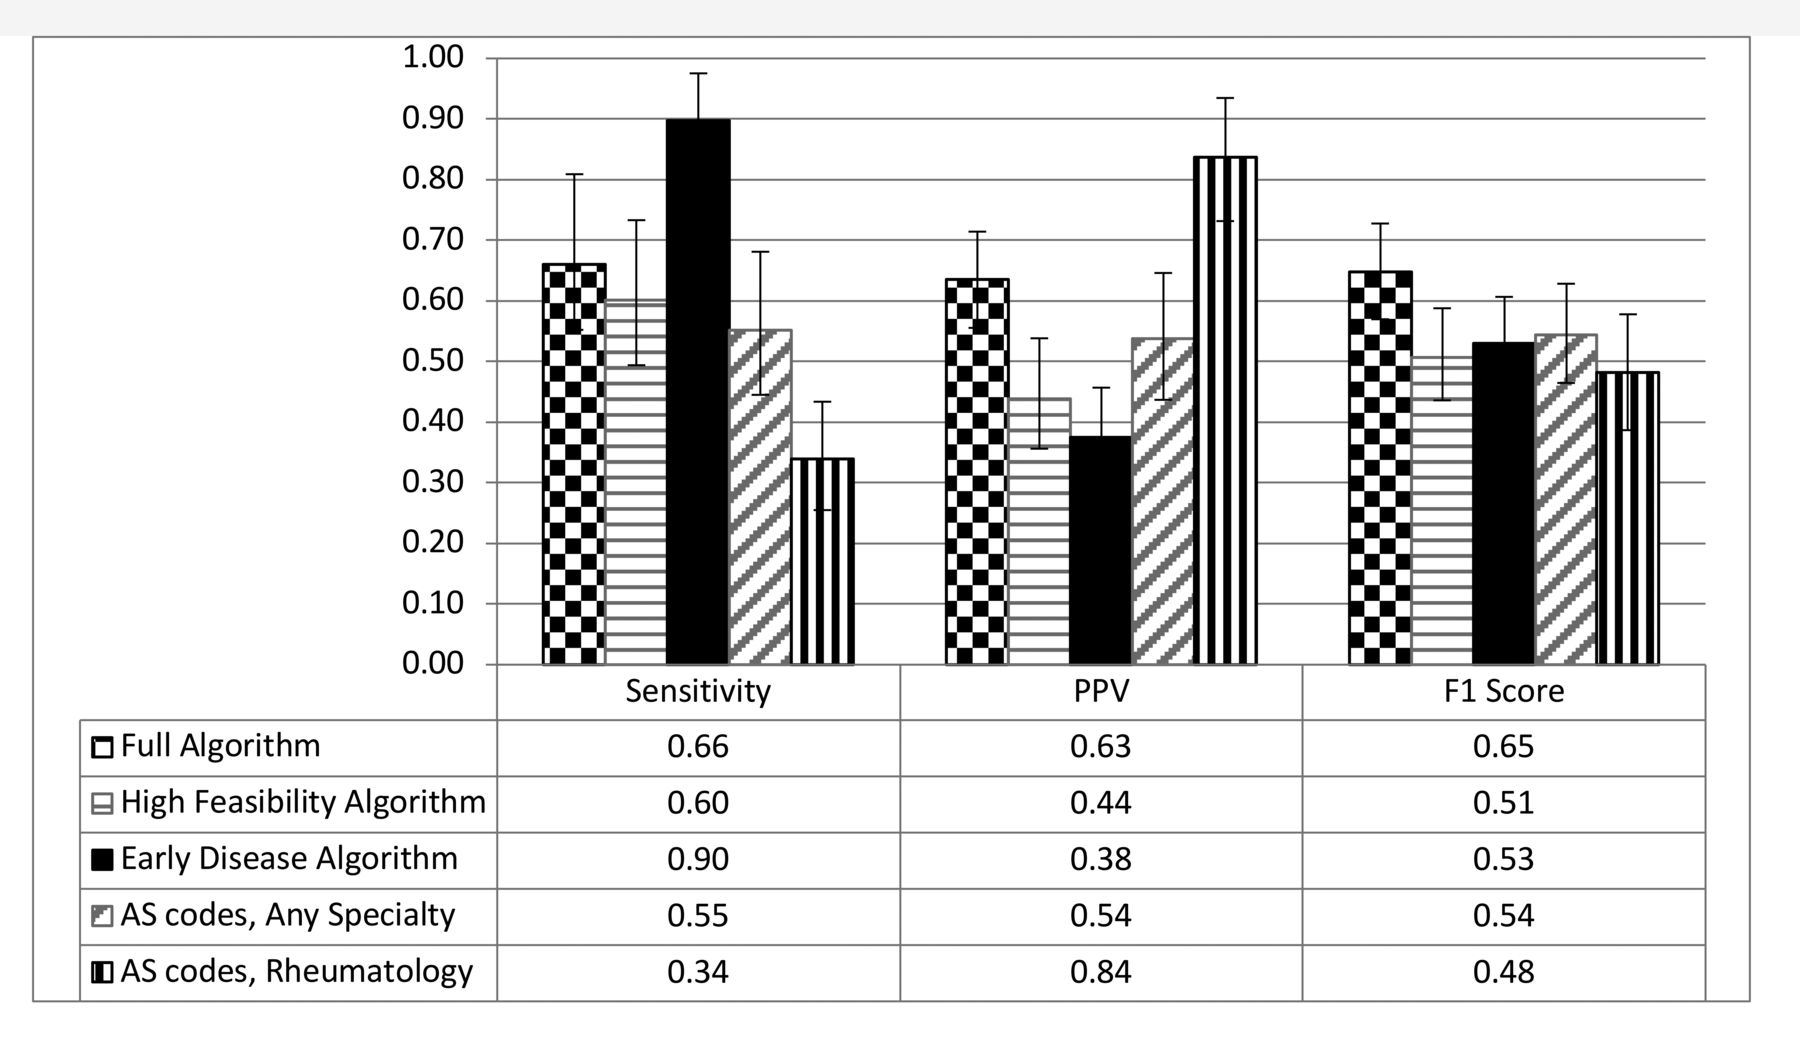
Performance estimates of identification methods for the general veteran population, as measured with inverse probability weighted sensitivity, PPV, and F1 scores. AS: ankylosing spondylitis; PPV: positive predictive value.
DISCUSSION
We developed novel methods for identifying axSpA patients in national VHA datasets. Previous validation work with axSpA identification algorithms demonstrated excellent performance in axSpA-enriched populations18,19. This study is important for understanding how the algorithms are estimated to perform in the general veteran population with future studies. The differences in baseline population characteristics (axSpA-enriched vs general VHA) and outcomes (unweighted vs IPW) demonstrate the need to account for verification bias that can occur when the reference population differs from the target population. We addressed verification bias with IPW and found lower algorithm performance estimates with IPW outcomes than unweighted outcomes. While the unweighted outcomes reflect algorithm performance in the axSpA-enriched population (reference population), the IPW outcomes reflect algorithm performance in the general VA population (target population).
The 5 axSpA identification methods evaluated with IPW for use in the general VA population demonstrate various performance attributes. While there is no consensus on optimal methods for axSpA cohort identification, the use of ≥ 2 AS diagnosis codes from any specialty is commonly used14,15,31,32. This method has the advantages of being simple and inclusive of patients who may not be attending rheumatology clinics. However, our data suggest that the performance of this method is suboptimal for the general VA population; the 55% sensitivity demonstrated that approximately one-half of axSpA veterans remained unidentified by this method, and the 54% PPV demonstrated that approximately one-half of veterans identified by this method did not have axSpA. A higher PPV (66%) was reported in 102 chart-reviewed patients in a Kaiser Permanente study, but sensitivity could not be determined, since patients without AS diagnosis codes were not reviewed15.
The highest PPV (84%) occurred with the other traditional method evaluated in this study (≥ 2 AS diagnosis codes from a rheumatology clinic). This PPV was in the range of other studies reporting a PPV of 81%29 and 100%33. The sensitivity estimate, available in the latter study, was higher than in our study (82% vs 34%, respectively). This difference was likely due to the inclusion of all axSpA phenotypes in our study vs only patients classified as AS in the previous study. The method using ≥ 2 AS codes from rheumatology may be appropriate for studies for which a high confidence in axSpA diagnosis is prioritized over inclusivity of diverse axSpA patients. An example of such a study may involve comparing outcomes in axSpA vs mechanical back pain patients.
In contrast to the method requiring AS diagnosis codes from rheumatology, the Early Algorithm had a high sensitivity (90%) and lower PPV (38%). This was expected since the Early Algorithm was designed to enhance identification of patients with early disease and less classic phenotypes. This identification method is unique in that neither SpA diagnosis codes nor rheumatology encounters are considered in the determination of axSpA risk. The Early Algorithm may be particularly useful for screening studies designed to identify undiagnosed or untreated axSpA patients.
The Full Algorithm had the numerically highest overall performance (F1 scores: 0.65 vs 0.48–0.54). This was expected since the Full Algorithm included the largest number of variables. The Full Algorithm may be considered the best method for studies in which sensitivity and PPV are equally prioritized.
The High Feasibility Algorithm was designed to be less resource-intensive than the Full Algorithm and more accurate than traditional axSpA identification methods. Unfortunately, the High Feasibility Algorithm did not perform better than traditional methods. Since the High Feasibility Algorithm is more resource intensive than the traditional methods, it is unlikely to be used for axSpA identification in large datasets.
Strengths of this study include the development of a method for identifying axSpA patients who are at high risk for being missed with alternative identification methods. In particular, the Early Algorithm does not consider SpA diagnosis codes or rheumatology visits when calculating axSpA risk for classification assignments. Thus, this method may enable previously impractical research in patients with early disease or less classic phenotypes. Other strengths include extensively studied methodology for the algorithm development, including deep evaluations of NLP model performance, comparisons of different methods for algorithm development (e.g., random forest vs lasso vs K-nearest neighbor, vs a combination of these methods called SuperLearner), and well-characterized chart review processes completed by rheumatologists specializing in axSpA18,21,26. The methods developed with this research will enable further refinement of the algorithms (i.e., additional NLP variables) and identification of patients at high risk of undiagnosed or unaddressed axSpA who may be recommended for a rheumatologic evaluation.
In summary, there are important unmet needs for better axSpA identification methods for real-world research across the broad spectrum of axSpA patients. There are growing opportunities to advance observational research with large data resources and bioinformatics advancements. This study demonstrates that these resources can be successfully used to improve research methods in axSpA. Further, the novel identification algorithms evaluated in this study may expand the scope of observational research in diverse axSpA populations.
Footnotes
The authors declare no conflicts of interest.
Full Release Article. For details see Reprints and Permissions at jrheum.org.
This study was supported by the Marriott Daughters Foundation and Rheumatology Research Foundation.
- Accepted for publication August 13, 2020.
- Copyright © 2021 by the Journal of Rheumatology


