

Abstract
Objective To estimate the prevalence of rheumatoid arthritis (RA) from international population-based studies and investigate the influence of prevalence definition, data sources, classification criteria, and geographical area on RA prevalence.
Methods A search of ProQuest, MEDLINE, Web of Science, and EMBASE was undertaken to identify population-based studies investigating RA prevalence between 1980 and 2019. Studies were reviewed using the Joanna Briggs Institute approach for the systematic review and Preferred Reporting Items for Systematic Reviews and Meta-Analyses guidelines.
Results Sixty studies met the inclusion criteria. There was a wide range of point prevalence reported (0.00–2.70%) with a mean of 0.56% (SD 0.51) between 1986 and 2014, and a mean period prevalence of 0.51% (SD 0.35) between 1955 and 2015. RA point and period prevalence was higher in urban settings (0.69% vs 0.48%) than in rural settings (0.54% vs 0.25%). An RA diagnosis validated by rheumatologists yielded the highest period prevalence of RA and was observed in linked databases (0.80%, SD 0.1).
Conclusion The literature reports a wide range of point and period prevalence based on population and method of data collection, but average point and period prevalence of RA were 51 in 10,000 and 56 in 10,000, respectively. Higher urban vs rural prevalence may be biased due to poor case findings in areas with less healthcare or differences in risk environment. The population database studies were more consistent than sampling studies, and linked databases in different continents appeared to provide a consistent estimate of RA period prevalence, confirming the high value of rheumatologist diagnosis as classification criteria.
Rheumatoid arthritis (RA) is a heterogeneous disease with partially unknown etiology1,2. The reported worldwide RA prevalence varies widely, and it is unclear whether this is due to inconsistencies in defining populations; methodologies used to identify patients with RA including data sources, sample sizes, and variation in date or data collection; or the employed RA classification criteria2. Alternatively, this may be a true reflection of the effect of different risk factors over time and across jurisdictions, including age, sex, socioeconomic differences, ethnogenetic differences, or exposure to other risk factors (i.e., oral contraceptives, infectious triggers, and smoking) for the development of autoimmune-mediated disease such as RA2,3.
Hence, it will be clinically useful to investigate the prevalence of RA at the national and international levels to shed further light on possible genetic and environmental factors that would potentially improve our knowledge about the etiology of the disease4.
A systematic review of RA prevalence data could assist in such planning5 as well as in decision making regarding the most efficient use of available resources6. Two systematic reviews have examined the prevalence of RA in the last 3 decades7,8. The Alamanos, et al7 study was limited by the selection of studies based on the American Rheumatism Association (ARA) 1987 revised classification criteria only, whereas Rudan, et al8 investigated the regional RA prevalence in studies from low- to middle-income countries published between 2000 and 2010. However, to our best knowledge, there have not yet been any systematic reviews or metaanalyses based on published population-based studies or those that have investigated the influence of prevalence methodology on estimates of RA prevalence.
Our review aimed to describe the international point and period prevalence of RA based on currently published population-based study estimates and to describe the implications of using different data sources, RA classification criteria, and geographical population settings to estimate the prevalence of RA.
MATERIALS AND METHODS
Study design. A systematic literature review was performed using the Joanna Briggs Institute guidelines for conducting a systematic review of prevalence data5 and Preferred Reporting Items for Systematic Reviews and Meta-Analyses (PRISMA)9. A list of key terminology, corresponding definitions, and PRISMA checklist can be found in Supplementary Data 1 and Supplementary Table 1 (available with the online version of this article).
Study selection. Studies published between January 1, 1980, and June 26, 2019, were included in our search. The time frame was chosen to estimate and account for changes in trends in reporting prevalence data due to major revisions of RA classification criteria that have affected the reported incidence and prevalence10,11.
Inclusion criteria. We included case-control studies, cross-sectional studies, and prospective or retrospective cohort studies in our search strategy. Studies were included if their participants (1) were representative of the adult populations based on country reference populations using the World Health Organization Global Health Observatory12 and the United Nations data repositories13; (2) had clinically verified RA or met one of the published RA classification sets; (3) were residents in a defined country; or (d) lived in defined geographic population settings.
Exclusion criteria. We excluded studies that (1) had participants aged < 16 years; (2) only presented prevalence estimates based on subsets of populations or communities by age range, sex, or ethnicity; (3) had fewer than 300 participants; (4) were volunteer participants or participants with self-reported RA diagnosis without clinical confirmation; (5) comprised RA prevalence studies from outpatient clinics, residential homes, or hospitals; (6) were published in a language other than English; (7) comprised nonresearch papers including letters and editorials, narratives, systematic and seminar reviews, case studies, or series reporting cases or abstracts; or (8) included capture-recapture studies or disease model studies.
Search strategy. A literature search was conducted by the first author (KM) according to the PRISMA 2009 recommendations to locate studies in relevant databases, including ProQuest, MEDLINE (Ovid), Web of Science, and EMBASE (Ovid). The results of each search were loaded into EndNote Volume X.8 (Clarivate Analytics). MeSH and keywords were used in the search machines and were reviewed between first author, senior supervising author (CAI), and senior librarian (SB). Different keywords were chosen, and the search was conducted using “AND” and “OR” in the search section of the databases (Table 1; Supplementary Data 2, Supplementary Table 2, available with the online version of this article). Reference lists from retrieved studies were used to identify more studies and were selected based on the systematic review inclusion criteria.
Keywords used to identify relevant studies
Risk of bias assessment and data extraction. The research articles selected for systematic review were evaluated using the Hoy, et al tool for risk of bias in prevalence studies14. The details of the risk bias assessment method and data extraction are presented in Supplementary Data 3 and Supplementary Table 3 (available with the online version of this article).
Selection measure. We reported the studies that provided adequate information to calculate point and/or period prevalence for RA. We also assumed the prevalence rate of RA to be constant over the study period. In addition, report studies that included a description of secondary outcomes, including the type of prevalence method used, RA classification criteria, types of data sources, and geographic population settings, were included.
Data synthesis. We calculated prevalence by dividing the number of RA cases by the total number of participants, which was then expressed as a percentage. Data analysis included a comparison of the prevalence of RA between countries and continents. In this study, we applied descriptive statistical analysis using the Statistical Package for the Social Sciences (Version 25, SPSS Inc.) for the analyses.
Ethics. This systematic review relies solely on data obtained from published research literature and therefore obtaining institutional ethical approval was not required.
RESULTS
Search results. Our keyword-based search yielded a total of 1821 citations (Figure 1) from ProQuest (n = 650), Medline (n = 588), Web of Science (n = 468), and EMBASE (n = 115). After reviewing the title and abstract and removing duplicates, 143 studies remained for further evaluation. Of these, 86 articles were excluded due to discordance with the inclusion criteria (Supplementary Data 4, available with the online version of this article), resulting in 57 studies included for the full review. In addition, 20 records were included by manual research references from all accepted studies, and only 3 studies from these met the inclusion criteria. The final selection for the prevalence of RA consisted of 60 population-based studies. Six of these studies had multiple cohorts, and each cohort was recognized separately during analysis (Supplementary Table 4). The total number of cohort studies analyzed was 67.
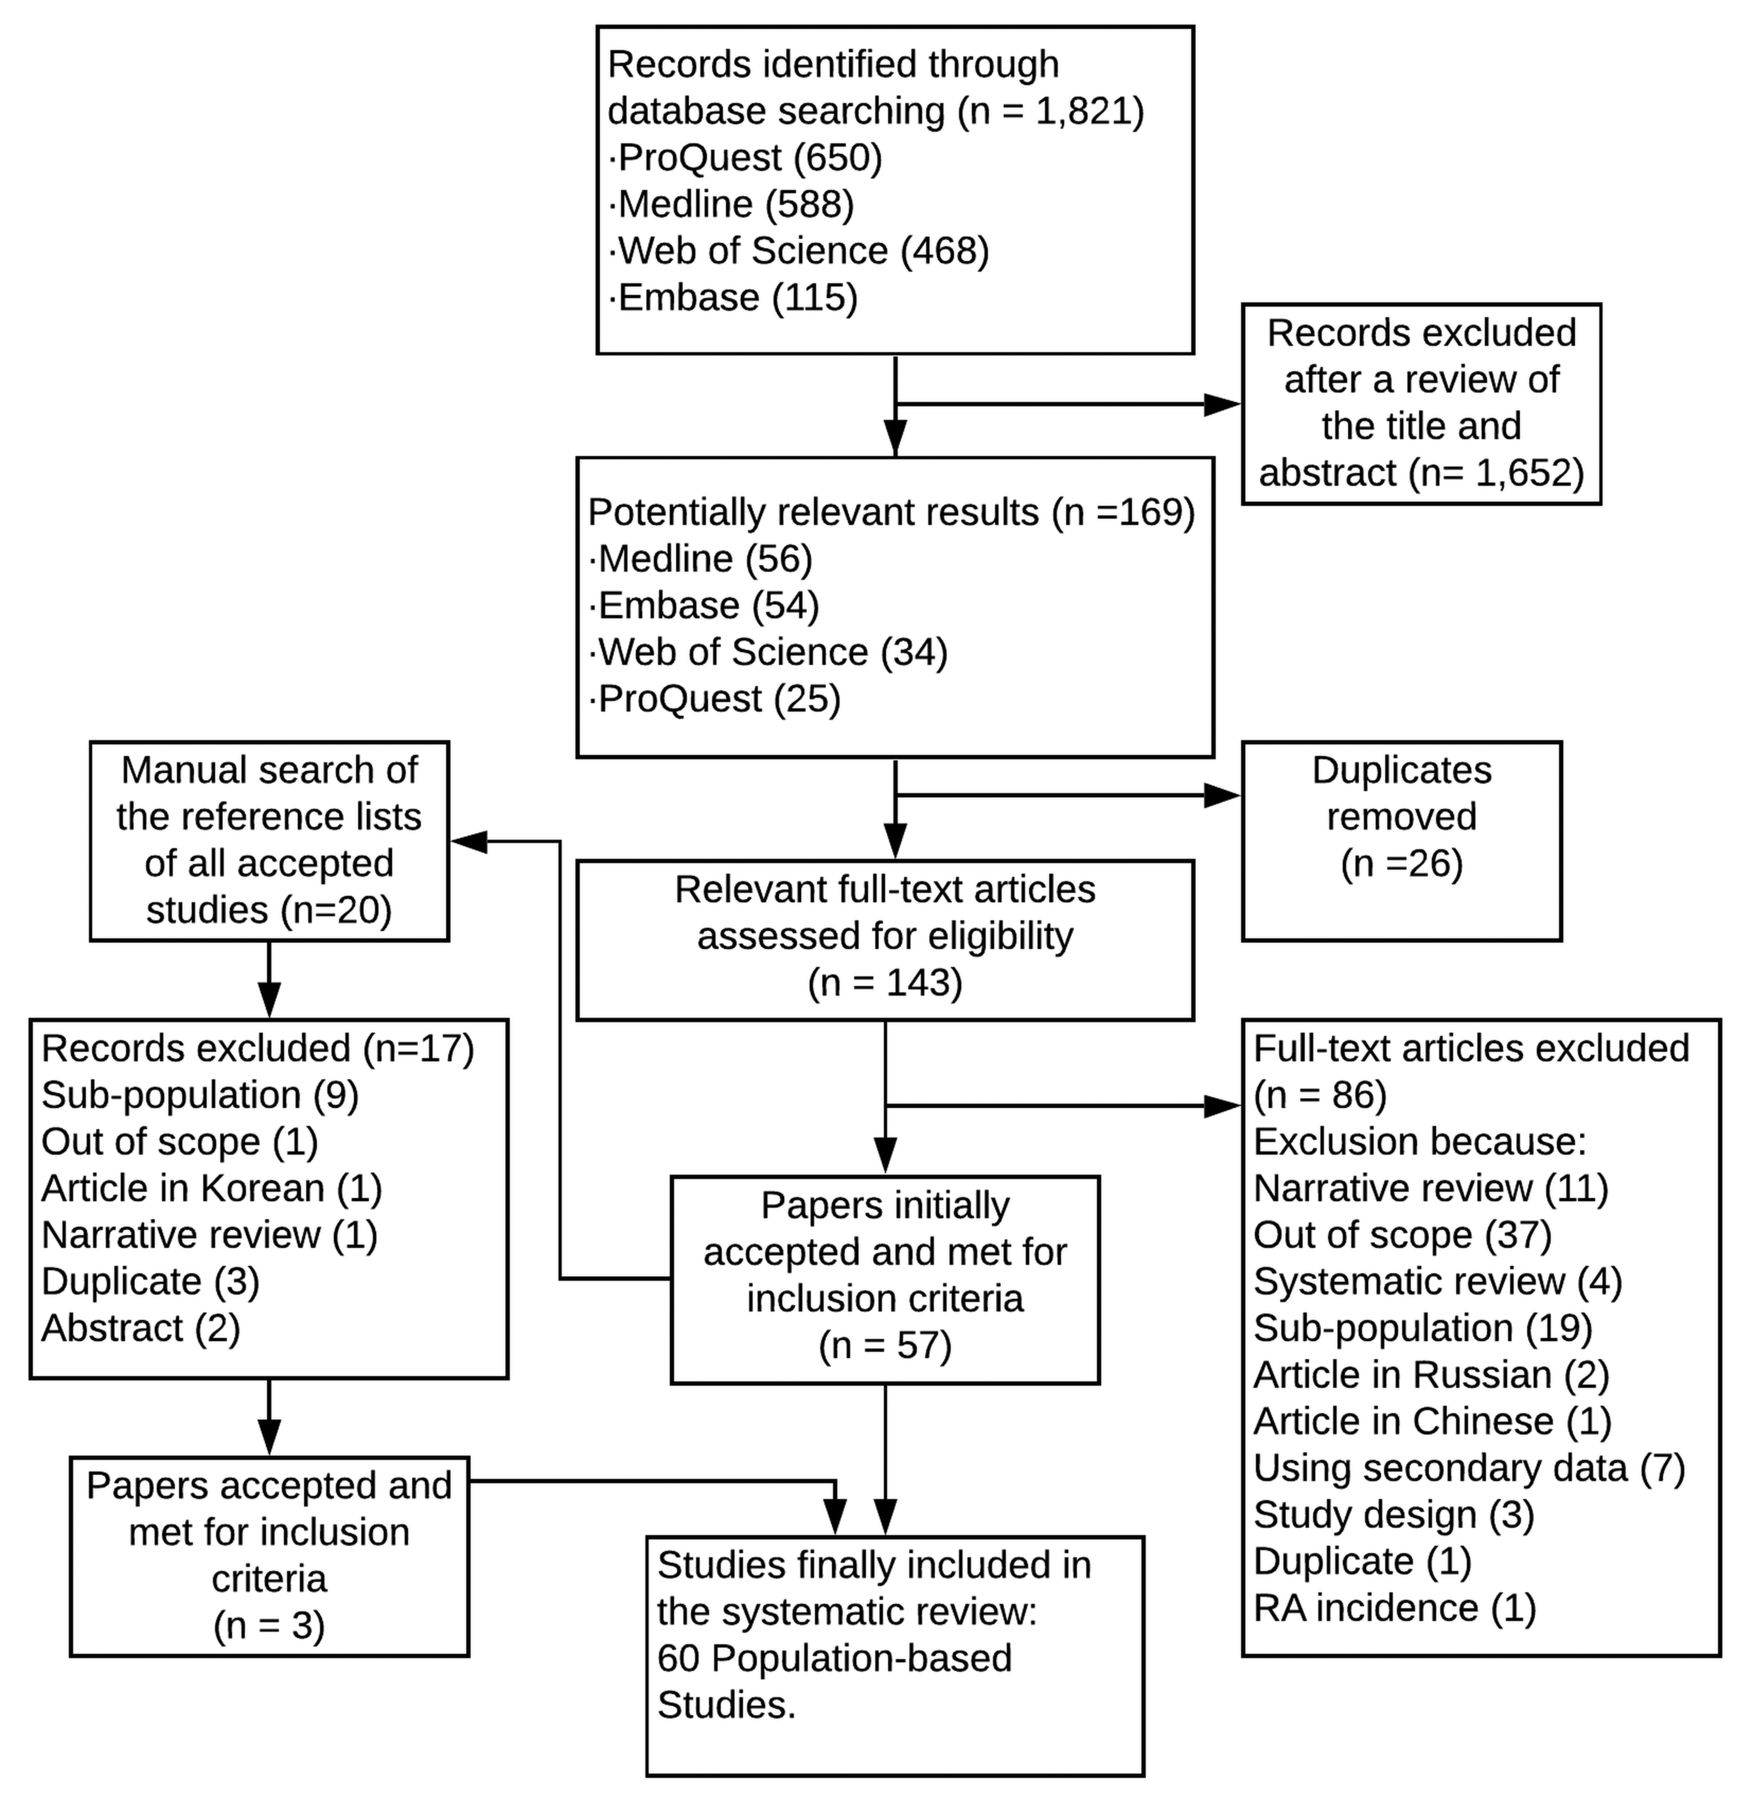
PRISMA flow diagram for prevalence studies of rheumatoid arthritis. PRISMA: Preferred Reporting Items for Systematic Reviews and Meta-Analyses.
Characteristics of the population-based studies. The 60 population-based studies were conducted in 41 countries (Supplementary Table 4, available with the online version of this article). Nearly half of the studies were conducted in Europe (n = 25, 41.7%), followed by Asia (n = 22, 36.7%), and North America (n = 8, 13.3%). Three studies (5.0%) were conducted in Africa, and 2 (3.3%) were conducted in South America. No studies meeting the inclusion criteria were identified from Oceania.
Risk of bias assessment. The risk of bias assessment of the included published studies was low in 53 studies (88.3%) and moderate in 7 studies (11.7%), and there was no high risk of bias across studies (Supplementary Table 5, included with the online version of this article).
The study participants. Our study had 212,335,171 total participants in 67 cohorts. A total of 49 (73.1%) cohort studies were based on cumulative population sampling with an overall total of 221,329 participants, ranging from 300 to 26,709 people (mean 4517, SD 4422). In the remaining 18 (26.9%) studies, the RA prevalence was estimated based on larger population database studies, including 212,113,842 total participants, ranging from 18,300 to 49.4 million people (Supplementary Table 6).
Prevalence methods. The point-prevalence method was reported in 32 cohort studies (47.8%) and the period-prevalence method was reported in 35 cohort studies (52.2%; Table 2).
Overall mean of the continental prevalence of RA.
The point-prevalence method was more common among sampling population cohort studies, whereas period prevalence was more common among larger population database cohort studies (Supplementary Table 7, available with the online version of this article).
Data sources. The population-based survey (PBSU) was the most frequently used data source (n = 46, 68.6%), with administrative data in 14 cohort studies (20.9%). Register and linked data were used in 3 (4.5%) and 4 cohort studies (6%), respectively.
Classification criteria. The most common diagnostic RA classification criteria were the ARA 1987 revised criteria15 (n = 37, 55.2%), followed by verified clinical diagnosis by a doctor (n = 19, 28.4%), and then the ARA 1987 modified criteria16 (n = 7, 10.4%). Two studies used the ARA 1987 modified criteria as a reference in parallel with the ARA 1956 criteria17, Rome 1961 criteria18, and the ARA 1987 revised criteria19,20. Both studies’ results identified more RA patients using the ARA 1987 modified criteria compared with other existing criteria. The potential disadvantage of the ARA 1956 criteria was that it included patients with osteoarthritis, whereas the 1961 Rome criteria and ARA 1987 revised criteria failed to recognize cases of mild RA. The ARA 1956 criteria17 were used in 3 cohort studies (4.5%)21,22, and the Rome 1961 criteria18 were used in 1 study (1.5%)23. Although 21 cohort studies were reported after the American College of Rheumatology (ACR)/European Alliance of Associations for Rheumatology (EULAR) 2010 criteria11 were published, none used these criteria. The continent-specific estimates for studies were estimated in this review using the most common classification criteria (Table 3).
Overall mean of the continental point and period prevalence of rheumatoid arthritis using different classification criteria.
Geographic population settings. Most studies were performed in a mixed (urban and rural) setting (n = 30, 44.8%), whereas studies restricted to urban settings (n = 25, 37.3%) were more frequent than rural studies (n = 12, 17.9%). In Europe, the most commonly reported environmental area was a mixed setting (n = 19, 73.1%), with remaining cohort studies conducted in urban areas (n = 6, 23.1%) and a rural area (n = 1, 3.8%). In contrast, in Asia, mixed settings were less reported (n = 7, 26.9%) than urban areas (n = 11, 42.3%) and rural areas (n = 8, 30.8%).
Synthesis of results. There was a high level of heterogeneity (I2 = 99.9%) between included studies, due to differences in data sources, diagnostic criteria, region, and geographic settings. The review findings are categorized and presented as a narrative synthesis on different sources, methodology, and populations, highlighting the potential factors that may affect the RA prevalence estimates.
Review findings.
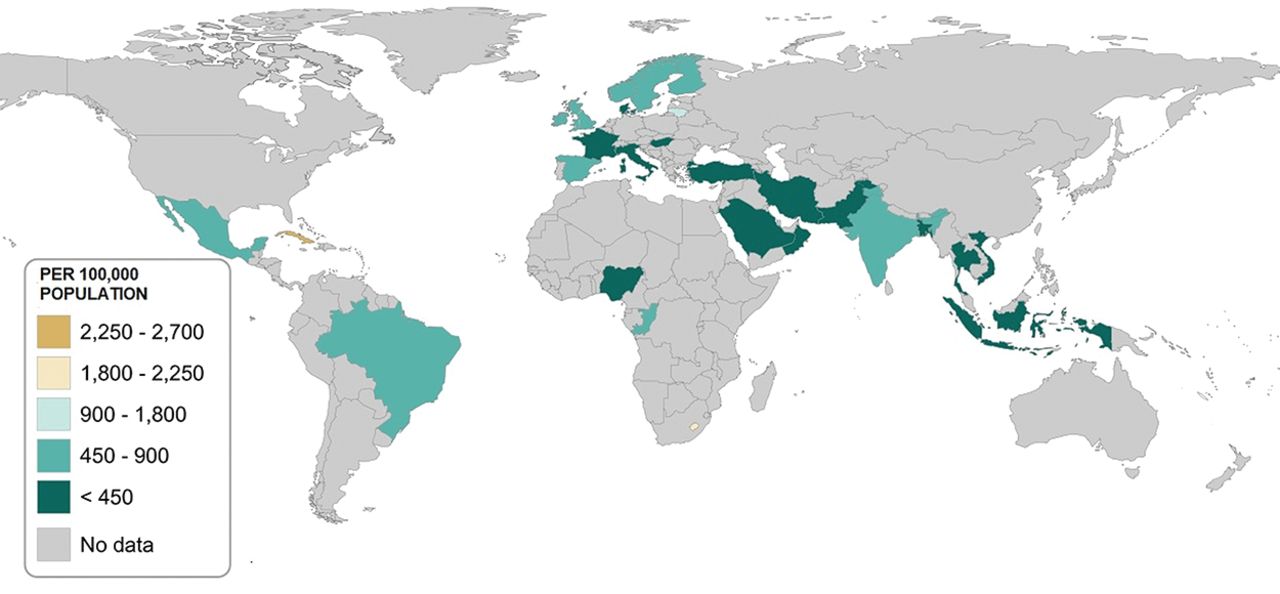
Point prevalence estimates of RA. The mean point prevalence of RA was 0.56% (SD 0.51), ranging from 0% to 2.70% based on studies from various countries between 1986 and 2014 (Figure 2; Supplementary Table 8, available with the online version of this article). The highest reported mean point prevalence was in North America (1.46%), followed by Africa (0.80%), Europe (0.53%), South America (0.46%), and Asia (0.34%). Country-specific point prevalence was highest in Cuba (2.70%), followed by Lesotho (1.80%), and Lithuania (0.92%). The lowest point prevalence was seen in Nigeria (0.00%), followed by Thailand (0.12%) and Iran (0.19%).
Figure 2.Adult point prevalence of rheumatoid arthritis (1986–2014).
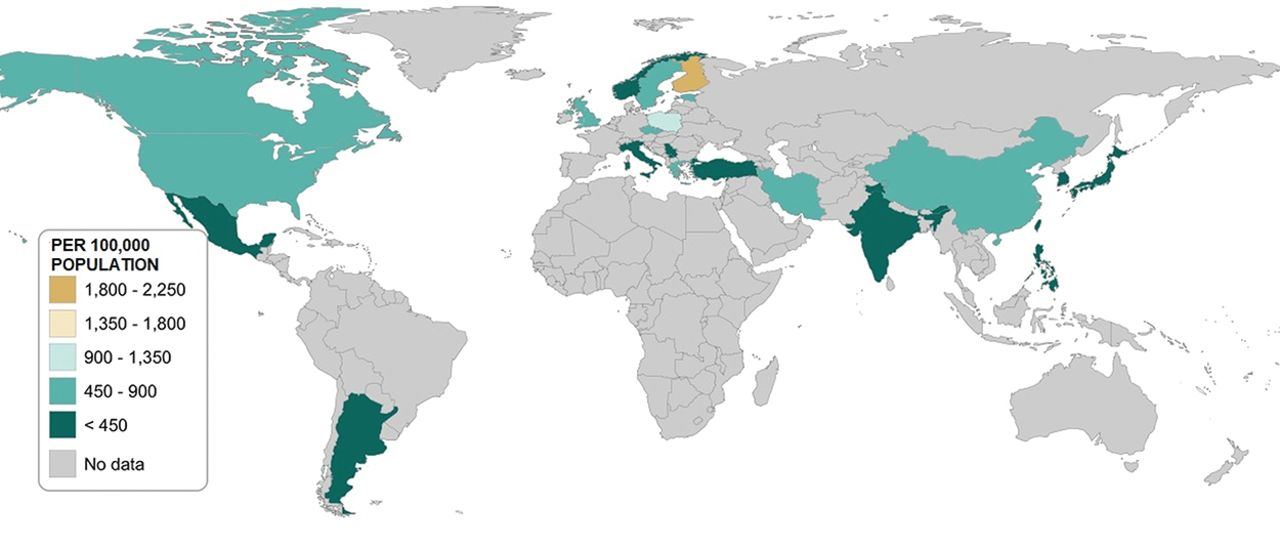
Period prevalence estimates of RA. The mean period prevalence of RA was 0.51% (SD 0.35), ranging from 0.05% to 1.90%, across countries between 1955 and 2015 (Figure 3; Supplementary Table 9, available with the online version of this article). The highest mean period prevalence was reported in North America (0.69%), followed by Europe (0.60%), Asia (0.34%), and South America (0.19%). Country-specific period prevalence estimates were highest in Finland (1.90%), followed by Lebanon (1.00%), and Poland (0.90%), while the lowest period prevalence was reported in Taiwan (0.09%), the Philippines (0.17%), and Yugoslavia (0.18%).
Figure 3.Adult period prevalence of rheumatoid arthritis (1955–2015).
Population sampling methodology. The highest point and period prevalence in sampling population studies were 2.70% and 1.90%, respectively. In contrast, the highest point and period prevalence based on the larger population databases studies were 0.80% and 0.90%, respectively. The mean point and period prevalence, based on sampling population studies were 0.56% and 0.57%, respectively. In contrast, the mean point and period prevalence, based on the population database studies, were 0.60% and 0.44%, respectively.
Data sources. The PBSU was used most frequently for both point and period prevalence studies (Supplementary Tables 10 and 11, available with the online version of this article). The highest mean point prevalence of RA, using administrative data (0.8%), was reported from Finland24. The highest mean period prevalence of RA (0.8%, SD 0.1) was reported in 3 cohort studies using linked data, with 2 conducted in Canada25,26 and 1 conducted in Sweden27, and are linked using rheumatology clinics, emergency departments, and inpatient facilities’ datasets. The mean point prevalence of RA (0.8%) was higher than the mean period prevalence when using administrative data (mean 0.40%, SD 0.28). The lowest mean period prevalence of RA among data sources was in administrative data.
RA classification criteria. The ARA 1987 revised criteria were usually applied in both point and period prevalence studies; the mean point and period prevalence were 0.61% and 0.42%, respectively. The highest point prevalence of RA was observed for ARA 1956 criteria (0.76%) based on 3 cohort studies: 1 conducted in Lesotho21 and 2 in urban and rural areas of Indonesia22. In contrast, the highest period prevalence of RA was observed when doctors verified the clinical diagnosis (0.65%).
Geographic settings. Urban and mixed populations were commonly surveyed in point and period prevalence studies rather than rural populations. The point prevalence of RA was higher in urban settings (0.69%) than rural (0.54%) and mixed areas (0.45%), and when incorporating geography, the point prevalence was highest in urban areas of North America (1.80%; Cuba and Mexico), while the lowest point prevalence was observed in the mixed populations of Asia (Saudi Arabia [0.22%] and Oman [0.36%]).
The period prevalence of RA was higher in mixed populations (0.57%) than urban (0.48%) and rural areas (0.25%), with the highest period prevalence in the urban areas of North America (0.92%), namely Canada (0.90% and 0.80%) and the USA (1.07%), whereas the lowest (0.22%) was reported in an urban area of South America, namely Argentina (0.19%).
DISCUSSION
The worldwide average point and period prevalence of RA were 0.51% and 0.56%, respectively, and more than double the overall prevalence (0.24%) reported by Cross, et al28 based on the global estimate of the burden of disease in 2010. Cross, et al used a modeling method to estimate the missing RA prevalence data values for 5 regions, including Oceania, which has led to an underestimation of the true RA prevalence.
The reported RA prevalence was between 1.9% and 2.7% in Australian populations based on PBSU studies without clinical verification29,30. Although the validity of self-reported diagnosis varied between 7% and 96% based on confirmation methods31, Cross, et al estimated an RA prevalence of 0.09% in male and 0.25% in female patients in Oceania, which was 10-times less than the reported RA prevalence in Australia29,30. Moreover, these results were contrary to the highest reported prevalence of RA (6.6%) among Australian populations aged ≥ 75 years29, especially given the sizable ageing population of 4.6 million in Oceania32.
Although the period-prevalence method presumably captures more RA cases than the point-prevalence method, the highest RA prevalence was reported in point-prevalence studies that used sampling population studies. The main limitation of sampling population studies is that they are affected by sampling frame, sampling size, and subjects’ participation33.
A Cuban study34, which reported the highest RA prevalence (2.7%), was potentially confounded by small sample size (n = 300) that may not be representative of the true population because of potential sampling errors34. We speculate that the high prevalence of RA in Cuba may also be confounded by a higher prevalence rate of smoking and tobacco use (36.6%) especially when compared with other Latin American countries such as Argentina (16.7%), Brazil (12.1%), and Mexico (7.7%)35, where smoking is one of the risk factors for developing RA36.
The prevalence rates of RA in a population increase with the age of the participants in that sample37. Absence of RA cases in the Nigerian study38 might have been confounded owing to the different age structure of the selected samples (n = 2000), since 80% of the sample subjects were young adults because of lower life expectancy (45 yrs)39, whereas the highest prevalence of arthritis was reported in the age group of 60–69 years37.
The lowest period prevalence was observed in larger population database studies. An underestimation of the prevalence of rheumatic diseases was observed in population database studies with the prevalence estimate variations being related to the length of the observation period and data source accuracy40. Ng, et al reported this phenomenon as an administration data limitation to presenting true prevalence for rare diseases41.
Although the PBSU was the more common data collection method using the point-prevalence method in included studies, most administrative data studies used the period-prevalence method to estimate RA prevalence. Different data sources were categorized to enable comparisons between their abilities to estimate RA prevalence as well as their effect on the mean point and period prevalence of RA. The higher mean and lowest SD of period prevalence estimates in the studies using linked data suggest that they are superior to other data sources in capturing cases of RA over time. This may be because of RA diagnoses being confirmed by rheumatologists and multiple sources of case ascertainment from different healthcare settings. Therefore, linked data is the preferred data source to estimate RA prevalence with improved case ascertainment, as RA is challenging to diagnose and classify over time without expert opinion.
In the absence of a gold standard for the diagnosis of RA, various RA classification criteria have been developed over time whereby doctor diagnoses or expert opinions were often used as the preferred diagnostic approach42. However, these classification criteria do not cover the full spectrum of disease in RA and other rheumatic diseases, and doctor diagnosis is heavily influenced by training, experience, and preferences43.
Based on clinical diagnosis, the mean period prevalence of RA was 0.65% vs a mean point prevalence of 0.39%. Moreover, there is a significant discrepancy in the identification of RA between primary care physicians and rheumatologists. In the Della Rossa, et al 2010 study, the pattern of RA diagnosis among primary care physicians showed less reliability (69%) than RA cases that were confirmed later by rheumatologists, with a high degree of heterogeneity44.
The absence of RA in Nigeria38 may reflect the rheumatologist-to-population ratio of 0.012:100,000, resulting in an absence of diagnosis rather than an absence of disease45. The sample of the Nigerian study was screened by medical students in 1993 rather than trained professionals38. Although there were no diagnosed RA cases, there were 3 inflammatory polyarthritis cases in the cohort with 1 meeting the ARA 1987 revised criteria.
The effect of the ARA 1956 criteria on estimated point-prevalence rates was detected in our study, which indicates that the ARA 1956 criteria have low sensitivity to missing inactive RA10. Further, the specificity for detection of active RA cases was low and included patients with joint inflammation, which means that osteoarthritis cases, too, met the ARA 1956 criteria because of its poor specificity20. Two studies used the ARA 1987 modified criteria in parallel with ARA 1987 revised criteria19,20. The results illustrate the enhanced sensitivity of ARA 1987 modified criteria compared with ARA 1956 criteria, Rome 1961 criteria, and ARA 1987 revised criteria. There were revisions to RA classification criteria over time, but the latest ACR/EULAR 2010 criteria still have not been used to estimate RA prevalence to date. An important characteristic of the ACR/EULAR 2010 criteria over previous criteria is the inclusion of anticitrullinated protein antibodies and the exclusion item, “no better alternative diagnosis”; this has improved the diagnostic accuracy of classification criteria46,47. However, there are no data to confirm or refute this assumption at this stage.
In Saraux, et al’s study47, although agreement between all RA classification criteria was poor (κ 0.09–0.43), rheumatologist diagnosis with > 50% certainty after 2 years of follow-up agreed with ACR/EULAR 2010 criteria, confirming the high value of rheumatologist diagnosis as classification criteria47, which is consistent with our review findings.
The point and period prevalence of RA in urban settings were higher than in rural areas. The reason for lower rural prevalence is unclear and may be multifactorial and reflect socioeconomic differences, lifestyle, and environmental risk associated with urban living, or simply patient migration to be closer to healthcare.
To the best of our knowledge, this is the first systematic review summarizing available published peer-reviewed population-based studies on the prevalence of RA. We used both point and period prevalence and assessed methodology based on multiple data sources, RA classification criteria, and geographical settings, which strengthens our review. Moreover, we applied stringent inclusion criteria and clear definitions with robust assessment for bias and heterogeneity.
Limitations of our review include the small sample sizes in some studies. Further, the nonrepresentation from the Oceania region may interfere with generalizability in this region. The continental data also may be biased due to the dominance of studies from Europe and Asia and the limited studies from Africa and South America. Our study findings do not permit any causal interpretations due to measurement variability.
The average point and period prevalence of RA were 51 in 10,000 and 56 in 10,000, respectively. Variation occurred in RA point and period prevalence across countries and continents due to different methodological approaches and possibly different genetic and environmental risk factors. The RA prevalence in urban areas was higher than in rural areas, suggesting environmental factors may be important in the development of RA. The mean RA period prevalence was more consistent in population database studies than in sampling population studies. Linked databases appear to provide the best estimate of RA period prevalence using multiple sources of case ascertainment, especially when rheumatologists confirm RA clinical diagnosis.
ACKNOWLEDGMENT
We acknowledge senior librarian Samantha Blake (SB) for her help within the scope of UWA library support services for systematic reviewers.
Footnotes
The authors have declared no conflicts of interest.
KM was supported by an Australian Government Research Training Program PhD Scholarship at the University of Western Australia.
- Accepted for publication September 22, 2020.
- Copyright © 2021 by the Journal of Rheumatology


