

Abstract
Objective. We evaluated potential circulating biomarkers of disease activity in giant cell arteritis (GCA), Takayasu arteritis (TA), polyarteritis nodosa (PAN), and eosinophilic granulomatosis with polyangiitis (EGPA).
Methods. A panel of 22 serum proteins was tested in patients enrolled in the Vasculitis Clinical Research Consortium Longitudinal Studies of GCA, TA, PAN, or EGPA. Mixed models were used for most analyses. A J48 classification tree method was used to find the most relevant markers to differentiate between active and inactive GCA.
Results. Tests were done on 418 samples from 152 patients (60 GCA, 29 TA, 26 PAN, 37 EGPA), during both active vasculitis and remission. In GCA, these showed significant (p < 0.05) differences between disease states: B cell–attracting chemokine 1 (BCA)-1/CXC motif ligand 13 (CXCL13), erythrocyte sedimentation rate (ESR), interferon-γ—induced protein 10/CXC motif chemokine 10, soluble interleukin 2 receptor α (sIL-2Rα), and tissue inhibitor of metalloproteinase-1 (TIMP-1). In EGPA, these showed significant increases during active disease: granulocyte colony-stimulating factor (G-CSF), granulocyte-macrophage—CSF, interleukin (IL)-6, IL-15, and sIL-2Rα. BCA-1/CXCL13 also showed such increases, but only after adjustment for treatment. In PAN, ESR and matrix metalloprotease (MMP)-3 showed significant differences between disease states. Differences in biomarker levels between diseases were significant for 11 markers and were more striking (all p < 0.01) than differences related to disease activity. A combination of lower values of TIMP-1, IL-6, interferon-γ, and MMP-3 correctly classified 87% of samples with inactive GCA.
Conclusion. We identified novel biomarkers of disease activity in GCA and EGPA. Differences of biomarker levels between diseases, independent of disease activity, were more apparent than differences related to disease activity. Further studies are needed to determine whether these serum proteins have potential for clinical use in distinguishing active disease from remission or in predicting longer-term outcomes.
- VASCULITIS
- BIOMARKERS
- TAKAYASU ARTERITIS
- EOSINOPHILIC GRANULOMATOSIS WITH POLYANGIITIS
- POLYARTERITIS NODOSA
Different forms of vasculitis share the features of inflammation of the blood vessels and damage to blood vessel walls but are otherwise heterogeneous. The clinical heterogeneity is observed between vasculitides, between patients with the same form of vasculitis, and in the same patient along the course of the disease1, making the diagnosis and management of patients with vasculitis challenging2. Although in some patients vasculitis has a monophasic course, many patients achieve remission with substantial immunosuppressive treatment but then relapse, with time to relapse difficult to predict3.
Biomarkers in different forms of vasculitis are needed for diagnosis, including differentiation from infection or other conditions with similar symptoms, staging of organ systems involved, assessment of current disease activity, assessment of risk of relapse, predicting response to a particular treatment, and predicting longterm outcomes. Discovery of biomarkers for diagnosis and staging may best be performed in untreated patients with known diagnoses determined by other means. Longitudinal cohorts are best suited for the other unmet needs. For discovery of biomarkers of current disease activity that may prove useful clinically, it is essential to include patients taking immune-suppressive medications, because this is the group that best matches the challenge in clinical practice.
Circulating proteins are particularly appealing as biomarkers in vasculitis because of their accessibility and potential clinical use, including to avoid the need for biopsy or to provide information not attainable from a biopsy. There have been many studies of biomarkers in the vasculitides as it is recognized that improved tools are needed to identify active disease, predict relapse, and assist with treatment decisions4. Unfortunately, the findings of these studies have been unsatisfactory and there remains a strong need for better biomarkers of disease activity in vasculitis, especially once treatment is started4,5,6,7.
In the present study we aimed to identify circulating proteins that distinguish between active vasculitis and remission in giant cell arteritis (GCA), Takayasu arteritis (TA), polyarteritis nodosa (PAN), and eosinophilic granulomatosis with polyangiitis (EGPA, formerly called Churg-Strauss syndrome). To compare among these diverse diseases, we used the same panel of markers that we previously tested in patients with highly active antineutrophil cytoplasmic antibodies (ANCA)–associated vasculitis (AAV)8. Twenty-two serum proteins linked to possible pathways relevant to vasculitis were measured: angiotensin-converting enzyme (ACE), B cell–attracting chemokine 1 (BCA)-1/CXC motif ligand 13 (CXCL13), granulocyte colony-stimulating factor (G-CSF), granulocyte-macrophage (GM)-CSF, interferon (IFN)-γ, interleukin (IL)-6, IL-8/CXCL8, IL-15, IL-18, IL-18BP, IFN-γ–inducible protein-10/CXC motif chemokine 10 (IP-10/CXCL10), matrix metalloprotease (MMP)-3, neutrophil gelatinase associated lipocalin (NGAL), osteopontin (OPN), plasminogen activator inhibitor (PAI)-1, platelet-derived growth factor (PDGF)-AB, regulated upon activation and normal T cell expressed and secreted (RANTES/CCL5), soluble intercellular adhesion molecule (sICAM)-1, sIL-2Rα, sIL-6R, soluble tumor necrosis factor receptor type II (sTNFRII), and tissue inhibitor of metalloproteinase-1 (TIMP-1). In addition, the clinical markers C-reactive protein (CRP) and erythrocyte sedimentation rate (ESR) were measured. The 22 experimental markers were among 28 originally chosen to reflect a range of disease-related processes different from autoantibody specificity or the liver-derived markers of systemic inflammation, broadly categorized as cytokines, chemokines, soluble receptors, markers of microvascular damage, and markers of tissue damage and repair. The proteins chosen for this study included those that were most strongly associated with active AAV in our previous study8, but OPN, RANTES/CCL5, and sICAM-1 were also retained on the basis of previous studies in GCA9,10,11. Several biomarkers elevated in highly active EGPA have previously been studied in this partially treated cohort5,6. The few biomarkers previously identified as associated with TA or PAN4, and many markers identified as being elevated in untreated GCA12,13, could not be included in this study.
MATERIALS AND METHODS
Patients
Patients with GCA, TA, PAN, and EGPA were enrolled in the Vasculitis Clinical Research Consortium (VCRC) Longitudinal Study from 2006 to 2012. The VCRC is a multicenter research infrastructure dedicated to conducting clinical research in different forms of vasculitis. The 1990 American College of Rheumatology (ACR) classification criteria for the respective diseases were used to classify patients as having either GCA14, TA15, or EGPA16. A modified version of the 1990 ACR classification criteria for PAN was used to classify PAN, because these criteria may fail to differentiate PAN from microscopic polyangiitis (MPA)17 and require disease to affect multiple organ systems.
Clinical data, including measures of disease activity, were collected on a quarterly or annual basis and at times of increased vasculitis activity. Disease duration was defined as time between diagnosis and sample collection.
Patients were chosen for our study because they had a visit during active disease and at least 1 visit during remission. Groups numbering at least 25 patients with each disease were chosen, using samples from patients with the highest recorded physician’s global assessment (PGA). The resulting minimum PGA cutoffs were 4 for GCA, 3 for PAN, and 2 for TA and EGPA. Samples from 2 remission visits were assayed if available and were chosen to include remission visits both before and after the active visit if available.
Circulating markers
The 22 experimental serum proteins were measured using a microarray platform that effectively miniaturizes a capture ELISA, as described8. CRP and ESR were measured at the clinical laboratories of the participating sites.
Statistical methods
Distributions of marker concentrations were inspected to see whether natural-log (ln)-transformation produced distributions closer to normal. As a result, all markers were analyzed after ln-transformation, but some were also analyzed in parallel without transformation because distributions before and after transformation showed similar degrees of skewing. Significance was defined conventionally as p < 0.05, either with or without adjustment for false discovery rate using the Benjamini-Hochberg method18, because power to detect differences is low for cohorts of this size if such adjustment is used.
Mixed effects models were used to compare marker values between active disease and remission while accounting for within-patient repeated measures. Marker concentration was the dependent variable, with disease activity, use of prednisone, and use of other immunosuppressive drugs as dichotomous independent variables, and the patient as the random effect. Analyses were done with and without inclusion of the treatment variables. Data were missing for CRP at 18/418 visits and for ESR at 20/418 visits. There were no missing data for the experimental biomarkers, disease activity, or treatment.
For the primary analysis of assessing association of a marker with active disease, separate analyses were done in GCA, TA, PAN, and EGPA. To determine whether markers differed among diseases, mixed models were used with the specific disease added as an independent categorical variable. Logistic regression was then used with disease activity as the outcome and difference-from-mean as the predictor19. This approach carries the caveat that data from patients with only 1 remission visit had to be excluded. This approach also still includes repeated measures (3 per patient), but probably provides the best estimate of the area under the curve–receiver-operation characteristic (AUC-ROC), commonly used in assessing and comparing predictive models in clinical research. Correlation coefficients (Pearson on ln-transformed data, Spearman on nontransformed data) were calculated to study the association between markers.
In a complementary, exploratory approach that can sometimes be more effective than linear models in using multivariable data to predict a binary outcome, the J48 classification tree method was used to find cutoff points of the most relevant markers to differentiate between active and inactive GCA, using WEKA Data Mining Software20. The number of datapoints was too small to consider this approach in the other diseases. We initially used all markers, allowing for the classifier to choose the ones leading to the most accurate classification. After generating the tree, we performed a 5-fold cross-validation.
Supplementary material regarding patients and statistical methods is available with the online version of this article.
RESULTS
Patients and samples
Our study tested 418 samples from 152 patients (60 GCA, 29 TA, 26 PAN, 37 EGPA). Each patient had samples from 1–2 active visits and 1–3 remission visits (Table 1). Fifty-five of the 60 patients with GCA had the diagnosis confirmed by temporal artery biopsy or angiography. Most patients were receiving treatment at the time of sample collection: 93% GCA, 87% TA, 93% PAN, and 87% EGPA. In most patients, current treatment included prednisone (88% GCA, 71% TA, 83% PAN, 83% EGPA). Data on treatment, separated by disease and by current disease activity, are shown in Supplementary Table 1, available with the online version of this article. In patients with active disease, severity ranged from PGA 1 to 9. Summaries of biomarker concentrations are shown in Table 2.
Characteristics of patients in this study.
Biomarker concentrations in vasculitides during active disease and remission, and in healthy controls.
Biomarkers in GCA and TA
In GCA, the markers BCA-1/CXCL13, ESR, IP-10/CXCL10, soluble interleukin 2 receptor α (sIL-2Rα), and TIMP-1 showed significant (p < 0.05) differences during active disease, with or without adjustment for treatment. Most of these markers were higher during active GCA, but IP-10/CXCL10 decreased. Only ESR remained significantly higher during active disease after adjustment for 24 markers being tested simultaneously (p = 0.0001; Table 3, and Supplementary Table 2, available with the online version of this article). Changes with active disease were modest, with the greatest increases being 22% for G-CSF or 11 mm/h for ESR (Table 3). Results were nearly identical when analysis was limited to the 55 patients in whom the diagnosis of GCA was confirmed by biopsy or angiography (Supplementary Table 3, available with the online version of this article). Using conditional logistic regression (Supplementary Material and Methods), the OR of active disease with a 2.72-fold increase in sIL-2Rα was 1.53 (p = 0.02). Change in sIL-2Rα concentration compared to a patient’s mean during remission had an AUC-ROC of only 0.61 (p = 0.007), and absolute sIL-2Rα concentration in an unadjusted logistic regression had an AUC-ROC of 0.57 (p = 0.03).
Selected analyses of markers showing association with disease activity.
In TA, no markers showed statistically significant differences between active disease and remission. Because of similar pathology in GCA and TA, these patients were pooled as large-vessel vasculitis (LVV) for a secondary analysis. BCA-1/CXCL13, ESR, and GM-CSF were nominally increased (p < 0.05) in active LVV regardless of treatment. IL-18 was only significantly higher in active LVV when treatment was not included in the model. Several markers significantly increased in active GCA alone no longer showed statistically significant increases in pooled LVV (p > 0.05; Table 3; Supplementary Table 2, available with the online version of this article). The magnitude of change was invariably lower in pooled LVV, compared to GCA alone.
Biomarkers in PAN
In PAN, ESR was higher (by only 8–9 mm/h) and MMP-3 lower (by 58–85%) during active PAN, with or without treatment (Table 3; Supplementary Table 2, available with the online version of this article).
Biomarkers in EGPA
In EGPA, the markers G-CSF, GM-CSF, IL-6, IL-15, and sIL-2Rα showed significant increases in active disease with or without adjustment for treatment, and BCA-1/CXCL13 was significantly increased only with adjustment for treatment (Table 3; Supplementary Table 2, available with the online version of this article). Most of these markers were associated with disease activity in either the 18 ANCA-positive patients (BCA-1/CXCL13, sIL-2Rα) or the 19 ANCA-negative patients (G-CSF, GM-CSF), but not both (Supplementary Table 3, available with the online version of this article). The largest magnitude of change was again modest: 2.7-fold for sIL-2Rα in ANCA-negative patients. Using conditional logistic regression, the OR of active disease with a 2.72-fold increase in GM-CSF was 1.76 (p = 0.02). Change in GM-CSF concentration compared to a patient’s mean during remission had an AUC-ROC of only 0.59 (p = 0.04), and absolute GM-CSF concentration in an unadjusted logistic regression had an AUC-ROC of 0.56 (p = 0.11).
Correlations among tested biomarkers
The correlation of ESR or CRP with the experimental markers was weak, no higher than r = 0.25. The markers of systemic inflammation produced by the liver (ESR and CRP) were well-correlated with each other (r = 0.53). Most of the cytokines, chemokines, and soluble receptors (BCA-1/CXCL13, G-CSF, GM-CSF, IFN-γ, IL-6, IL-8, IL-15, IL-18, IL-18BP, IP-10/CXCL10, sIL-2Rα, and sTNFRII) were weakly to moderately correlated (r between 0.25 and 0.50) in all 4 diseases (Supplementary Figure 1, available with the online version of this article), and included all of the markers that were associated with EGPA. Another block lacked a clear inflammatory theme (ACE, OPN, PAI-1, PDGF-AB, RANTES/CCL5, sICAM-1, sIL-6R, and TIMP-1) and had weaker correlations in GCA than in the other diseases. MMP-3 and NGAL did not fall into larger blocks.
There was little if any correlation of biomarker concentrations with age. Among samples taken during remission, correlation coefficients of biomarker concentrations with age varied between r = −0.23 and 0.19. Similarly, there was no apparent correlation, in samples taken during active disease or remission, between biomarker concentrations and disease duration: r = −0.13 to 0.11.
Comparison of biomarkers between diseases
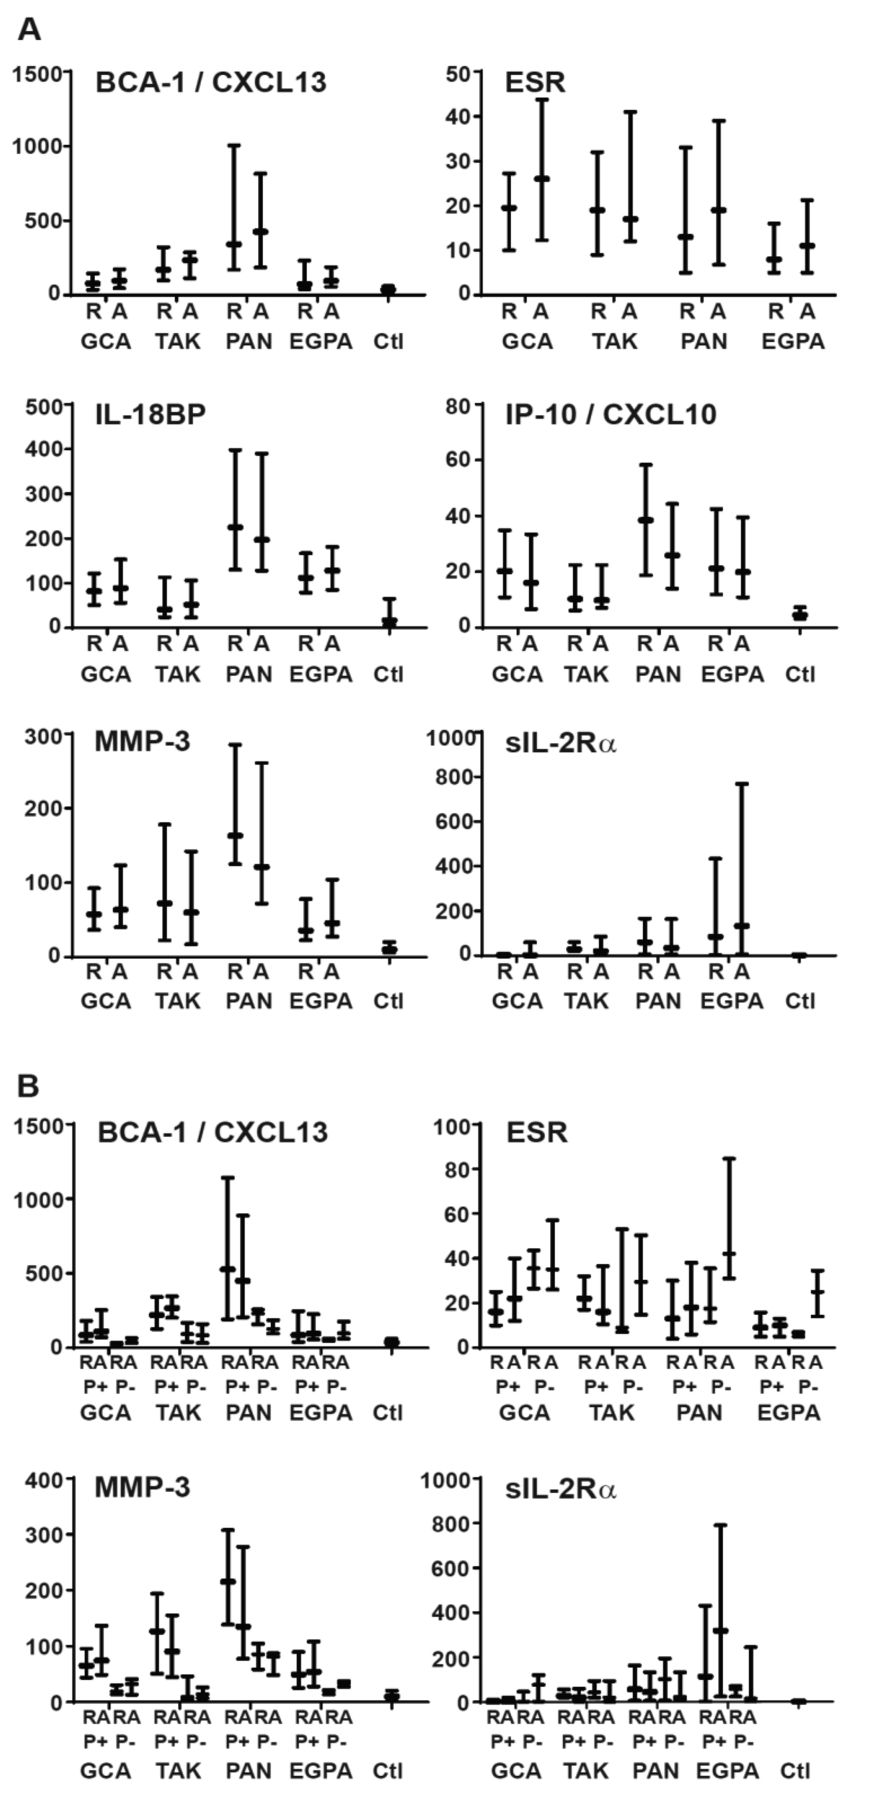
Differences in marker levels between diseases were apparent by inspection and were shown to be significant in mixed models for 11 markers: BCA-1/CXCL13, CRP, ESR, G-CSF, GM-CSF, IL-6, IL-8, IL-18BP, IP-10/CXCL10, MMP-3, and sIL-2Rα (Table 2). Plots of distributions of concentrations of the 6 markers that differed across diseases and differed with disease activity in at least 1 disease (BCA-1/CXCL13, ESR, IL-18BP, IP-10/CXCL10, MMP-3, sIL-2Rα) are shown in Figure 1A.

Selected biomarker concentrations in different forms of vasculitis and in healthy controls (Ctl), separated by disease activity (A) and additionally by use (P+) or non-use (P−) of prednisone (B). Plots show medians and interquartile ranges. Units are mm/h for ESR, ng/ml for MMP-3, and pg/ml for BCA-1, IL-18BP, IP-10, and sIL-2Rα. R: remission; A: active vasculitis; ESR: erythrocyte sedimentation rate; MMP: matrix metalloprotease; BCA-1: B cell–attracting chemokine 1; CXCL13: CXC motif ligand 13; IL: interleukin; IP-10: interferon-γ inducible protein-10; sIL-2Rα: soluble IL-2 receptor α; GCA: giant cell arteritis; TAK: Takayasu arteritis; PAN: polyarteritis nodosa; EGPA: eosinophilic granulomatosis with polyangiitis.
Although association of markers with disease activity did not vary greatly with or without adjustment for treatment, we found that association of marker concentration with prednisone treatment, after adjustment for disease activity, was convincing for 3 markers (BCA-1/CXCL13, ESR, MMP-3), in which p < 0.01 across all diseases and in at least 2 individual diseases. Plots of data separated by disease, activity, and prednisone use are shown in Figure 1B.
Classification tree to differential disease states in GCA
A J48 classification tree to differentiate between active and inactive GCA cases was generated starting with the full list of markers and resulted in the markers shown in Figure 2. TIMP-1 was the most important classifier, because it divided the tree into 2 major branches. A combination of lower values of TIMP-1, IL-6, INF-γ, and MMP-3 was found in 85 of the 104 samples during remission, and overall the tree correctly classified 102/104 (98%) of cases during remission. Different combinations of 8 markers correctly classified patients with active disease, but only in 36/61 (56%) cases. The 5-fold cross-validation results showed only 66% of cases classified correctly: 87% of inactive cases but only 31% of active cases. A J48 classification tree was also built with inclusion of ESR, but the accuracy was lower and complexity higher (data not shown).

J48 classification tree for GCA biomarkers. Starting at the top, each decision node (oval) shows the marker to be used in a classification step. The marker level cutpoint (in mm/h for ESR, pg/ml for the others) is shown at each branch point, with values less than the cutpoint moving a sample to the left and values greater than the cutpoint going to the right. Classification of the sample by the algorithm as active disease (Act) or remission (Rem) is complete when it reaches one of the terminal nodes, shown as rectangles. Numbers in the terminal nodes show the total no. samples classified into the node followed by the number incorrectly classified, if any. For example, in the left-most terminal node, the tree has classified 112 samples sharing the properties of low TIMP-1, low IL-6, low IFN-γ, and low MMP-3 as remission: 85 remission samples classified correctly, and 27 active samples classified incorrectly. Evaluation of the overall tree in classifying remission is determined by adding the numbers of samples correctly classified in Rem terminal nodes (102) and comparing to the number incorrectly classified in Act terminal nodes (2). Conversely, performance in classifying active disease involves comparing the numbers correctly classified in Act terminal nodes (34) to the numbers incorrectly classified in Rem terminal nodes (27). GCA: giant cell arteritis; ESR: erythrocyte sedimentation rate; TIMP-1: tissue inhibitor of metalloproteinase-1; IL: interleukin; IFN: interferon; ACE: angiotensin-converting enzyme; MMP: matrix metalloprotease; NGAL: neutrophil gelatinase-associated lipocalin; TNFRII: tumor necrosis factor receptor type II; GMCSF: granulocyte-macrophage colony-stimulating factor.
DISCUSSION
This study was done to identify potential biomarkers of disease activity identified in GCA, TA, PAN, and EGPA, and to compare biomarkers across diseases. Five markers were associated with GCA and 5 with EGPA, and only sIL-2Rα was associated with both diseases. The magnitudes of marker change with disease activity were small (< 2-fold). Marker concentrations differed more between diseases, independent of apparent clinical activity or concurrent treatment, than they did with level of disease activity longitudinally within each patient.
The only marker associated with disease activity in different types of vasculitis was sIL-2Rα. The IL-2/IL-2Rα (CD25) pathway plays an essential role in regulating immune responses, both positive (activation and replication of effector T cells) and negative (development of Treg cells). The sIL-2Rα can inhibit IL-2 signaling and enhance T cell proliferation and expansion21 and it has been implicated in autoimmune conditions, including multiple sclerosis22, and in macrophage activation syndrome arising from a range of causes23.
The potential markers of active disease in GCA identified in our study include BCA-1/CXCL13, ESR, sIL-2Rα, and TIMP-1, which were increased in active disease, and IP-10/CXCL10, which was decreased. TIMP-1 was also the most important classifier when we used a different analytical approach with a J48 classification tree, which establishes a cutpoint for above versus below. The tree classified samples in remission much better than during active disease: 87% versus 31% in the cross-validation step, an appropriately conservative way to interpret a classification scheme derived from a single dataset. ESR and CRP have both been shown to be associated with active GCA24, and at least 1 of them is elevated in almost all patients with untreated, biopsy-proven GCA25, in line with clinical practice. Because ESR and CRP are widely used clinically in determining disease activity in GCA, they could have biased this study to detect them as significant markers, if the investigator used them to determine whether a confusing clinical situation constituted a flare. To our knowledge, associations of elevated levels of sIL-2Rα and TIMP-1 and decreased levels of IP-10/CXCL10 with active GCA have not been previously reported.
MMP have gelatinolytic activity and some of them have been found to be expressed26 and upregulated27 in GCA lesions, whereas their natural inhibitors TIMP-1 and TIMP-2 are downregulated, yielding an increase in proteolytic balance28. Further, dexamethasone has proven to downregulate several proinflammatory mediators, including TIMP-1 in vitro29. In this context, finding an increase of TIMP-1 in active GCA is surprising. However, it has been recognized that TIMP-1 is a multifunctional protein that is not only an inhibitor of MMP but also has a possible cytokine-like action, as well as growth factor–like and antiapoptotic properties. TIMP-1 expression can be stimulated by a wide variety of agents including serum, growth factors, phorbol esters, cytokines, and interleukins, including IL-6, and viruses30. Therefore, we postulate that its increased circulating concentration in active GCA can be related to its cytokine-like action rather than its interaction with MMP-3, although we cannot predict a specific role, and circulating biomarkers in general may not reflect the local pathology. The lack of correlation between MMP-3 and TIMP-1 in this study (r = 0.11 in GCA, and −0.15 to 0.13 in TA, PAN, and EGPA) is consistent with this interpretation.
BCA-1/CXCL13, a chemokine for B cells, was associated with disease activity in GCA, and possibly in EGPA but only when the model was adjusted for treatment. This marker was of particular interest because it was strongly associated with highly active GPA or MPA in our previous study8. However, prednisone use was associated with increased BCA-1/CXCL13 across multiple diseases in the current study. It appears likely that either active vasculitis or prednisone increases BCA-1/CXCL13, which may limit its usefulness as a clinical biomarker. We are not aware of previous data showing a rise in CXCL13/BCA-1 with prednisone, but this has been well described in MMP-3, the other marker in which we saw such an effect8.
In TA, plasma levels of cellular adhesion molecules and coagulation-related proteins were unrelated to activity status in a previous study31. Small studies have reported higher serum levels of IL-632,33 and IL-8/CXCL834 in patients with active TA. We did not find such an association in our study but determining disease activity in TA after treatment is started is notoriously difficult, and one or more forms of imaging will likely serve prominently as the gold standard in future biomarker studies.
In EGPA, the most promising biomarkers of disease activity within the tested panel seem to be G-CSF, GM-CSF, IL-6, IL-15, and sIL-2Rα, although likely differing in ANCA-positive and ANCA-negative patients. Although all of these proteins were associated with highly active GPA and MPA in our previous study8, the 3 markers most strongly associated with active GPA and MPA (BCA-1/CXCL13, MMP-3, TIMP-1) were not associated with active EGPA in the current study. In later stages of the same trial, a study in which many patients were receiving treatment and many flares were mild, similar to the current study, IL-6 and sIL-2Rα were among 10 markers associated with GPA and MPA, whereas G-CSF and GM-CSF were not (unpublished data).
The 3 blocks of markers with significantly correlated concentrations were similar to what we observed in our previous study of GPA and MPA in patients with severe disease and in remission8. In both studies, CRP and ESR correlated well with each other but weakly and inconsistently with any other marker. The block of cytokines, chemokines, and soluble receptors was particularly similar to what was reported previously, except that sTNFRII did not correlate well with markers in that block in the previous study8, but did in all 4 diseases in the current study. Finally, a block of other, generally noncytokine proteins, was not apparent in the GPA/MPA study but was apparent in TA, PAN, and EGPA in the current study, with no clear explanation.
Treatment with either prednisone or other immunosuppressive agents had a significant effect on concentrations of some measured biomarkers. Although estimates of association of a marker with active disease did not change much with or without adjustment for treatment, our ability to determine the effects of treatment and effects of active disease independent of treatment was limited because only about 10% of samples were obtained off treatment, in a cohort in which disease activity was also changing. Other studies in the VCRC EGPA cohort have shown substantial effects of treatment on levels of circulating biomarkers (eotaxin-3, ESR, CRP, and eosinophil count)5,6, but these markers are specifically related to eosinophils or are markers of systemic inflammation, 2 aspects of inflammation known to be particularly responsive to glucocorticoids.
A focus on patients during treatment is an appropriate assessment of the potential clinical utility of a biomarker’s association with disease activity — one that is not generally seen in the first study reporting a new biomarker. In vasculitis, study of untreated patients is best if the goal is to allow distinction from other potential diagnoses, or to gain insight into pathophysiology, or to provide noninvasive assessment of the involvement of particular organ systems (staging), or to provide prognostic information about likely response to treatment. Our study thus could not address any of these questions and was not expected to provide a platform to discover disease-specific biomarkers, either between the vasculitides in this study or with AAV from our previous study. It is hard to predict whether biomarkers associated with future relapse risk will be found more readily in patients before or after treatment, and we did not attempt to address this question either. Although a comparison between diseases would ideally include untreated patients, we nevertheless were able to detect some differences in association with activity and during remission. These have been associated with active GCA13: IFN-γ, IL-6, IL-8, OPN, PAI-1, PDGF, sICAM-1, and sIL-6R, and we propose that our results simply reflect reduction in biomarker concentrations by treatment rather than being irreconcilable with earlier reports13.
An additional limitation of our study was that dosing of medications, particularly prednisone, was not available, and we did not attempt to discern whether medications had been started or stopped in the month before the visit. Using the investigator’s assessment as the gold standard for disease activity is potentially problematic, but unavoidably so for this type of pilot study. Finally, the results of our J48 classification tree should be taken with caution given that the cross-validation was not very satisfactory as the accuracy dropped, and validation in a separate cohort is important before drawing conclusions about any prediction algorithm involving multiple predictor variables.
The unexpected finding that differences between diseases during clinical remission were more evident than differences related to disease activity or treatment deserves further study in a different direction. There was no clear biologic association of the markers in which this was observed (e.g., elevation of BCA-1/CXCL13, IL-18BP, and MMP-3 in PAN, or sIL-2Rα in EGPA). From a practical point of view, however, a focus on these proteins during clinical remission, including study of patients who remain in remission over the long term (not represented in this study), may lead to discovery of biomarkers associated with a tendency to relapse or with longterm outcomes.
We identified several biomarkers of disease activity in both GCA and EGPA. The most promising markers of active disease in GCA were BCA-1/CXCL13, ESR, IP-10/CXCL10, sIL-2Rα, and TIMP-1, and in EGPA were G-CSF, GM-CSF, IL-6, IL-15, and sIL2-Rα. Differences of biomarker levels between diseases were more striking than differences related to disease activity or treatment, especially for 6 markers: BCA-1/CXCL13, ESR, IL-18BP, IP-10/CXCL10, MMP-3, and sIL-2Rα. Further studies in other cohorts are needed to confirm or refute these findings, to clarify the potential role of these cytokines for diagnosis and/or monitoring of clinical activity in GCA and EGPA, and to understand the roles of those molecules in the inflammatory cascade in the vascular wall.
ONLINE SUPPLEMENT
Supplementary material accompanies the online version of this article.
Footnotes
This work was sponsored by the Vasculitis Clinical Research Consortium (VCRC). The consortium is part of the Rare Diseases Clinical Research Network, an initiative of the Office of Rare Diseases Research, National Center for Advancing Translational Science (NCATS). The VCRC is funded through collaboration between NCATS and the National Institute of Arthritis and Musculoskeletal and Skin Diseases (U54 AR057319), and has received funding from the National Center for Research Resources (U54 RR019497). Additional funding for this project included RC1 AR 058303 and P60 AR047785.
- Accepted for publication August 16, 2019.


