

Abstract
Objective. We performed a systematic review of the literature to describe current knowledge of cardiovascular (CV) risk prediction algorithms in rheumatic diseases.
Methods. A systematic search of MEDLINE, EMBASE, and Cochrane Central databases was performed. The search was restricted to original publications in English, had to include clinical CV events as study outcomes, assess the predictive properties of at least 1 CV risk prediction algorithm, and include patients with rheumatoid arthritis (RA), ankylosing spondylitis (AS), systemic lupus erythematosus (SLE), psoriatic arthritis (PsA), or psoriasis. By design, only cohort studies that followed participants for CV events were selected.
Results. Eleven of 146 identified manuscripts were included. Studies evaluated the predictive performance of the Framingham Risk Score, QRISK2, Systematic Coronary Risk Evaluation (SCORE), Reynolds Risk Score, American College of Cardiology/American Heart Association Pooled Cohort Equations (PCE), Expanded Cardiovascular Risk Prediction Score for Rheumatoid Arthritis (ERS-RA), and the Italian Progetto CUORE score. Approaches to improve predictive performance of general risk algorithms in patients with RA included the use of multipliers, biomarkers, disease-specific variables, or a combination of these to modify or develop an algorithm. In both SLE and PsA patients, multipliers were applied to general risk algorithms. In studies of RA and SLE patients, efforts to include nontraditional risk factors, disease-related variables, multipliers, and biomarkers largely failed to substantially improve risk estimates.
Conclusion. Our study confirmed that general risk algorithms mostly underestimate and at times overestimate CV risk in rheumatic patients. We did not find studies that evaluated models for psoriasis or AS, which further demonstrates a need for research in these populations.
Chronic inflammatory rheumatic diseases (IRD) are associated with significant cardiovascular (CV) morbidity and mortality1,2. Patients with rheumatoid arthritis (RA)3,4,5, systemic lupus erythematosus (SLE)6,7,8,9,10, ankylosing spondylitis (AS)11,12,13,14, psoriasis15,16, and psoriatic arthritis (PsA)17,18,19,20,21 have an increased CV risk compared to the general population; this increased risk is attributed to a combination of systemic inflammation and high prevalence of traditional risk factors.
CV risk prediction algorithms are an important tool for clinicians to estimate patients’ risk of developing future CV events. Based on the estimated risk, patients are stratified into risk groups, thereby allowing for preventive interventions to be appropriately targeted to those patients who are most likely to benefit. Therefore, precise estimates of CV risk are desirable and could lead to more effective healthcare delivery, ultimately resulting in decreased CV morbidity and mortality. Several CV risk prediction algorithms have been developed for use in the general population. These algorithms estimate the expected CV risk using various combinations of traditional CV risk factors. The Framingham Risk Score (FRS), one of the most widely used algorithms, was developed and validated in an American cohort to calculate the 10-year risk of CV disease and was most recently updated in 200822,23. The Systematic Coronary Risk Evaluation (SCORE) algorithm was developed and validated in 12 European cohorts to predict the 10-year risk of CV mortality24. In 2013, the American College of Cardiology and American Heart Association released the Pooled Cohort Equations (PCE)25. The PCE was derived from large racially and geographically diverse cohort studies to predict 10-year risk of atherosclerotic CV disease events. Unlike these scores, which are based solely on traditional risk factors, the QRISK2 algorithm includes RA as an independent risk factor26. Similarly, the Reynolds Risk Score (RRS) incorporates the inflammatory marker C-reactive protein (CRP) in addition to traditional risk factors27,28.
The performance of these algorithms in IRD is suboptimal because traditional CV risk factors do not fully explain the increased CV risk in rheumatic patients, and current risk algorithms do not represent other contributing factors, thereby underestimating the actual CV risk29. In an attempt to address these limitations, the 2016 European League Against Rheumatism (EULAR) recommendations for CV risk management proposed to apply a 1.5 multiplier to any calculated CV risk score to accommodate the risk30.
The accuracy of these risk algorithms in predicting future CV events has not been summarized in IRD. Therefore, the aims of this systematic review were (1) to describe current knowledge of CV risk prediction algorithms in patients with IRD, and (2) to identify approaches to improve CV risk stratification. The results of this review could identify current knowledge gaps and inform the development of novel risk prediction algorithms.
MATERIALS AND METHODS
Study protocol
We followed the Preferred Reporting Items for Systematic Reviews and Meta-Analyses (PRISMA) guidelines to conduct our review and analysis. We searched OVID Medline (1946 to October 30, 2017), OVID Embase (1947 to October 30, 2017), and Cochrane Central Register databases using a search strategy developed by an experienced academic health sciences librarian (APA), with input from the study leads. The search strategy (Supplementary Data 1, available with the online version of this article) was limited to English publications in humans.
Eligibility criteria and study selection
To be included in the systematic review, original studies needed to fulfill the following inclusion criteria: study design (retrospective or prospective cohort), population (psoriasis, PsA, AS, RA, or SLE), study outcome (myocardial infarction, stroke, transient ischemic attack, angina, ischemic heart disease, heart failure, CV death), and predictive ability (evaluated predictive performance of a CV risk prediction algorithm using relevant statistics).
Titles and abstracts were initially screened by 2 reviewers (KC and VO) for potential inclusion. Selected publications were retrieved in full, and 2 reviewers (KC and VO) independently assessed them for eligibility; upon disagreement, a final decision was reached through discussion with a third reviewer (LE).
Data were independently extracted by 2 reviewers (KC and VO) according to a standardized form and summarized in tables. For each study, the following information was recorded: year of publication, disease, study location, study duration, mean age, sex, data source, sample size, incidence rate of CV events, evaluated predictors, type of CV outcomes, case definition, and performance of risk score.
Risk of bias in individual studies
For assessing methodological quality and risk of bias in cohort studies, the Newcastle-Ottawa Scale was used. This tool uses a star system to judge studies on 3 broad perspectives: the selection of study groups, the comparability of the groups, and the ascertainment of the outcome of interest. The highest quality studies are awarded up to 9 stars. We decided to rate studies as low risk of bias if they received 9 stars, moderate risk of bias if they received 7 or 8 stars, and high risk of bias if they received < 7 stars, because no explicit guidance exists.
RESULTS
An initial search identified 12,099 entries, of which 146 articles were retrieved for review (Figure 1). After reviewing the manuscripts, 137 were excluded for the following reasons: 121 used at least 1 CV risk prediction algorithm but did not evaluate its predictive performance, 10 were the wrong study type (e.g., case-control, cross-sectional), and 6 did not report clinical CV events. During the preparation of the manuscript we identified 2 additional articles31,32 that met the inclusion criteria; however, because they were published in 2018, they were not included in the initial search results. We added these articles to the list of publications included in this review. Thus, a total of 11 studies (9 RA, 1 SLE, 1 PsA) were included in this review. The study characteristics and major findings are summarized in Table 1 and Table 2.
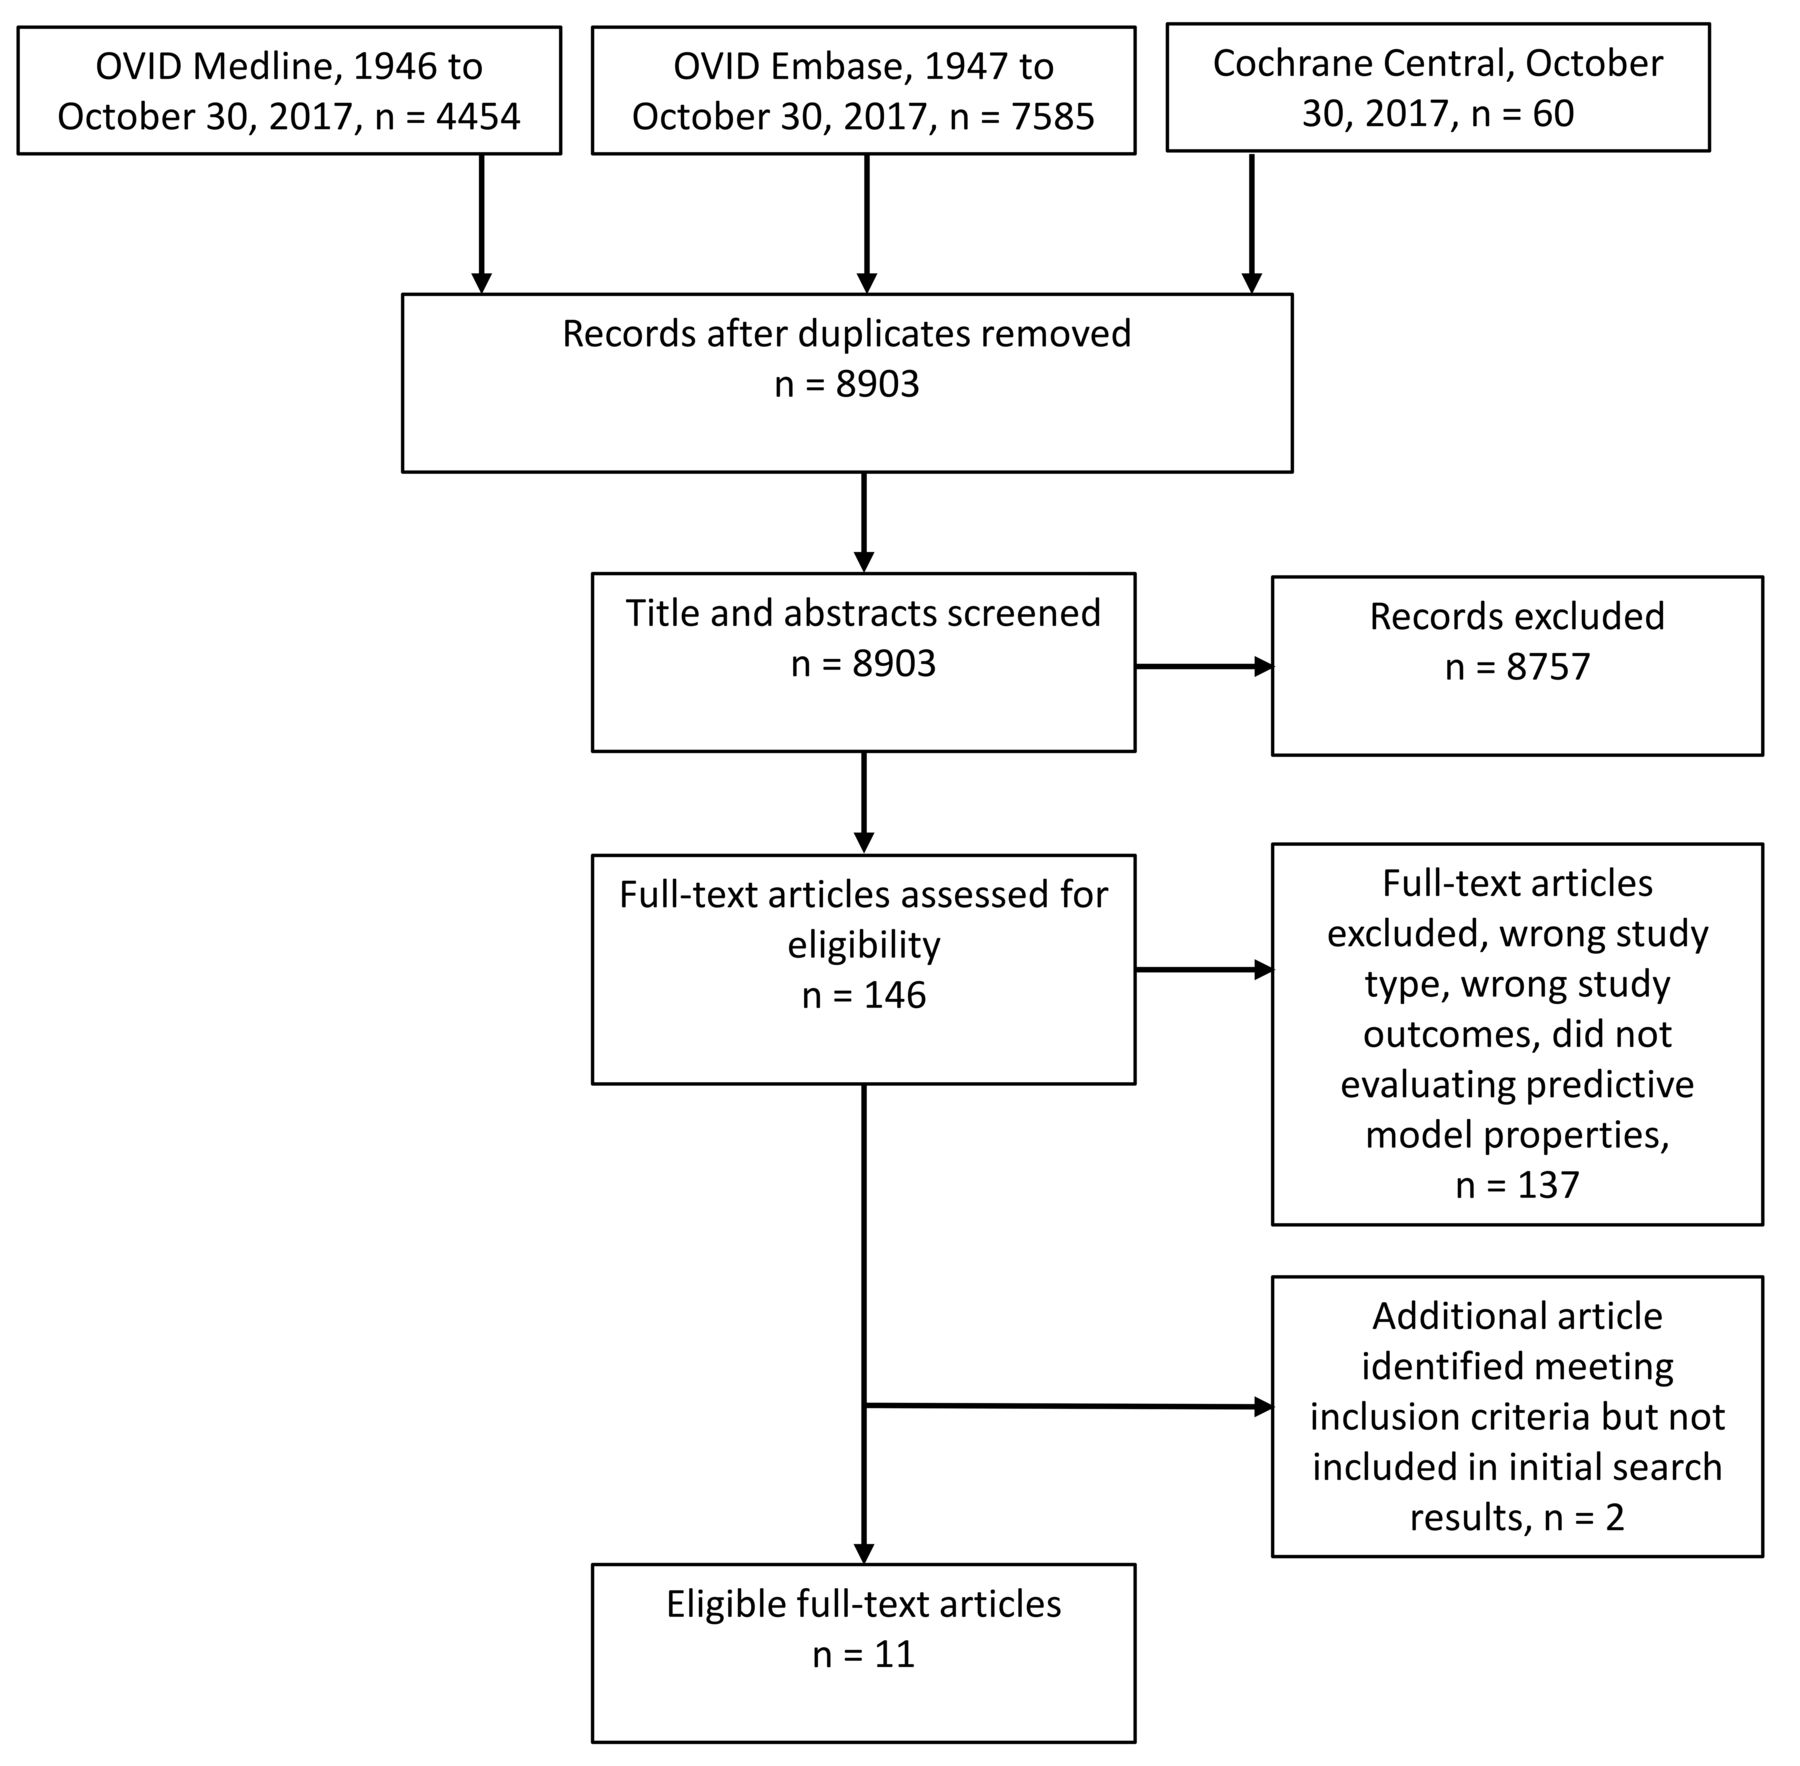
PRISMA diagram. PRISMA: Preferred Reporting Items for Systematic reviews and Meta-Analyses. From: Moher D, Liberati A, Tetzlaff J, Altman DG; PRISMA Group. Preferred reporting items for systematic reviews and meta-analyses: the PRISMA statement. PLoS Med 2009;6:e1000097. Distributed under the terms of the Creative Commons Attribution License.
Characteristics of the studies included in the systematic review.
Summary of results of studies included in the systematic review.
RA
The performance of existing risk scores in predicting CV risk varies in different studies. Crowson, et al33 found that the observed CV risk was 1.8 times higher than the predicted risk by FRS. The discrepancy was particularly high in women, seropositive patients, and those with persistently elevated inflammatory markers. The RRS, which includes CRP in addition to traditional CV risk factors, showed similar deficits33. In contrast, a more recent publication from a large international cohort showed a tendency of existing risk scores, including FRS and QRISK2, to overestimate CV risk, while the RRS underestimated CV risk34. QRISK2 also overestimated risk in a Dutch cohort, whereas application of the FRS, RRS, and SCORE led to underestimations35.
Several approaches for improving CV risk prediction in patients with RA were assessed. The first approach included applying a multiplication factor to existing risk scores or recalibration of these scores by applying different weights to their components. This approach was evaluated in 3 studies33,34,36. In a population-based study of the Rochester Epidemiology Project, a multiplication factor of 1.8 was applied to the FRS in an attempt to improve model performance33. Although this adjustment improved calibration (the agreement between observed and predicted CV risk) for patients with moderate CV risk, it had no effect on overall discrimination (correct classification of patients into the event and the non-event groups). The application of the EULAR multiplier to the FRS and PCE in an international multicenter study resulted in overestimation of future CV risk and did not improve discrimination, as measured by C-statistics, compared to the existing risk scores34. Arts, et al36 evaluated the performance of a recalibrated version of SCORE by adjusting the weights of predictors originally included in SCORE. After the recalibrated SCORE was analyzed in their Dutch cohort, there was no improvement in discrimination. In fact, the reweighted traditional risk factors underestimated CV risk across all risk groups.
A second approach, performed in a Swiss cohort37, included addition of autoantibodies and biomarkers of inflammation to the FRS. The predictive ability of these was modest: CRP, immunoglobulin M rheumatoid factor, anticyclic citrullinated peptide, oxidized low-density lipoprotein, and N-terminal pro-brain natriuretic peptide (NT-proBNP). Only anti–apolipoprotein A–I (anti-apoA-I) substantially enhanced the discrimination of the FRS. This led to a significant increase in the area under the curve (AUC) from 0.72 for FRS alone to 0.81 for the FRS and anti-apoA-I combined, corresponding to a relative increase in integrated discrimination improvement of 175%. Combining all biomarkers did not result in improvement, compared to the combination of FRS and anti-apoA-I alone. However, it should be noted that the assessments of predictive ability of the combined models were not adjusted to the time at risk and that the duration of followup varied across study patients (interquartile range 5–15 yrs).
In a third approach, 2 studies added disease-specific variables to general risk scores36,38. Alemao, et al38 evaluated the addition of CRP to 2 existing risk scores, FRS and QRISK2, in a population-based cohort of patients with RA from the UK. Although CRP was associated with an increased CV risk when added to the FRS (12% increase in HR), the addition of CRP as a predictor to both models resulted in subtle improvements in discrimination that were clinically insignificant. In addition, reclassification using the FRS was characterized by a nonsignificant improvement and a worsening of reclassification by QRISK2. In the second study using a Dutch cohort, the original SCORE was adapted with the addition of both traditional and disease-specific risk factors36. The adapted SCORE showed a subtle improvement in discriminatory ability compared to the original SCORE, which was not significant. Further, it did not lead to a significant improvement in reclassification of patients into risk groups that better matched their actual CV risk. When the adapted SCORE was evaluated in external cohorts from the UK and Norway, the discriminatory ability of the adapted model was worse than the original SCORE.
Two studies attempted to derive new RA-specific risk algorithms using traditional CV risk factors and RA characteristics39,40. The Expanded Cardiovascular Risk Prediction Score for Rheumatoid Arthritis (ERS-RA) was developed and internally validated using a large patient registry in the United States39. The score was derived from a base model that included only traditional CV risk factors and an expanded model that evaluated RA- and non-RA related variables. The addition of measures of RA disease activity [Clinical Disease Activity Index (CDAI)], disability [modified Health Assessment Questionnaire (HAQ)–Disability Index], daily prednisone use, and disease duration (> 10 yrs) contributed to a model that demonstrated a significant improvement in discrimination with adequate model calibration (improvement in C-statistic from 0.73 in the base model to 0.76 in the expanded model). The ERS-RA significantly improved the net reclassification of patients using both the FRS (17% of the patients) and PCE (10% of the patients) to reclassify to the correct risk categories in the expanded model. However, in a more recent study, Crowson, et al34 found that the ERS-RA overestimated CV risk in a large international cohort and that its discriminatory ability was inferior to that of general risk scores including QRISK2, FRS, PCE, and RRS. External validation of the ERS-RA in Swedish cohorts demonstrated good discriminatory capability, and underestimation of the 10-year CV risk in high-risk groups was observed. However, no comparisons were made to general risk scores32.
The second study attempting to derive an RA-specific risk score included several international longitudinal cohorts. Crowson, et al40 assessed 2 models that included traditional risk factors along with either HAQ or 28-joint count Disease Activity Score using erythrocyte sedimentation rate. Neither of these models demonstrated improved discrimination compared to general risk scores including FRS, PCE, SCORE, or QRISK2 (C-statistic ranged from 0.70 to 0.72). Although the RA-specific models showed better calibration than the general risk scores, this may have occurred because calibration is expected to be better in the cohort used to develop the new risk score than the general scores developed in other models. The developed models also significantly overestimated CV events.
SLE
In the study that followed patients seen at the University of Toronto Lupus Clinic since 1970, the FRS was compared to a modified FRS with 4 multiplication factors (range 1.5–4)41. A multiplier of 2 predicted CV risk more accurately than the original FRS (20% vs 2.9% risk), and most appropriately categorized patients with moderate/high risk with sufficient sensitivity and specificity. The sensitivity and specificity for FRS (moderate/high risk vs low risk) to predict CV events were 6.8 and 98.1, respectively, whereas the sensitivity for the FRS with a multiplication factor of 2 increased to 34.5 with a modest reduction in specificity to 84.4, respectively. The study did not compare global measures of model predictive ability between the models (e.g., AUC).
PsA
In a small Italian cohort of patients with PsA, 5 general risk scores (FRS, SCORE, QRISK2, RRS, and CUORE) were adapted to EULAR recommendations by adding a 1.5 multiplier or including weight adaptation for RA in QRISK231. The 5 algorithms underestimated CV risk, and the adaptation suggested by EULAR did not increase the discriminative ability or calibration of any of the evaluated algorithms. Overall, the original risk scores demonstrated relatively good discrimination between patients with or without CV events, with a range of AUC between 0.718 (for RRS) and 0.866 (for QRISK2).
Quality assessment
Two studies had low risk of bias, 7 studies had moderate risk of bias, and 2 studies had high risk of bias (Table 3). In one study, it was unclear whether participants with a history of CV disease were excluded from analysis38. There was limited information on how CV events were ascertained in 3 studies34,40,41. Owing to the limited number of studies included in this review, those with lower scores were not excluded from the quality assessment.
Newcastle-Ottawa Quality Assessment Scale for cohort studies.
DISCUSSION
There are several challenges associated with deriving and validating disease-specific algorithms or modifying existing general risk scores to improve risk prediction and stratification. This study identified potential predictors of future CV events that warrant further investigation.
Most studies evaluated performance using clinical variables rather than novel laboratory biomarkers, which may be more difficult to implement in a clinical setting. Findings by Finckh, et al37 that anti-apoA-I significantly improved the predictive accuracy of the FRS demonstrates its potential as a clinically useful CV biomarker, because it is easily measurable and may assist in identification of high-risk RA patients42. Anti-apoA-I antibodies and NT-proBNP have been found to be associated with increased atherosclerotic plaque vulnerability and cardiac ischemia, respectively43,44,45. Other risk markers have shown promise in improving risk discrimination in rheumatic patients. Several noninvasive imaging techniques, including carotid ultrasound (US)29,46,47 and coronary artery calcium (CAC) quantification by computed tomography, have identified markers for determining subclinical atherosclerosis. In RA, carotid atherosclerosis as assessed by US was found to predict CV events in patients with greater carotid intima-media thickness and in those with bilateral plaques48. In patients with RA stratified according to a modified SCORE, carotid US was sensitive to detect patients at moderate risk (1–5%)49. When compared to CAC, carotid US was found to be more sensitive in the stratification of CV risk50, and similar results were reported in an axial spondyloarthritis group51. These results highlight the potential use of carotid US for improving CV risk stratification in rheumatic patients and encourage further research of this tool in combination with traditional risk scores.
Multipliers have been widely applied to general risk calculators so that they more accurately reflect the effect of each variable in the algorithm while retaining their relative value. Despite EULAR’s recommendation30, other studies show that applying the multiplication factor does not significantly improve risk prediction31,36. In addition, application of the multiplier reduced calibration without improving discrimination or reclassification to the correct CV risk category in patients with RA34. Similar results were found in patients with PsA, where the EULAR multiplier failed to demonstrate improvement in both discrimination and calibration for any of the 5 evaluated general risk scores31. On the other hand, Urowitz, et al41 applied a factor of 2 to the FRS, which improved the accuracy of classified SLE patients at moderate/high risk. It should be noted that even after this adaptation, the sensitivity to identify high-risk individuals was only about 30% and the study did not assess measures of discrimination and calibration of the suggested adaptation. Whether these results have a similar effect in other SLE populations is questionable, given that the FRS variables were not recalibrated to SLE and retained the same weights derived from the general population. Although multipliers can be used as a means to improve risk prediction, they would improve calibration, but not discrimination, resulting in a missed opportunity to intervene early33.
Four RA studies included either inflammatory biomarkers, disease-specific variables, or a combination of both to modify or develop an algorithm36,38,39,40. The only algorithm to significantly improve predictive performance was the ERS-RA, which could be readily applied to a clinical setting. The ERS-RA does not incorporate novel serum biomarkers, but its use of the CDAI, a composite measure of disease activity, may be representative of systemic inflammation underlying the excess CV risk seen in RA. However, the ERS-RA may lead to inaccuracies in estimation of risk. The score was developed using registry data that did not contain lipid levels or blood pressure measurements, and included a population with a mean followup rate of less than 3 years. When the ERS-RA was evaluated in an international multi-center cohort study, it overestimated risk and produced lower risk estimates than current risk algorithms34. However, it performed well in a Swedish cohort and showed excellent calibration for patients with 5–10% 10-year CV risk, but analyses included partial data on smoking status32. The CV risk profile of the American cohort in which the ERS-RA was derived and internally validated may be generalizable to other non-American cohorts.
This study identified 1 disease-specific algorithm (ERS-RA), and its performance varied after being externally validated in Swedish and international cohorts. Further validation and tailoring of the ERS-RA to specific populations is needed before recommendations can be made. Our review also affirmed that general risk algorithms do not perform well in rheumatic patients. These models were largely derived in cohorts established in the late 20th century when participants were less socioeconomically and ethnically diverse, and CV event rates were more than double the current rates52. Only the QRISK equations are regularly updated in modern cohorts and include several predictors, such as deprivation measures, but their applicability outside the UK is limited52. Though it is possible to update existing algorithms, this approach has limitations. Yadlowsky, et al evaluated 2 approaches for improving the PCE: using the PCE with updated cohort data, and using both updated data and new derivation methods53. The first approach modestly improved discrimination, whereas the second approach improved both calibration and discrimination. Most general risk algorithms are also likely to be out of date because of major changes in preventive treatments over recent decades52,54. Among the risk factor–modifying drugs, statins have been recently studied in rheumatic patients owing to their lipid-lowering effects and antiinflammatory properties. A randomized trial of patients with RA found that the addition of statins to disease-modifying antirheumatic drug treatment improved disease variables such as swollen joint count and inflammatory markers55. However, a separate trial in RA showed that statins had no effect on disease activity56. A previous randomized trial was initiated to examine the effect of atorvastatin in preventing CV events in patients with RA, but the trial was terminated early as a result of a low event rate57. Other previously published studies also highlight the role of statins in carotid plaque regression58 and mortality reduction59,60 in RA, AS, and PsA. The lack of account for treatment effect can cause difficulties in the use of CV risk algorithms and underestimation of CV risk. Ideally, risk algorithms should be derived from populations free of treatment. Regarding outcome definitions, most algorithms predicted the risk of fatal or nonfatal coronary heart disease or the combined outcome of CV disease. Because different definitions of CV outcomes lead to different estimated predictor effects, international consensus on a more uniform definition is necessary to aid comparison of developed risk algorithms. Given the challenges associated with using outdated cohort data, increased use of preventive therapy for CV events, and variation in outcome definitions, it is not possible to recommend a general risk algorithm for rheumatic patients.
It appears that subclinical vascular disease is not accurately reflected in risk algorithms, leading to underestimated CV risk and preventable CV events61,62,63. We suggest that measures of subclinical vascular disease be used to improve risk estimates beyond models that use traditional CV risk factors alone. Carotid US or CAC may optimize CV risk estimation and aid in more accurate CV risk stratification. Additional predictors, including measures of ethnicity and socioeconomic status, are also needed to avoid under-treatment of high-risk groups. Although recalibration is likely to reduce overtreatment, general risk algorithms will continue to underperform in rheumatic patients. Unless risk of CV disease is estimated using algorithms derived or recalibrated in present-day populations that represent the patients they are applied to, under- or overestimation of risk is likely to persist.
Our study confirmed that general risk algorithms mostly underestimate and at times overestimate CV risk in rheumatic patients and the excess CV risk in these patients cannot be explained by traditional risk factors alone. Efforts to include nontraditional risk factors, disease-related variables, multipliers, and biomarkers largely failed at substantially improving risk estimates. Rather than recalibrating general risk algorithms, future research should place more emphasis on developing new models and identifying new disease-specific predictors. Further validation and recalibration of the ERS-RA to target populations is needed before recommendations can be made for use in patients with RA.
ONLINE SUPPLEMENT
Supplementary material accompanies the online version of this article.
Footnotes
K. Colaco was supported by an award from the Enid Walker Estate and Women’s College Research Institute. L. Eder was supported by a Young Investigator Award from the Arthritis Society.
- Accepted for publication August 2, 2019.


