

Abstract
Objective. To assess the independent association of insurance and patient income with total shoulder arthroplasty (TSA) outcomes.
Methods. We used the 1998–2014 US National Inpatient Sample. We used multivariable-adjusted logistic regression to examine whether insurance type and the patient’s median household income (based on postal code) were independently associated with healthcare use (discharge destination, hospital stay duration, total hospital charges) and in-hospital complications post-TSA based on the diagnostic codes (fracture, infection, transfusion, or revision surgery). We calculated the OR and 95% CI.
Results. Among the 349,046 projected TSA hospitalizations, the mean age was 68.6 years, 54% were female, and 73% white. Compared to private insurance, Medicaid and Medicare (government insurance) users were associated with significantly higher adjusted OR (95% CI) of (1) discharge to a rehabilitation facility, 2.16 (1.72–2.70) and 2.27 (2.04–2.52); (2) hospital stay > 2 days, 1.65 (1.45–1.87) and 1.60 (1.52–1.69); and (3) transfusion, 1.35 (1.05–1.75) and 1.39 (1.24–1.56), respectively. Medicaid was associated with a higher risk of fracture [1.74 (1.07–2.84)] and Medicare user with a higher risk of infection [2.63 (1.24–5.57)]; neither were associated with revision. Compared to the highest income quartile, the lowest income quartile was significantly associated with (OR, 95% CI): (1) discharge to a rehabilitation facility (0.89, 0.83–0.96); (2) hospital stay > 2 days (0.84, 0.80–0.89); (3) hospital charges above the median (1.19, 1.14–1.25); (4) transfusion (0.73, 0.66–0.81); and (5) revision (0.49, 0.30–0.80), but not infection or fracture.
Conclusion. This information can help to risk-stratify patients post-TSA. Future assessments of modifiable mediators of these complications are needed.
Total shoulder arthroplasty (TSA) is a common surgery being used with increasing rates1. TSA is associated with significant improvements in function and quality of life, and reductions in pain2,3. The overall use of TSA increased from 2.96/100,000 in 1998 to 12.68/100,000 in 20104; the number of hospital admissions for TSA in the United States increased from 8041 in 1998 to 39,072 in 20105. With an increasing rate of use, it is important to understand important factors that affect the outcomes of TSA.
Low socioeconomic status and Medicaid insurance status were associated with risk-adjusted poor outcomes in a variety of medical and surgical conditions6,7,8,9. Medicaid is one of the largest public health insurance programs for low-income and disabled Americans. Medicaid now provides coverage for 72.5 million people10. Medicare is a health insurance program for the elderly. The complex interplay of low income, access to healthcare, health literacy, and patient-physician communication likely contributes to these associations, especially in the disadvantaged populations. Limited data are available regarding the effect of payer status or household income in patients undergoing total joint arthroplasty.
The association of payer status and outcomes after shoulder arthroplasty has been examined. In a study of the 2004–2011 US National Inpatient Sample (NIS) of patients after shoulder arthroplasty, compared to an age- and sex-matched Medicare and Medicaid/uninsured payer status, private insurance payer status was associated with a lower risk of perioperative medical and surgical complications, but no differences in mortality11. In another 2002–2011 NIS study focused on the type of shoulder arthroplasty, Medicaid was associated with a higher adjusted risk of infection in the combined population of TSA or shoulder hemiarthroplasty12. Limitations of these studies were that specific complications (transfusion, revision, etc.) were not studied, and there was no analysis of whether healthcare use differed by payer type. Studies in other similar patient populations (i.e., total knee or hip arthroplasty), showed that Medicaid was associated with higher healthcare use13, mortality14, and readmission15,16. In a 2007–2014 study of State Inpatient Databases (SID) including California, Florida, New York, Maryland, and Kentucky, Medicaid-insured patients had greater odds than patients with private insurance, other insurance, and Medicare of inpatient mortality and 30-day and 90-day readmissions post-TSA17. However, findings may not be generalizable to national TSA cohorts because the study included only 5 states and the study combined total, partial, and reverse shoulder arthroplasty – 3 surgeries that have different outcomes. Thus, there is limited generalizable information about the relationship of insurance payer status to resource use and outcomes after TSA. Income, a key marker of socioeconomic status, has rarely been studied in TSA. Studies suggested an association of income with outcomes after knee arthroplasty18,19.
Our objective was to use a nationally representative sample of patients undergoing TSA to examine whether the annual patient household income and payer status (type of health insurance) were associated with TSA outcomes. We hypothesized that lower annual household income and a Medicaid or Medicare insurance payer status will each be independently associated with poorer post-TSA clinical (infection, transfusion, revision, fracture) and healthcare use outcomes (higher charges, longer hospital stay, discharge to rehabilitation facility; all primary outcomes), compared to the highest income and the private insurance payer, respectively.
MATERIALS AND METHODS
Data source and study cohort
We used the NIS from 1998 to 201420. The NIS is part of the Healthcare Cost and Utilization Project (HCUP), sponsored by the Agency for Healthcare Research and Quality. The NIS is the largest publicly available all-payer inpatient healthcare database in the United States, yielding national estimates of hospital inpatient stays. Unweighted, it contains data from more than 7 million hospital stays each year; weighted, it estimates more than 35 million hospitalizations nationally20. The NIS is a 20% stratified sample of all discharges from US community hospitals from all participating states. Data are obtained from the SID20. NIS includes all inpatient care data from individuals regardless of the payer, including those covered by Medicare, Medicaid, or private insurance, and the uninsured. With a slight change in the design, the NIS is now a sample of discharge records from all HCUP-participating hospitals; for prior years, the NIS was a sample of hospitals20. The NIS provides new weights to account for the design change.
The NIS contains patient characteristics, hospital characteristics, primary and secondary diagnoses, procedures for the index admission, and comorbidity and healthcare use associated with the hospitalization (charges, discharge, length of stay). The NIS data are deidentified and publicly available. The University of Alabama at Birmingham’s Institutional Review Board approved the study (X120207004).
We selected all hospitalizations in the NIS from 1998 to 2014 with an International Classification of Disease, ninth revision, Clinical Modification (ICD-9-CM) code, 81.80 for TSA in the primary position. There have been no changes in the ICD-9 procedure code for TSA during the study duration and the study was conducted before the use of ICD-10 codes in the United States. ICD-9-CM codes for similar procedures in knee or hip (i.e., total knee or total hip arthroplasty) have been shown to be valid21,22. The NIS has been extensively validated against the National Hospital Discharge Survey and its good performance for many estimates has been previously confirmed23,24,25. This ICD-9-CM code for TSA has been used in several previous NIS studies5,26,27.
Outcomes
We examined several outcomes of interest including healthcare use (HCU) and clinical outcomes during the index TSA hospitalization. HCU outcomes included the total hospital charges (above the median; $39,617), the length of hospitalization (above the median; 2 days after rounding), and the proportion of patients discharged to a rehabilitation facility (short-term hospital, skilled nursing facility, intermediate care facility, or another type) rather than home. Medians were chosen rather than arbitrary cutoffs, in accordance with previous studies28,29,30, being insensitive to extreme values.
We also assessed post-TSA complications based on the presence of the following ICD-9 codes during the index hospitalization in nonprimary positions, similar to the methodology used previously by Jain, et al to differentiate these complications from the underlying reason for TSA26: (1) fracture: 79.01, 79.11, 79.21, 79.31, 79.61, 810.xx, 811.xx, 812.xx; (2) infection: 711.xx, 730.xx, 996.66 or 996.67; (3) transfusion: 99.0x; and (4) revision surgery: 81.83.
Exposure of interest and covariates
The exposures of interest were health insurance payer and the median household income. Healthcare insurance payer was categorized as Medicare, Medicaid, Private (reference category), other insurance payer or self-pay status, as previously31. Medicare is a program that provides healthcare coverage for Americans 65 years or older32, while Medicaid provides coverage for the low-income and disabled Americans10. Median household income based on the patient’s postal code was provided by the NIS. Income was divided into quartiles so that the maximum for category/quartile 1 ($25,000 in 1999) was about 150% of the 1999 poverty level and the boundary between the second and third categories/quartiles ($35,000) is about the national median household income. The income varied by year, such that the maximum for quartile 1 was $28,999 in 1998 and $39,999 in 2014 as per the NIS33. The highest income quartile was the reference category.
We adjusted for several covariates including patient characteristics, comorbidity, primary diagnosis, and hospital characteristics, based on their association with arthroplasty outcomes in systematic reviews or clinical studies34,35,36. Demographics (age, sex, race/ethnicity) and comorbidity data were obtained from the NIS dataset at the index admission preoperatively and divided into categories. Age was categorized as < 50, 50 to < 65, 65 to < 80, and ≥ 80 years. Race/ethnicity was categorized as white, black, Hispanic, and other. Medical comorbidity was assessed using the validated Deyo-Charlson index, which consists of 17 comorbidities, based on the presence of ICD-9-CM codes37. Primary diagnosis was categorized as rheumatoid arthritis, aseptic bone necrosis, osteoarthritis (OA), fracture, or other. Hospital location and teaching status were categorized as rural, urban non-teaching, and urban teaching. We classified hospital size as small, medium, or large, as per the NIS procedure. Hospital region was categorized as Northeast, Midwest, South, and West.
Statistical analyses
We used the revised weights provided by the NIS because the study included the NIS data for years earlier than 2011, and because the revised weights make estimates comparable to the new design beginning with 2012 data. These new discharge trend weights replaced the earlier NIS trend weights that were developed for the 1988–1997 NIS following the 1998 NIS redesign.
Summary statistics (mean/median, standard error; proportion) were calculated for the study cohort. We used multivariable-adjusted logistic regression to assess the association of income and payer status with outcomes of interest, including total charges, length of hospital stay, proportion discharged to a rehabilitation facility (healthcare use outcomes), fracture, infection, transfusion or revision (clinical outcomes). Each multivariable model was adjusted for age, race, sex, the primary diagnosis for TSA, and the Deyo-Charlson score. A priori–specified sensitivity analyses additionally adjusted the main models for hospital location/teaching status, hospital size, and the hospital region. We used SAS 9.3 for all the analyses. OR and 95% CI are presented. A p value < 0.05 corresponding to a 95% CI excluding unity was considered statistically significant.
RESULTS
Cohort characteristics
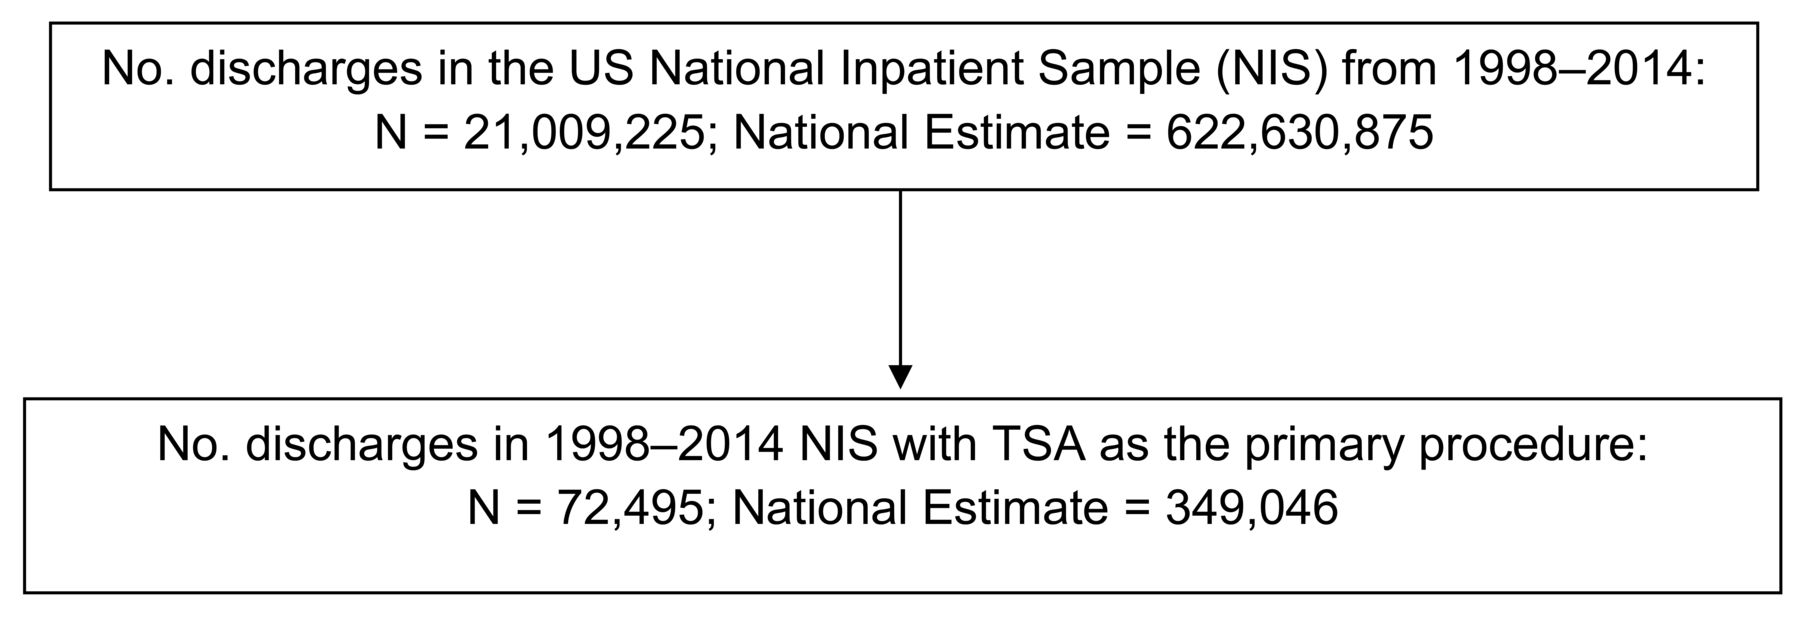
There were 21,009,225 total NIS admissions for the study duration 1998 to 2014 in the United States (national projection, 622,630,875; Appendix 1). The cohort consisted of 72,495 primary TSA procedures performed between 1998 and 2014 in the United States (national projection, 349,046; 0.05% of all national projected admissions; Appendix 1). Mean age was 68.6 years, 54% were female, 73% white, 83% with OA as the underlying diagnosis. Of these procedures, 10% were performed in rural areas, 35% in the southern United States, and 59% were performed in large hospitals (by number of beds; Table 1). The Deyo-Charlson score was zero in 63%. The insurance payer was Medicaid in 2%, Medicare in 65%, private insurance in 29%, and self/other in 4%. The overall rate of complications during the index admission for TSA was low: fracture, 0.9%; infection, 0.1%; transfusion, 5%; revision, 0.3% (Table 1). Mean (standard error) and median total charges were $45,340 (556) and $39,617. The mean and median length of hospital stay were 2.3 days (0.01) and 1.5 days (interquartile range, 1.37). The length of hospital stay was rounded off at 2 days for the median. Eighty-eight percent were discharged home and 12% were discharged to non-home settings.
Demographic and other cohort characteristics for national projected sample of patients undergoing primary total shoulder arthroplasty (TSA) between 1998 and 2014 (n = 349,046).
Insurance type, income, and healthcare use outcomes after primary TSA
Compared to private insurance, Medicaid was associated with higher OR of discharge to a rehabilitation facility and a hospital length of stay > 2 days (median), but not associated with total charges, with OR of 2.16 (95% CI 1.72–2.70), 1.65 (95% CI 1.45–1.87), and 1.08 (95% CI 0.97–1.21), respectively (Table 2). Compared to private insurance, Medicare was associated with higher OR of discharge to a rehabilitation facility and a median length of stay > 2 days, and lower odds of total charges above the median, with OR of 2.27 (95% CI 2.04–2.52), 1.60 (95% CI 1.52–1.69), and 0.92 (95% CI 0.88–0.97), respectively (Table 2).
Multivariable-adjusted* association of insurance payer and income with total hospital charges, discharge disposition, and the duration of hospital stay in the main analysis.
In multivariable-adjusted analyses, compared to the highest income quartile, patients in the lowest income quartile had significantly lower OR of 0.89 (95% CI 0.83–0.96) of discharge to a rehabilitation facility (rather than to home) but a significantly higher OR of 1.19 (95% CI 1.14–1.25) of hospital charges above median (Table 2). All 3 lower income quartiles were associated with a lower OR of the length of hospital stay > 2 days (i.e., above the median), 0.84 (95% CI 0.80–0.89), 0.89 (95% CI 0.85–0.94), and 0.90 (95% CI 0.86–0.94). Other associations are shown in Table 2.
Sensitivity analyses that additionally adjusted for hospital location/teaching status, hospital region, and hospital size confirmed the findings from the main analysis (Table 3).
Sensitivity analyses* for multivariable-adjusted association of insurance payer and income with healthcare use outcomes post-TSA including charges, discharge destination, and length of hospital stay.
Insurance type, income, and clinical outcomes after primary TSA
Compared to private insurance, Medicare and other insurance payer status were associated with a higher risk of infection; Medicare, Medicaid, and other insurance payer status were associated with higher risk of transfusion; and Medicaid was associated with a higher risk of fracture (Table 4). In multivariable-adjusted analyses, compared to the highest income quartile, patients in the first, second, and third income quartiles had significantly lower HR for transfusion and revision, but not infection or fracture (Table 4). Findings were confirmed with sensitivity analyses (data available on request).
Multivariable-adjusted* association of insurance and income with infection, transfusion, fracture, and revision after primary TSA in the main analysis.
DISCUSSION
In this study of the NIS data from 1998–2014, we found that Medicaid and Medicare payer status and median household income were each associated with outcomes in patients who underwent primary TSA in the United States. Several findings merit further discussion.
Both Medicaid and Medicare payer status were independently associated with a higher risk of discharge to a rehabilitation facility and a length of hospital stay > 2 days (median) in patients who had undergone TSA, each with an increase in OR by 60% to 127%. The magnitude of the increased risk/odds was impressive. This finding adds to the recent finding of higher 30-day and 90-day readmission rates in Medicaid-insured patients in a 2007–2014 study of 5 SID17.
Medicaid was associated with a 74% higher risk of fracture and Medicare with a 163% higher risk of infection, a clinically important finding. In a study by Li, et al, both Medicaid and Medicare patients were matched by age and sex with patients with private insurance11. Compared to private insurance, Medicaid patients had 1.5–2 times higher and Medicare patients 1.2–1.4 times higher incidence of medical, surgical, and overall complications, using NIS 2004–11 data11. They had 2.3 times higher risk of infectious complications in a 2007–2014 study of 5 SID17. Medical complications ranged from urinary tract infection to acute cardiac event, and surgical complications from wound disruption to implant failure11. Our finding of 1.6–2.3 times the odds of unfavorable healthcare use outcome in patients undergoing TSA and receiving Medicaid or Medicare (relative to private insurance) is consistent with 1.2–2.3 times odds of complications found in earlier studies11,17, and adds new knowledge.
Our study supports the findings from the earlier studies and provides further insight into hospital admission for TSA. These post-TSA complications are not only undesirable and have additional morbidity for the patients undergoing TSA, but also add to the patient and the healthcare system burden. It is likely that post-TSA medical and surgical complications contribute at least partially to increased use in populations with Medicaid or Medicare coverage. Medicare and Medicaid are inherently different insurance programs in that while Medicare provides coverage for people 65 years or older32, Medicaid provides coverage to low-income and disabled Americans10. Other factors might contribute independently to higher healthcare use and/or by increasing the complication rate38,39,40; data for them were not available in the NIS: socioeconomic factors38, functional status39,40, social support41,42,43, nutritional status/anemia44, concomitant medications, musculoskeletal comorbidity45, etc. Future studies should examine these potential mechanisms of a higher rate of complications and healthcare use post-TSA.
Our study also showed that the odds of post-TSA transfusion were 1.3–1.4 times in Medicaid and Medicare populations compared to those with private insurance. Previous studies of TSA reported that older age, higher comorbidity, white race, anemia, and coagulation disorders were associated with a higher risk of transfusion46,47. Our observation is interesting, since it was independent of age, sex, race/ethnicity, and comorbidity, indicating that other patient or clinical characteristics associated with the payer status not measured in our study (e.g., anemia, underlying gastrointestinal disease, poor nutritional status)48,49 may be responsible for a higher risk for transfusion in Medicare/Medicaid populations.
We also found that in multivariable-adjusted analyses (adjusted for demographics, comorbidity, insurance status, underlying diagnosis, and hospital characteristics), compared to the highest income quartile, the lowest income quartile was associated with significantly lower odds of discharge to a rehabilitation facility, length of hospital stay > 2 days (median), transfusion, and revision. To our knowledge, none of the previous studies of TSA have examined income as a predictor of TSA outcomes. These findings rejected our study hypothesis and add to the current knowledge in the field.
Previous studies suggested an association of lower income with outcomes after knee arthroplasty, showing either similar or more gains with arthroplasty18,19. Our study adds to this growing literature, now showing that compared to the highest income quartile, patients in the lowest income quartile had lower healthcare use and lower risk of key complications after TSA. Possible reasons for better outcomes in patients with the lowest income compared to the highest category include a potentially better preoperative physical status, the need to recover quickly and report back to the job, and possibly a lower rate of psychological comorbidity.
Additional factors that were significantly associated with healthcare use and clinical outcomes were age, race, comorbidity, and underlying diagnosis. These data should help alert surgeons and patients to patient characteristics that are associated with suboptimal postsurgical outcome.
Our study has several limitations and strengths. The findings may not be applicable to some groups within the United States, such as veterans (because the NIS excludes federal facilities such as military hospitals and Veterans Affairs medical centers). NIS counts hospitalizations and not procedures (i.e., bilateral procedures are missed and counted as single procedures). Given that simultaneous bilateral TSA are uncommon, this is unlikely to have affected our estimates greatly. We did not apply any exclusion criteria of prior upper extremity procedure on the contralateral side or other upper extremity joints. It is unclear how prior arthroplasty procedures may have affected the associations between the insurance/income and arthroplasty outcomes. The NIS provides data on the index hospitalization and postdischarge destination, and no specific data validated data on prior surgeries. No Bonferroni correction was made for multiple comparisons. A large sample size, the inclusion of only patients with TSA, and adjustment of the analyses for important covariates are additional strengths.
In a study of the US NIS sample from 1998 to 2014, we found that compared to private insurance, Medicaid and Medicare insurance status were independently associated with higher healthcare use and suboptimal clinical outcomes. Lower income was independently associated with better outcomes after TSA, a counterintuitive finding. This information is useful to surgeons and patients. Future studies should examine whether the mediating variables that underlie the observed relationships can be clearly identified, and subsequently, whether interventions can be designed targeting modifiable factors (i.e., the underlying mechanisms of poor outcomes) in patients with TSA.
APPENDIX 1.

Study flow chart for study sample selection from the US National Inpatient Sample (NIS). TSA: total shoulder arthroplasty.
Footnotes
JAS is supported by the resources and the use of facilities at the VA Medical Center at Birmingham, Alabama, USA.
- Accepted for publication May 8, 2019.


