

Abstract
Objective. Neutrophil extracellular traps (NET) expose modified antigens for autoantibodies in vasculitis. Little is known about levels and removal pathways of NET in systemic lupus erythematosus (SLE), especially in lupus nephritis (LN). We determined circulating levels and defined NET removal in large subsets of patients with incident SLE (iSLE), some of whom had new-onset nephritis.
Methods. Serum levels of NET (ELISA), DNase1/DNase1L3 (ELISA), and DNase activity (functional assay) were determined in 216 patients with iSLE [103 had incident LN (iLN)], in 50 patients with other primary glomerulonephritis, and in healthy controls. Ex vivo NET production by neutrophils purified from a random selection of patients was quantified as elastase/DNA release and by immunofluorescence techniques.
Results. Serum NET levels were very high in iSLE/iLN compared to all groups of controls and correlated with anti-dsDNA, C3–C4, and proteinuria; iLN had the highest levels. DNase activity was decreased in iLN compared to SLE (20% had one-half DNase activity) despite similar serum levels of DNase1/DNase1L3. In these cases, pretreatment of serum with protein A restored DNase efficiency; 1 patient was homozygous for a c.289_290delAC variant of DNASE1L3. Ex vivo NET production by neutrophils purified from LN, SLE, and normal controls was similar in all cases.
Conclusion. Patients with iLN have increased circulating NET and reduced DNase activity, the latter being explained by the presence of inhibitory substances in circulation and/or by rare DNase1L3 mutations. Accumulation of NET derives from a multifactorial mechanism, and is associated and may contribute to disease severity in SLE, in particular to renal lesions. (Clinical trial registration: The Zeus study was registered at ClinicalTrials.gov, study number NCT02403115).
The release of neutrophil extracellular traps, or NETosis, is one of the first lines of defense used by neutrophils against bacteria, viruses, protozoa, and other pathogens1,2,3. It starts with the decondensation and release of nuclear chromatin outside the cell and leads to the formation of a physical net where pathogens are entrapped and killed by elastase, defensin, and reactive oxygen species1,4,5.
Despite their beneficial effects in host defense, NET occur at the expense of potential injury to the host. The formation and removal of NET should be regulated in a timely manner and failure to do so may lead to unfavorable consequences. NETosis may be, in particular, implicated in the pathogenesis of autoimmune conditions because DNA and posttranslational modified proteins in the NET may become antigenic6,7,8,9,10,11. This view is also supported by the observation that pathogens, which activate NETosis, frequently function as a trigger or enhancing factor for autoimmune diseases12.
In early studies, patients with systemic lupus erythematosus (SLE) were shown to display higher NET levels than healthy controls, possibly owing to a defective NET degradation13. Within patients with SLE, NET levels and NET-degrading ability have been associated with disease severity14; in small series of patients, higher NET levels correlate with the development of lupus nephritis (LN). Few studies have focused on the kinetics of NET in SLE, and data on levels of circulating NET in LN are still scanty, despite the importance of these topics. Our study fills these gaps: taking advantage of the large cohort of patients with SLE and LN recruited within the Zeus project15, we measured circulating NET remnants, kinetics of NET formation, and removal by DNase in large cohorts of patients with SLE and LN. Potential factors modifying DNase activity (i.e., circulating inhibitors, mutations of DNASE1) were analyzed in parallel.
MATERIALS AND METHODS
Study design
Samples from patients with SLE were obtained from the biobank of the Zeus study, a prospective, multicenter study that collected blood samples and clinical information from patients with SLE15. Written consent was obtained before sampling. The database and sample collection were located at the Giannina Gaslini Institute of Genoa, Italy. Diagnosis of SLE was done according to the Systemic Lupus International Collaborating Clinics classification criteria for SLE16. Controls were 50 healthy donors from the hospital staff (19–50 yrs); 20 patients with IgA glomerulonephritis and 30 with membranous nephropathy were also studied. All SLE cases were incident patients (i). Also, patients with LN were incident; they were recruited immediately at the onset of renal symptoms that coincided, in general, with the time of renal biopsy. Blood samples were obtained at that time (Table 1). The iLN cohort included 2 populations: a first group presented the renal pathology as first symptom (iLN as onset), a second group presented the renal flare after 1 or more years from the SLE diagnosis (iLN in SLE; Table 2).
Characteristics of iSLE, iLN, IgA, MN, and controls.
Renal and urinary characteristics in incident patients with LN.
In all patients, disease activity and type of organ involvement were scored according to the Systemic Lupus Erythematosus Disease Activity Index (SLEDAI-2K)17. LN was defined according to World Health Organization classification on the basis of immunofluorescence for immunoglobulin (Ig)G, IgA, IgM, C1q, C3 deposition, and classic histology stainings (H&E, Masson’s trichrome, silver methenamine, and periodic acid–Schiff). Patients were excluded if they had severe infections, malignancies, positivity for chronic hepatitis B or hepatitis C virus, or were breast-feeding or pregnant. Therapies mainly consisted of steroids and hydroxychloroquine in SLE and steroids plus cytotoxic drugs in LN (Table 2).
Permission and registration
We obtained written approval of the protocol from the local Independent Ethics Committee (Comitato Etico Regione Liguria) on October 24, 2014 (n 407REG2014). The study was approved by the Italian Drug Agency and was registered at ClinicalTrials.gov (study number: NCT02403115).
Serum NET remnants quantification
Levels of NET remnants were determined in serum and plasma using an ELISA assay, in accord with Hakkim, et al13, with some modification18. The assay determines the myeloperoxidase (MPO)-DNA complex and consists of blocking MPO with specific antibodies on solid phase and determining the free edge of the complex with unconjugated anti-dsDNA antibodies (3519 DNA, AbCam). Anti-MPO monoclonal antibodies (5 μg/ml; Clone 2A11, Serotec) were coated overnight at 4°C in 96-well MaxiSorp Nunc-immuno plates (ThermoFisher Scientific) in 3% bovine serum albumin (BSA) in phosphate buffered saline (PBS). One hundred μl (1:50) of diluted sera were added per well and incubated overnight at 4°C. After 3 washes with PBS and 0.05% v/v of tween-20 (PBS-T), samples were incubated 4 h with anti-dsDNA polyclonal antibody (Abcam). After 3 washes with PBS-T, horseradish peroxidase anti-Human IgG were added and incubated 1 h and washed again 3 times with PBS before addition of the peroxidase substrate. Absorbance at 450 nm was measured using Mark microplate Absorbance Spectrophotometer (Bio-Rad).
DNase activity and protein A for removing inhibitors
DNase activity was determined with a 1-step assay based on the decrease of fluorescence intensity of degrading Picogreen DNA dye/dsDNA complex in solution. Serum and plasma (100 μl) diluted 1:50 with 100 mM Tris-HCl, 20 mM CaCl2, and 2 mM MgCl2 (pH 6.8) were placed in ultraviolet light–transmissive high-quality 96-well microplates (Brand). After adding high polymeric dsDNA (SIGMA-Aldrich) and Picogreen DNA dye (ThermoFisher Scientific) heated to 37°C, a first fluorescent measurement was performed after 5 min (T0). Then the plate was incubated overnight at 37°C, sealed from the top with an adhesive sticker to inhibit evaporation during the incubation step, and protected from light until the final measurement after 16 h (T16). Measurements of Picogreen DNA dye fluorescence intensity were performed in a fluorescence reader at 520 nm (3 reads with 20 µs of integration time). The percentage of decrease of fluorescence intensity was determined by subtracting the value obtained at T0 with the value at T16. Results are given as percent of degraded DNA for each well.
DNase activity in low-activity samples was also measured after protein A (Staphylococcus aureus) treatment to remove potential inhibitors of DNases. In this case, 100 μl of protein A (Sigma Aldrich) in PBS were incubated with 100 μl of serum for 2 h. Unbound material was recovered after centrifugation (800 g × 30 min) and retested for DNase activity.
DNASE1 and DNASE1L3 quantification
A homemade ELISA assay was used to test DNAse1 serum levels. Anti-DNAse1 rabbit polyclonal antibodies (Abcam) were coated in 96-well MaxiSorp Nunc-immuno plates (ThermoFisher Scientific) and maintained overnight at 4°C. After blocking in 3% BSA in PBS, 100 μl of standard or 1:50 diluted sera were added to each well and incubated overnight at 4°C. Wells were washed 3 times with PBS and 0.05% v/v of tween-20 (PBS-T). Then plates were incubated 4 h with anti-DNase1 mouse polyclonal antibody (Abnova). Each well was then washed again, 100 μl of substrate solution was added, and wells were blocked with 50 μl of stop solution; reaction was read at 450 nm as above. Results are given as ng/ml. The assay was validated by comparison with a commercial kit for DNase1 (LSBio Inc.).
For DNASE1L3 we used a specific for DNase 1L3 ELISA (LSBioInc.) according to the manufacturer’s instructions; details are given in the Supplementary Methods (available with the online version of this article). Results are given as ng/ml.
DNASE1L3 sequencing
The analysis was done with Next Generation Sequencing in the Laboratory of Neurogenetics and Neuroinflammation at the Image-Institut des maladies genetiques, Paris19.
Anti-DNA antibodies
Anti-DNA antibodies determination was done with 2 methods: commercial assay DNA-DIAMEDIX (Delta Biologicals), and a homemade Western blot. Details are given in the Supplementary Methods (available with the online version of this article). The agreement between DIAMEDIX and the homemade assay was measured using the Cohen’s κ (κ = 0.61; 95% CI 0.50–0.7) and the Spearman’s correlation coefficients (0.67; 95% CI 0.59–0.75). Sensitivity and specificity were 90% and 70%, respectively.
Ex vivo NET production
The study of ex vivo NET production was done in representative subgroups of patients recruited for the main study groups above (i.e., 18 with active iLN, 15 with iSLE, and 27 controls). Neutrophils were isolated from heparinized peripheral blood under sterile conditions, using dextran sedimentation followed by Ficoll gradient centrifugation20 (Supplementary Methods, available with the online version of this article, for more details). Neutrophil suspensions were allowed to adhere onto 24-well plastic dishes and were cultivated as described in Supplementary Methods. NET release was evaluated in 2 ways: a quantitative method that uses the elastase and DNA release in resting and phorbol myristate acetate (PMA) stimulated cells, and a technique that determines NET DNA and histone 1–3 composition after stimulation of neutrophils with serum from SLE and controls.
To quantify NET production, the Cayman’s NETosis assay kit (cat. No 601010, Cayman Chemical) was used according to the manufacturer’s instructions. It determines the elastase associated with NET. Briefly, 100 μl of standard or culture supernatants per well, heated to 37°C, were incubated with 100 μl of the 1:30 diluted NET assay neutrophil elastase substrate for 2 h at 37°C before reading at 405 nm.
Neutrophils were resuspended in 2% human serum albumin and allowed to adhere on poly-L-lysine–coated glass slides for 40 min, incubated with 0.05 ml SLE and control sera and then fixed with 3.7% paraformaldehyde. Immunofluorescence for histone 1 and 3 are described in the Supplementary Methods (available with the online version of this article).
Statistical analysis
Comparison of datasets was done using Mann-Whitney U or Kruskal–Wallis tests for 2 or > 2 unpaired samples, respectively. Spearman correlations were calculated for defining any relationship among biochemical variables and biomarkers of SLE activity. Two-tailed p values ≤ 0.05 were considered significant.
In receiver-operating characteristic (ROC) analysis, proteins with an area under the curve (AUC) ≤ 0.5 were excluded.
RESULTS
Clinical features of the different groups of patients
The main clinical differences between the 3 subgroups of patients (iSLE, iLN as onset, iLN after SLE) are reported in Table 1 and Table 2. Age was comparable except for 3 patients under 16 years in the group with iLN as onset. With the exception of the renal involvement that was uniquely present in all iLN and joints that were comparable in iSLE and iLN, there were a few minimal disparities in other organ pathologies (Table 1). With reference to renal variables (histology, proteinuria, renal function, etc.), no difference was observed in iLN with nephritis occurring as onset of the disease or after at least 1 year from the diagnosis of SLE.
Circulating NET remnants are high in SLE and LN
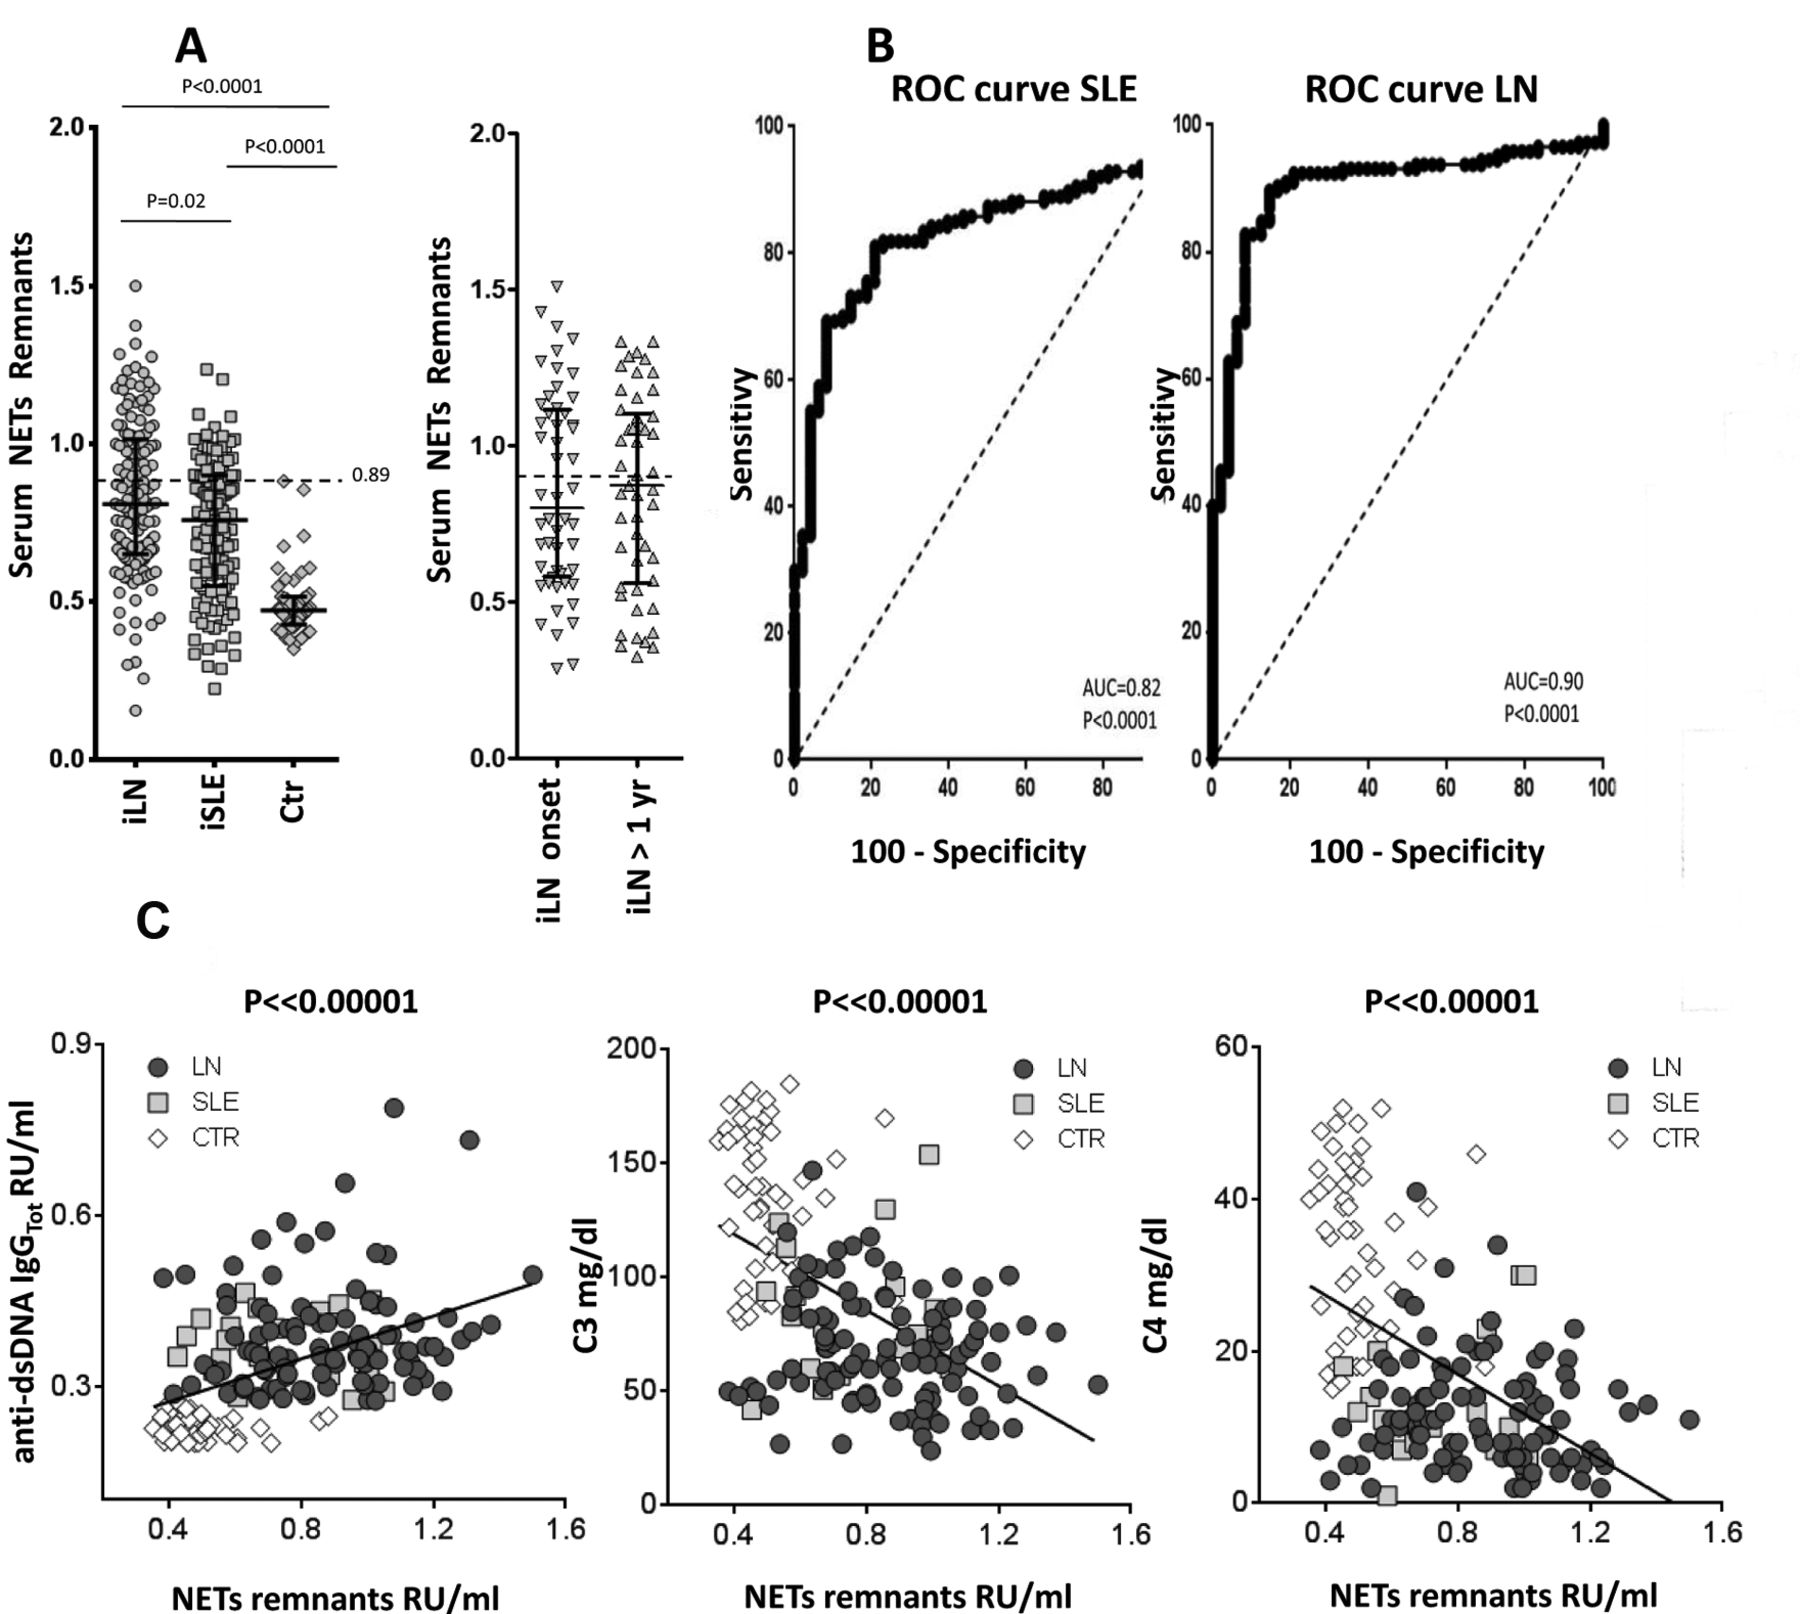
Serum NET remnant levels were significantly higher in patients with iLN and iSLE compared to healthy controls and to patients with other primary glomerulonephritis (p < 0.0001; Figure 1A, and Supplementary Figure 1, available with the online version of this article). NET levels were comparable in the 2 subgroups of iLN, and in both were higher compared to SLE (p < 0.02). ROC showed AUC of 0.82 and 0.92 of the DNA-MPO assay (measuring NET remnants) to diagnose SLE or LN, respectively (Figure 1B)21,22.

Circulating neutrophil extracellular traps (NET) remnants. A. Serum NET were determined using an ELISA measuring the DNA-MPO complex. Results are relative unit/ml given as median and interquartile range. The dashed line indicates the upper limit of normality (0.89). Here, serum NET is reported in all SLE, in all LN, and in controls. Also shown, in parallel, are NET levels in patients with LN split into the 2 subgroups (i.e., LN at onset, LN 1 yr after the SLE onset). B. ROC curves showing specificity and sensitivity of the DNA-MPO assay for patients with LN and SLE. C. Relationships between NET remnants serum levels (X-axis) and major markers of SLE clinical activity, i.e. anti-dsDNA autoantibodies, C3, and C4. Only best fittings (R2 > 0.5) are reported here. MPO: myeloperoxidase; SLE: systemic lupus erythematosus; LN: lupus nephritis; ROC: receiver-operating characteristic; iLN: incident LN; iSLE: incident SLE; Ctr: controls.
Serum NET did not correlate with SLEDAI (Supplementary Table 1, available with the online version of this article), or with age and therapies, or in particular, with steroid doses. On the contrary, NET had a series of correlations that includes positive relationships with circulating anti-dsDNA, anti-C1q antibodies (Figure 1C), and protein-uria, and negative relationships with complement and C-reactive protein.
DNase activity is reduced in LN
DNase activity was reduced in patients with iLN compared to SLE and controls (Figure 2A), in some cases reaching half the normal activity. The 2 subgroups of iLN had comparable DNase activity. Overall, DNase activity did not correlate with circulating NET.
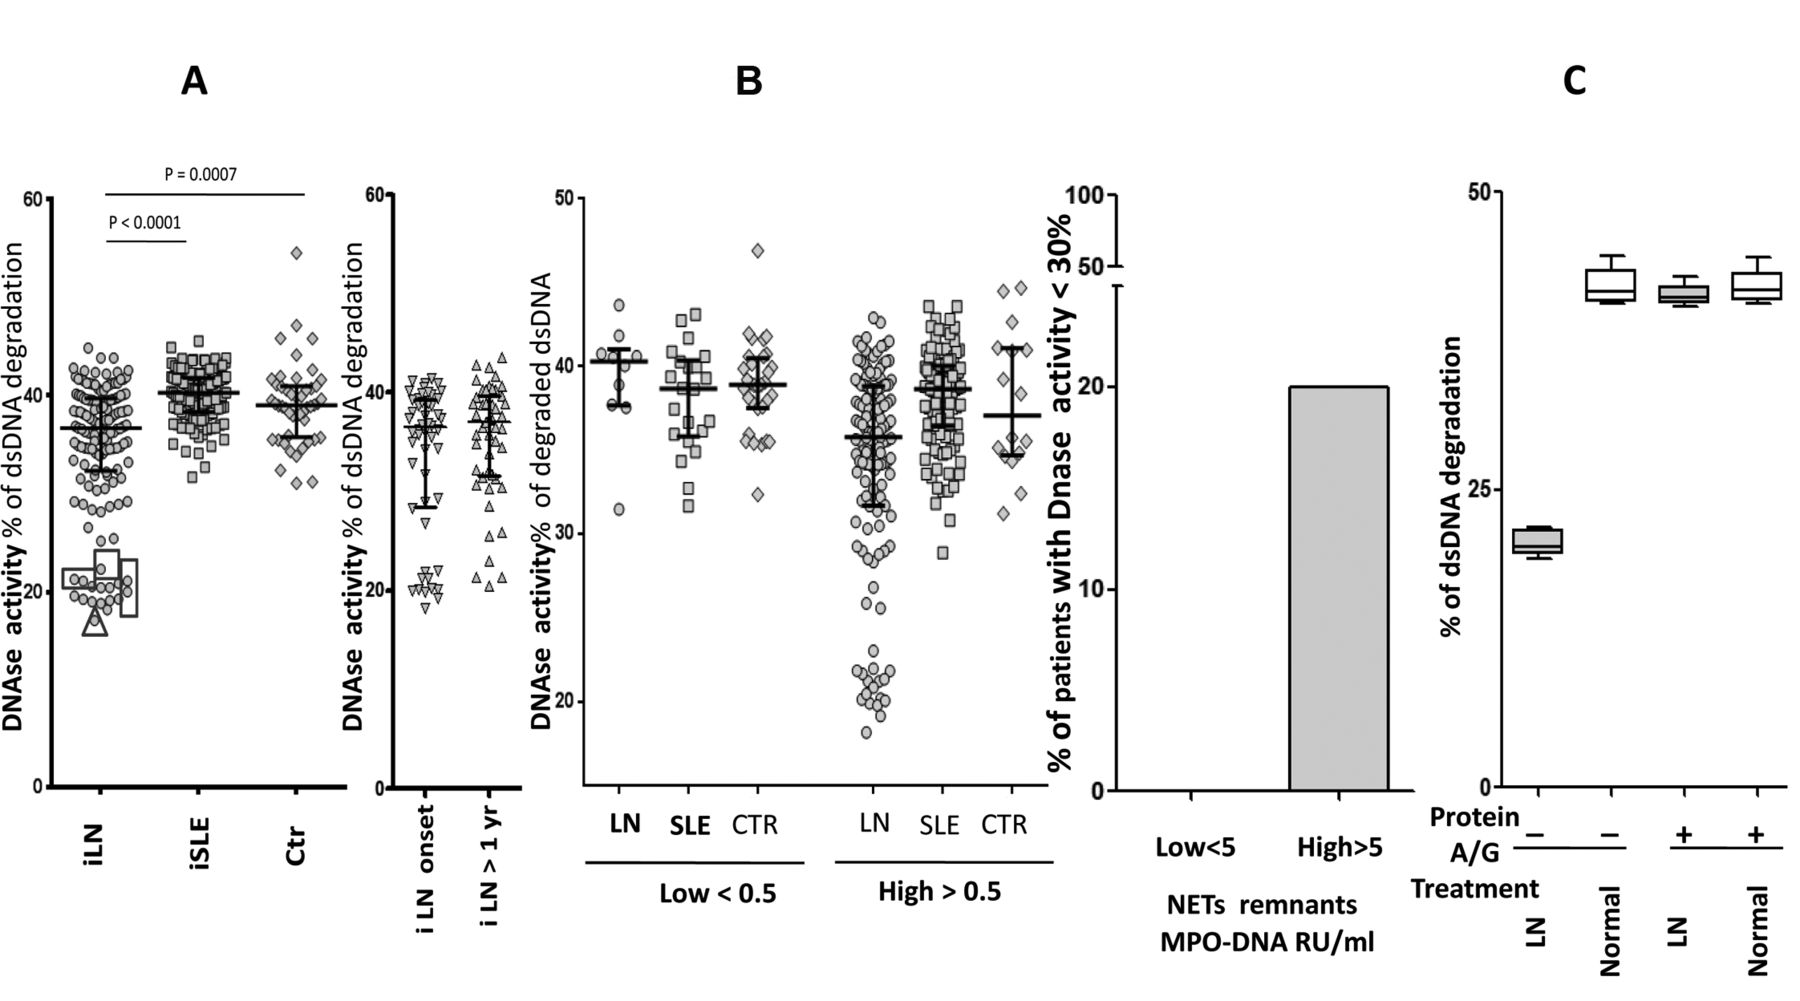
Serum DNase activity. A. DNase activity was determined with a 1-step assay based on fluorescence decrease of degrading Picogreen DNA dye/dsDNA. In patients indicated with a square serum, DNase activity was retested after treatment with protein A/G. The triangle indicates a boy who presented a c.289_290delAC homozygous variant in DNASE1L3. Here, it is also reported in parallel DNase activity in patients with LN split into the 2 subgroups (i.e., LN at onset, LN after 1 yr from the SLE onset). B. Patients with LN, SLE, and controls were subdivided according to their serum levels of NET remnants (higher and lower than the normal level of 0.5 RU/ml). For all subgroups, DNase activity is reported in the Y-axis, showing that low levels were present only in LN despite comparable circulating NET in the other subgroups. In the right panel it is shown that the 20% of LN patients with high circulating NET (> 0.5 MPO-DNA RU/ml) had low DNase versus 0 of the low-circulating NET subgroups. C. Sera with DNase activity in the lower range (indicated by squares in panel A) were pretreated with protein A (Staphylococcus aureus) to remove potential inhibitors. In this case, 100 μl of protein A (Sigma Aldrich) in PBS were incubated with 100 μl of serum for 2 h. Unbound material was recovered after centrifugation (800 g × 30 min) and retested for DNase activity. LN: lupus nephritis; SLE: systemic lupus erythematosus; NET: neutrophil extracellular traps; PBS: phosphate buffered saline; MPO: myeloperoxidase; iLN: incident LN; iSLE: incident SLE; Ctr: controls.
However, the lowest levels were found in patients with high circulating NET: 20% of LN patients with serum NET > 0.5 (RU/ml) had DNase under the normal limit (Figure 2B, 2C). Figure 2B shows that SLE patients with high NET (> 0.5 RU/ml) but without nephritis (and also normal controls) had normal DNase activity, suggesting that low DNase is a peculiarity of patients with LN.
Sera with DNase activity in the lower range (indicated in squares in Figure 2B) were pretreated with protein A to remove potential inhibitors. This pretreatment increased DNase activity to normal levels in 5 samples, implying that the removal of serum elements with affinity for the dye had restored DNase activity in patients with very low functional levels (Figure 2C).
Mutations of DNASE1L3
One patient (indicated by a triangle in Figure 2A) was found to carry the c.289-290delAC homozygous variant of DNASE1L3. He was a boy of 10 years who presented a severe form of LN that progressed very rapidly to endstage renal failure. After a few months of hemodialysis he received a renal transplant. Details on the clinical outcome and on therapies will be reported separately.
Circulating levels of DNASE1 and DNASE1L3
The serum levels of these 2 enzymes that are for NET removal23,24 were similar in patients with LN and SLE and in healthy controls (Figure 3A, 3B). DNASE1 and DNASE1L3 levels were not correlated with serum NET or with DNase activity (Supplementary Figures 2A, 2B, 2C, available with the online version of the article). Actually, DNASE1L3 levels showed a broad variation both in iLN and controls: levels were almost 0 in a few cases; the carrier of the c.289-290delAC homozygous variant (indicated with an arrow in Figure 3B) had low levels. DNASE1 and DNASE1L3 levels did not correlate (Figure 3C). This means that there is no “compensatory effect” between the 2 enzymes, suggesting that there are different mechanisms regulating their expression.

DNase1 and DNASE1L3 levels. A. DNase1 serum levels. A homemade ELISA assay was used to test DNase1. Results are expressed as ng/ml and represented as median and IQR. B. DNASE1L3 serum levels. For DNASE1L3 we used a commercial ELISA (LSBio kit). Results expressed as ng/ml are given as median and IQR. In this case, those patients with LN who presented maximal variability in DNase activity were chosen for testing DNASE1L3 levels, including patients with low and patients with high DNase activity. The arrow indicates the carrier of the c.289-290delAC homozygous variant. For the broad distribution of values, ROC and normal limits were not calculated. C. Lack of correlation between serum levels of DNase1 and DNASE1L3 in the cohorts of patients and controls who underwent the analysis of both enzymes. The arrow indicates levels of DNase1 and DNASE1L3 in the carrier of the c.289_290delAC homozygous variant in DNASE1L3. LN: lupus nephritis; SLE: systemic lupus erythematosus; ROC: receiver-operating characteristic; IQR: interquartile range.
Ex vivo NET formation
We studied ex vivo NET production by neutrophils obtained from subsets of patients recruited in the main study (neutrophils from 15 iSLE, 18 iLN, and 27 controls) in 2 ways: by determining the release of elastase and DNA from neutrophils stimulated with PMA; and by staining for histones 1–3 and DNA neutrophils stimulated by patient and control sera.
Resting neutrophils from patients with SLE and LN released lower levels of elastase than did control cells; after stimulation with PMA, the elastase release increased significantly in the 3 groups, with control neutrophils still presenting the major increment (Figure 4A). DNA and elastase released from stimulated neutrophils were highly correlated (Figure 4B), suggesting that elastase reflects the DNA-NET complex.
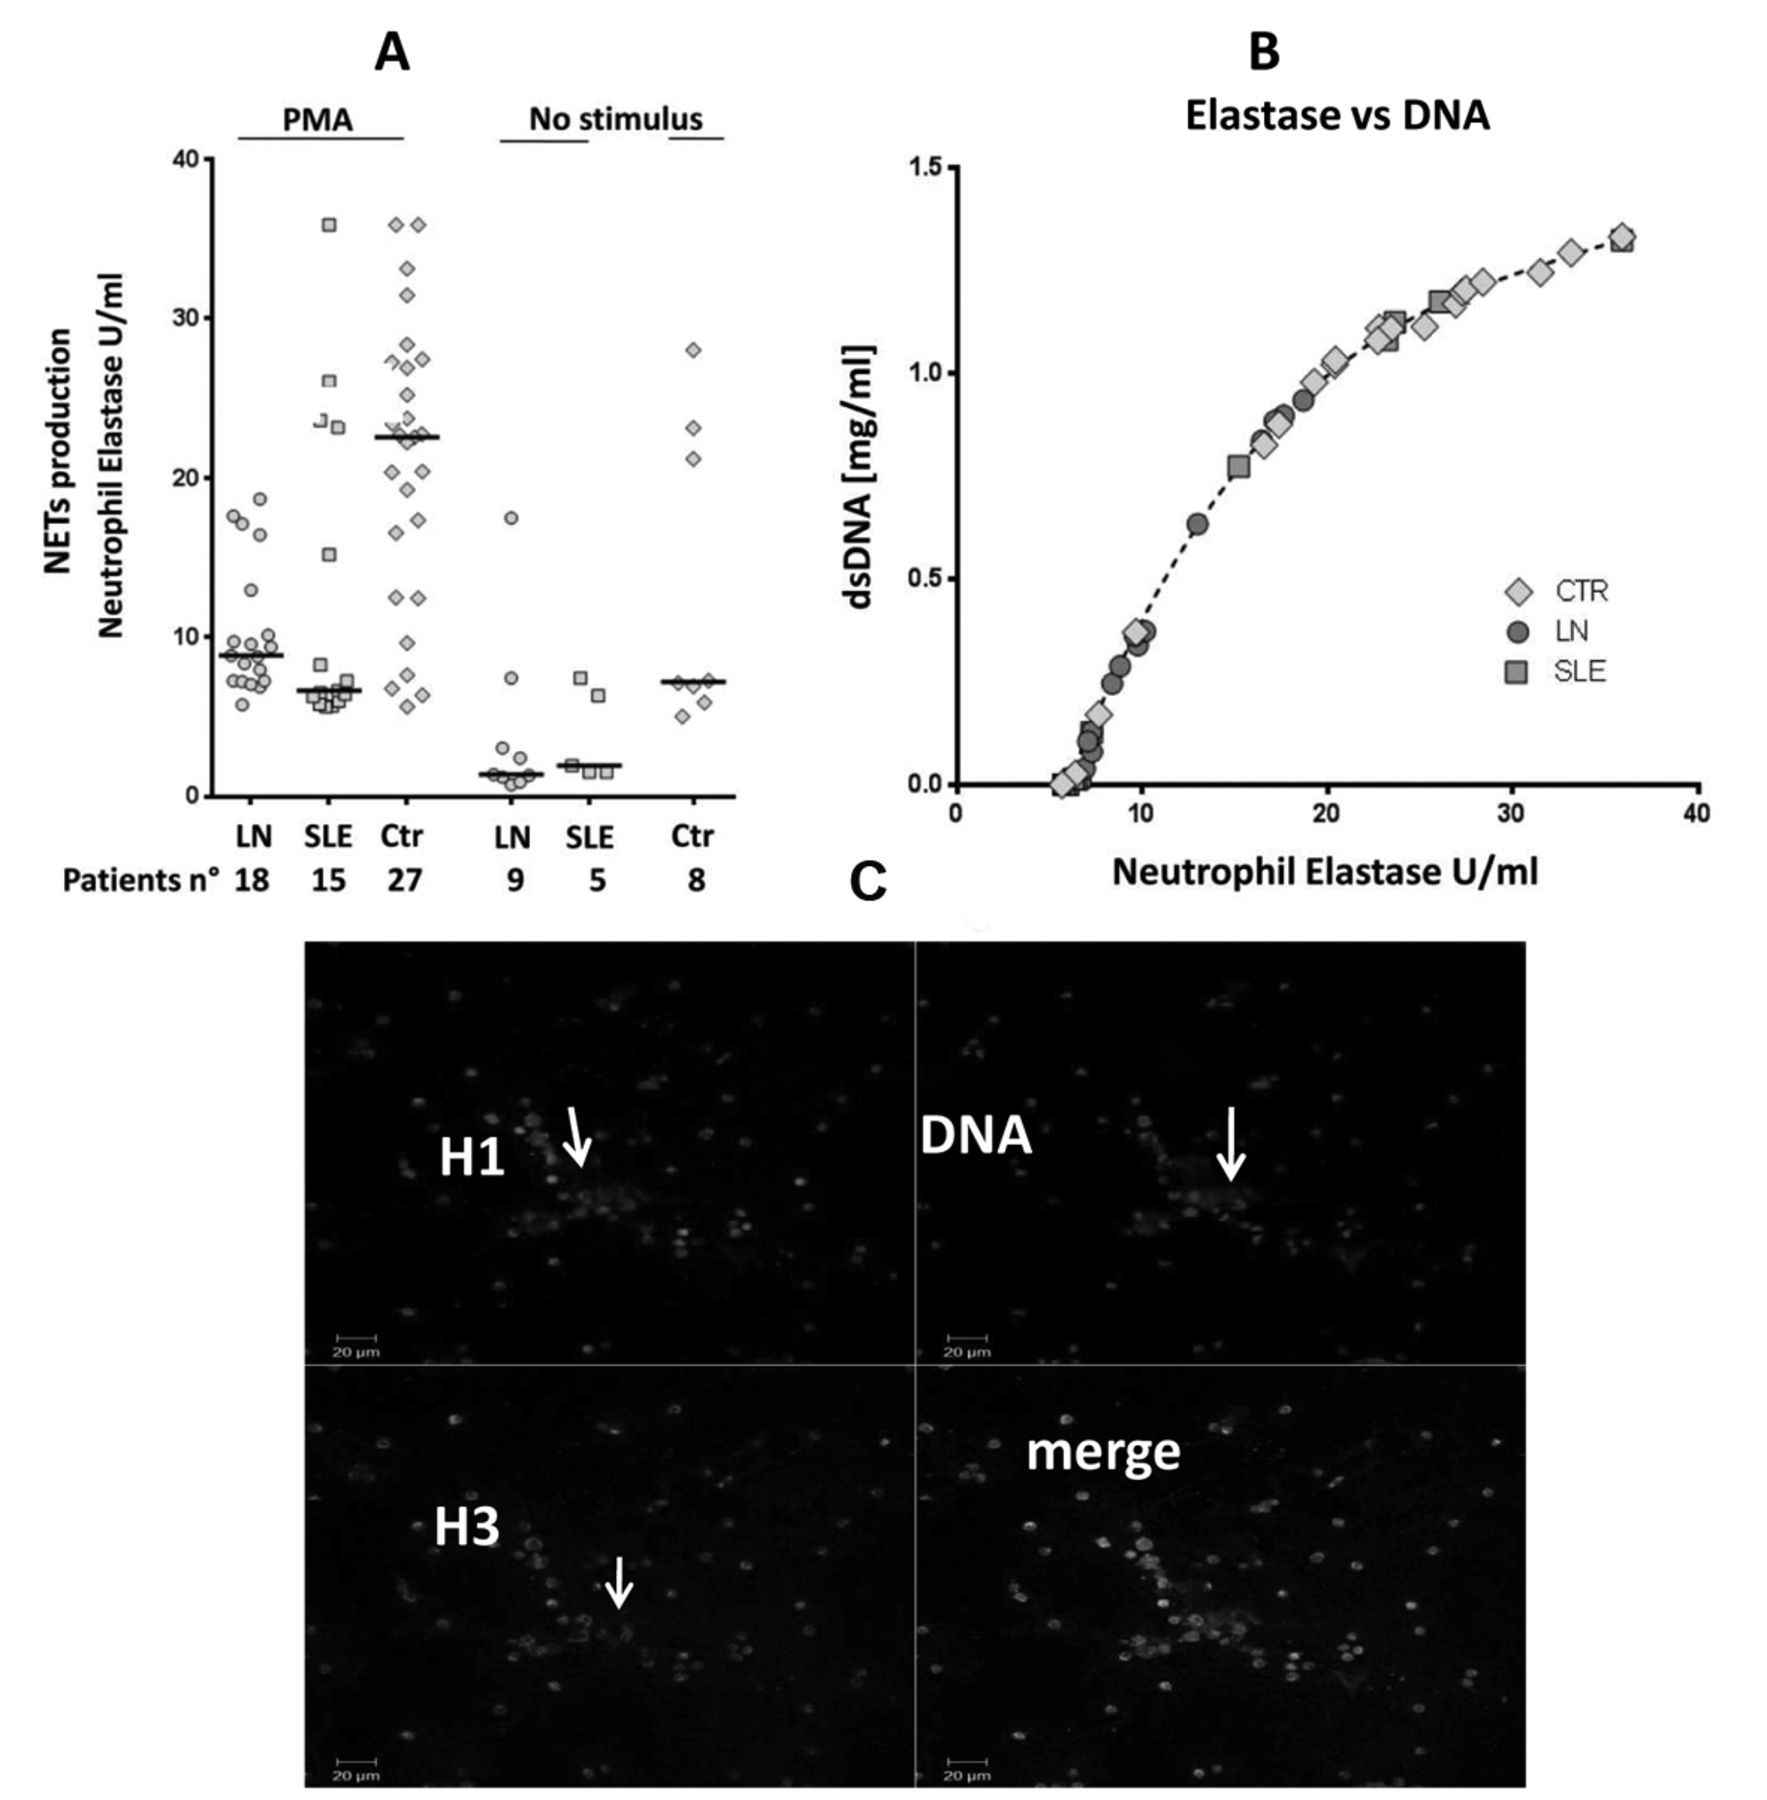
NET production and protein composition. A. Ex vivo NET formation was evaluated as elastase and DNA release by resting neutrophils purified from patients with SLE (n = 5), LN (n = 9), and from healthy controls (n = 8). More cells (15 SLE, 18 LN, and 27 controls) were used for stimulation with phorbol-12-myristate-13-acetate (PMA). Kinetics of NET formation was analyzed in all supernatants using the elastase method13. B. In all experiments the release of elastase from stimulated neutrophils was highly correlated with the release of DNA. C. Ex vivo NET production by isolated neutrophils purified from patients with SLE and stimulated with the homologous serum. Immunofluorescence for histone 1 and 3 and staining for DNA are described in Supplementary Methods (available with the online version of this article). Arrows indicate the presence of extracellular material containing histone 1, histone 3, and DNA; this material corresponds to NET. NET: neutrophil extracellular traps; LN: lupus nephritis; SLE: systemic lupus erythematosus; Ctr: controls.
After stimulation with SLE and control sera, the same neutrophils produced extracellular traps containing histone 1, histone 3, and DNA (Figure 4C). Results were not quantitative and did not allow a clear discrimination between different sera and cells.
DISCUSSION
Modifications of the mechanisms regulating NETosis have been associated with autoimmunity based on the concept that DNA and posttranslational modified proteins in NET may become antigenic6,7,8. Failure of NET removal has been, in particular, considered a trigger for developing renal lesions (LN) in patients with SLE13. LN is an autoimmune condition that develops in about 50% of all patients with SLE25,26 and causes endstage renal failure in a significant portion of this cohort. In this study, we investigated NET formation/removal in patients with SLE, seeking to define whether the kinetics of NET are different in those patients who develop LN. We used a large population of patients with incident SLE/LN that included patients recruited at the time of the onset of symptoms, and for iLN, at the time of renal biopsy. For the large number of patients, iLN was also subdivided into cases with LN as first symptom or iLN occurring in patients with an already known diagnosis of SLE.
We report here new findings regarding NETosis and its correlation with autoimmunity and with renal manifestations of SLE: (1) circulating serum NET remnants were high in LN and SLE compared to other control groups and correlated with proteinuria, and the increment was more evident in iLN; (2) serum NET correlated with anti-dsDNA, C3, and C4 but not with SLEDAI-2K; (3) a significant reduction of DNase activity was observed that was limited to patients with LN, even though serum DNASE1/DNASE1L3 levels were normal, and inhibitors of DNase activity were shown in a few cases; one boy had a c.289_290delAC homozygous variant in DNASE1L3. Therefore, increasing NET levels seem to be the result of a multifactorial mechanism that includes increased autoimmune activity (that should reflect increased production) and failure to remove DNA.
To the best of our knowledge, this is the first study showing a marked increase of circulating NET in a large cohort of patients with incipient SLE and in particular in patients with incipient LN. The latter finding is of particular interest, suggesting that serum NET are in some way involved or participate in the pathogenesis of renal lesions. On the contrary, NET levels did not correlate with clinical signs of acute SLE activity such as the SLEDAI-2K index, thus representing a variable that indicates activity in the long term.
Ex vivo studies with isolated and PMA-stimulated neutrophils did not show increased production of NET in LN and SLE. Qualitative assays with neutrophils stimulated with various sera showed extracellular expression DNA and histones in all conditions but could not add any quantitative indication. Overall, ex vivo studies using all neutrophils cannot be considered representative of specific subsets of activated neutrophils27 and are not conclusive.
A main finding presented here is that DNase activity is defective in patients with LN. Digestion of circulating DNA and of DNA in NET is mediated by DNASE1 and DNASE1L328. In our patients, serum DNASE1 and DNASE1L3 levels were normal (albeit within a broad range in different cohorts) and no correlation was found between serum DNASE1 and/or DNASE1L3 levels, suggesting that the 2 enzymes are not substitutes for each other and are regulated by separate mechanisms. The only study available in the literature reported low DNASE1 activity serum in 23 patients with SLE who were studied in combination with patients with microscopic polyangiitis29. No data are available relative to serum levels of DNASE1IL3. Other authors13,30 have shown the existence of circulating anti-NET antibodies that inhibit DNASE in a subset of patients with SLE, defined as non-degraders, who were prone to develop LN. Genetic data in humans carrying mutations of DNASE19,31,32,33 and results deriving from molecular manipulation of DNASE in mice28,34,35,36 indicate an association between mutations of DNASE, reduced DNase activity and autoimmune activity, in particular, with the development of renal lesions.
We could confirm here, in a large cohort of patients with LN, that both mechanisms (i.e., presence of inhibitors and genetic defects) modify DNase activity in vivo and that they are associated with a specific phenotype of SLE with renal lesions. Actually, DNase activity was restored by protein A, suggesting that circulating inhibitors of DNASE are probably IgG that have been removed by this protein; this finding confirms and strengthens the original hypothesis by Hakkim, et al13 about the existence of circulating antibodies that reduce NET removal in patients with SLE who are prone to develop nephritis. A c.289_290delAC homozygous variant in DNASE1L3 has been detected in a young boy (the youngest of the entire cohort) who presented a very early development of LN and rapid evolution to endstage renal failure. The same mutation of DNASE1L3 has already been described in a few other children with early-onset hypocomplementemic urticarial vasculitis with glomerulonephritis31. Overall, it seems reasonable that molecular defects should be detected in young people, whereas circulating inhibitors usually occur at an older age. Considering the different clinical approaches that should be used in the 2 different conditions (i.e., in presence of inhibitory substances vs molecular defects), we propose here to introduce both the determination of serum NET remnants and the functional analysis of DNase as screening tests in clinical settings. In those cases that present low DNase activity (and we suggest only in this subset of patients) it would be useful to proceed with the characterization of circulating inhibitors and with molecular sequencing of DNASE1 and DNASE1L3.
Our results show a relationship between NET levels and removal with LN in patients with SLE. The present data on reduced DNase activity also support the idea that, in some cases and specifically in patients with nephritis, NET accumulate in serum for a defective removal, and circulating inhibitors of DNase activity are potentially responsible for this phenomenon. More rare mutations in DNASE1L3 produce similar modifications. Altogether, these findings on NET remnant levels and their kinetics of production and removal represent a further advancement, with new diagnostic and therapeutic potential implications.
Acknowledgment
We thank Prof. Yanick Crow (Laboratory of Neurogenetics and Neuro-inflammation at the Image-Institut des maladies genetiques, Paris) for the molecular analysis of DNASE1L3. Thanks also to all the Zeus study participants (doctors, nurses, laboratory personnel) and to all patients who agreed to be enrolled.
Footnotes
Supported by a grant from Fondazione Lupus Italia 2014. Further support from the Fondazione Malattie Renali del Bambino and grant no. ROL 9849 from Compagnia di San Paolo. PC is the recipient of US National Institutes of Health R01 grant AI132949.
- Accepted for publication April 24, 2019.
REFERENCES
ONLINE SUPPLEMENT
Supplementary material accompanies the online version of this article.


