

Abstract
Objective The present study aimed to identify trajectories of physical activity (PA) components (frequency, duration, intensity, and type) and screen-based sedentary behavior (SB) as well as baseline predictors of each trajectory in patients with hip and/or knee osteoarthritis (OA).
Methods We included 878 patients with a 5-year follow-up from the KHOALA cohort. PA and SB were measured by the Modifiable Activity Questionnaire. We used group-based trajectory analysis to identify the trajectories of PA components and screen-based SB, and multivariable logistic regression to determine predictors of the identified trajectories.
Results Two groups of trajectories were identified for each PA component and 3 for SB. High and decreasing PA duration was associated with female sex (OR 0.3, 95% CI 0.1–0.5) as was low and stable, more so than high and decreasing prevalence of weight-bearing activities (OR 0.6, 95% CI 0.4–0.9). Patients with impaired patient-reported outcome measures and obese patients often featured low versus high and decreasing prevalence of weight-bearing activities. Predictors of moderate and high versus low and slightly increasing screen-based SB trajectories were male sex, age < 60 years, single status (OR 1.5, 95% CI 1.1–2.1), obesity (OR 2.1, 95% CI 1.4–3.1), smoking (OR 2.0, 95% CI 1.1–3.7), and less physical jobs. Predictors of moderate and high versus low screen-based SB trajectories were all sociodemographic: male sex, age < 60 years, single status, obesity, smoking, and less physical jobs.
Conclusion Sociodemographic and clinical predictors of trajectories vary between PA components; they are associated mainly with PA frequency and type. No clinical characteristics were associated with screen-based SB.
Osteoarthritis (OA) is the most common form of arthritis, and knee and/or hip OA has been ranked as the 13th highest contributor to global disability in the Global Burden of Disease study1,2. Being physically active and less sedentary plays a major role in reducing OA symptoms, physical function impairment, and pain, and can improve quality of life (QOL)3. Further, regular physical activity (PA) is associated with decreased risk of cardiovascular mortality in this population4. Despite these potential health benefits, several studies have shown that the recommended levels of PA are less likely to be met by adults with OA than those without OA5,6,7, and the former spend even more time in sedentary behavior (SB) than the general population8.
All the above-mentioned studies considered the average level of PA of the sample over a predefined time and so did not consider several distinct patterns that may be present within that sample or whether these behaviors change over time. However, several studies have reported the presence of various subgroups of PA trajectories in the general population9, specifically populations such as women10 and in certain diseases such as rheumatoid arthritis11 or heart disease12. Indeed, a recent systematic review including 27 longitudinal studies reported the presence of various PA subgroups in the general population, varying most commonly between 3 or 4 trajectory groups9. Considering that the course of OA is heterogeneous, with some patients having stable or even improved disease over many years and others showing increasing pain, disability, or structural damage13, it is not surprising that PA practice and SB can vary across patients with OA and over time.
However, to date, no studies have examined the presence of common trajectories of PA or SB across representative cohorts of people with OA. In this context, the aims of the present study were to identify and describe trajectories of PA components (i.e., frequency, duration, intensity, and type) and screen-based SB over a 5-year follow-up period and to identify baseline predictors for each trajectory in a representative cohort of patients with symptomatic hip and/or knee OA.
MATERIALS AND METHODS
The KHOALA cohort
The Knee and Hip Osteoarthritis Long-term Assessment (KHOALA)14 cohort is an ongoing, multiregional, population-based cohort. It included 878 patients aged 40–75 years with uni- or bilateral symptomatic hip and/or knee OA [American College of Rheumatology (ACR) criteria] and a Kellgren-Lawrence grade 2 or greater. Patients were recruited from a national prevalence survey conducted in France from April 2007 to March 200915 and were followed up every year by the use of a self-reporting questionnaire and a clinical examination at baseline and Years 3 and 5. For the purpose of this study, we used data collected at inclusion and each year of follow-up.
All patients gave their written informed consent to be in the KHOALA study. The ethics committee CPP Est III approved the cohort study (no. 07.01.01) registered at ClinicalTrials.gov (no. NCT00481338).
Outcome measures: Physical activity and sedentary behavior
Patients self-reported PA and SB at inclusion and 1, 2, 3, 4, and 5 years’ follow-up by using the Modifiable Activity Questionnaire16. The questionnaire assesses leisure time PA during the previous 12 months. Patients were asked to indicate the types of PA they had performed, number of months, average number of times per month, and number of minutes spent in an activity. The questionnaire also uses time spent daily watching television and using a computer as an indicator of screen-based SB.
For each participant and each year of follow-up, the frequency of PA was defined as the number of times the patient participated in the PA per week, and the duration as the number of hours per week of PA declared. The intensity was expressed by a continuous variable representing the average metabolic equivalent of task (MET) of PA declared based on the 2011 Compendium of Physical Activities. The type of PA was defined in 2 categories: patients practicing at least 1 weight-bearing (WB) activity and patients practicing only reduced WB (RWB) activities. WB activities such as running or playing tennis are defined as force-generating exercises placing higher mechanical stress on the human skeleton than daily living. RWB activities such as swimming or horseback riding generate load below that associated with activities of daily living. These are activities during which individuals do not support their own weight17.
Potential predictors
Two different types of predictors were examined at baseline: sociodemographic factors, and clinical and patient-reported outcome measure (PROM) factors.
The sociodemographic factors included sex (female/male), age (40–49, 50–59, ≥ 60 yrs), education level (primary, secondary, or university), marital status (in a couple or single), socioprofessional category (farmer, artisan, trader; executive, intellectual profession; intermediate occupation; employee; without professional activity), smoking status (yes/no), alcohol consumption (yes/no), monthly income (low, intermediate, high), geographical zone in France (north, west, south), and size of the residential area (< 2000, 2000–49,999, or ≥ 50,000 inhabitants). All the above-mentioned variables were treated as categorical variables.
Clinical and PROM factors consisted of affected joint, BMI (normal < 25 kg/m2, overweight 25–29.9 kg/m2, or obese ≥ 30 kg/m2) based on measured height and weight, Kellgren-Lawrence grade (grade 2, 3, or 4), and comorbidities (Functional Comorbidity Index; FCI)18. Patients reported the date of first symptoms (month and year) and the duration between symptom onset, and inclusion was calculated accordingly. The overall level of hip or knee pain was measured on a visual analog scale (VAS) with scores ranging from 0 (no pain) to 10 (unbearable pain) by answering the following question: “What is the overall level of your hip/knee pain under any circumstances in the past 48 hours?” The Western Ontario and McMaster Universities Osteoarthritis Index (WOMAC) was used to measure physical function, pain, and stiffness, with scores ranging from 0 (best state) to 100 (worst state)19. QOL was measured by the vitality dimension of the Medical Outcomes Study 36-item Short Form survey (SF-36) and by the 5 dimensions of the OA Knee and Hip QOL (OAKHQOL) questionnaire: PA, mental health, pain, social functioning, and social support20,21. Scores for both instruments range from 0 (worst state) to 100 (best state). The General Health Questionnaire 28 [scores from 0 (best state) to 84 (worst state)] was used to assess somatic symptoms, anxiety and insomnia, social dysfunction, and severe depression22. The environmental health domain of the World Health Organization QOL (WHOQOL-BREF) scale was used to assess environmental factors23.
Statistical methods
Statistical analyses involved different steps. First, patient characteristics were described with mean (SD) for quantitative variables and number (percentages) for categorical variables. Second, a semiparametric, group-based trajectory model was used to evaluate subgroups that followed similar trajectories in each PA component and screen-based SB, based on identifying heterogeneous longitudinal polynomial trajectories using the TRAJ procedure of SAS v9.4 (SAS Institute, Inc.)24. The optimal number of groups and degree of polynomial function in each trajectory group were determined by using the Bayesian information criterion (BIC): a lower BIC value indicates a better fitting model. Other criteria such as the proportion of patients in each trajectory group (> 5%) and the clinical interpretability of the identified trajectories were also considered. We fitted 5 models of trajectories: PA frequency, intensity, time, type, and screen-based SB. To check the robustness of the final optimized models, we used the average of the posterior probabilities of group membership for individuals assessing the fit of the models25. Description of missing data for PA components and SB are presented in Supplementary Tables 1 and 2 (available from the authors on request). Missing data were characterized by using the SAS macro %missingPattern26, and their mechanism was assessed by searching for evidence of monotonicity and unit nonresponse. A sensitivity analysis using patients without missing data was also performed. Third, multivariable logistic regression analysis was used to identify baseline predictors of trajectory membership for each model, estimating OR and 95% CI. Factors including sex, age, education level, marital status, socioprofessional category, smoking status, alcohol consumption, monthly income, geographical zone in France, size of the residential area, affected joint, duration between onset of symptoms and inclusion, BMI, FCI, WOMAC, SF-36, VAS, and OAKHQOL questionnaires were tested in bivariate analysis. Because the linearity assumption for logistic regression was violated, data for WOMAC, SF-36, VAS, and OAKHQOL questionnaires were categorized into tertiles. Only factors with a significant association at P = 0.2 in bivariate models were entered into multivariable models. We used stepwise variable selection with significance level P = 0.1 for entry into the model and P = 0.05 for staying in the model. P < 0.05 was considered statistically significant. Analyses involved the use of SAS v9.4 (SAS Institute Inc.).
RESULTS
Descriptive analysis
Sociodemographic and clinical data for the 878 patients included are in Table 1. At baseline, the mean (SD) duration of moderate intensity PA was 3.9 (4.5) h/week, frequency was 4.3 (3.6) times/week, and intensity was 4.2 (0.8) MET (Table 1). The most frequent PA was walking for pleasure (29.7%), gardening (22.8%), bicycling for pleasure (8.2%), and swimming (7.9%).
Baseline patient characteristics (N = 878).
Identified group-based trajectories
We observed no structured missing data pattern, such as monotonicity or unit non response, for outcomes criteria. Accordingly, data were considered missing at random and were included in the analyses as allowed when using group-based trajectory modeling without requiring imputation, because this model handles missing data by using maximum likelihood estimation25. Restricting the analysis to patients with complete data did not alter the number or size of the observed trajectory pattern groups (Supplementary Figures 1 and 2, available from the authors on request).
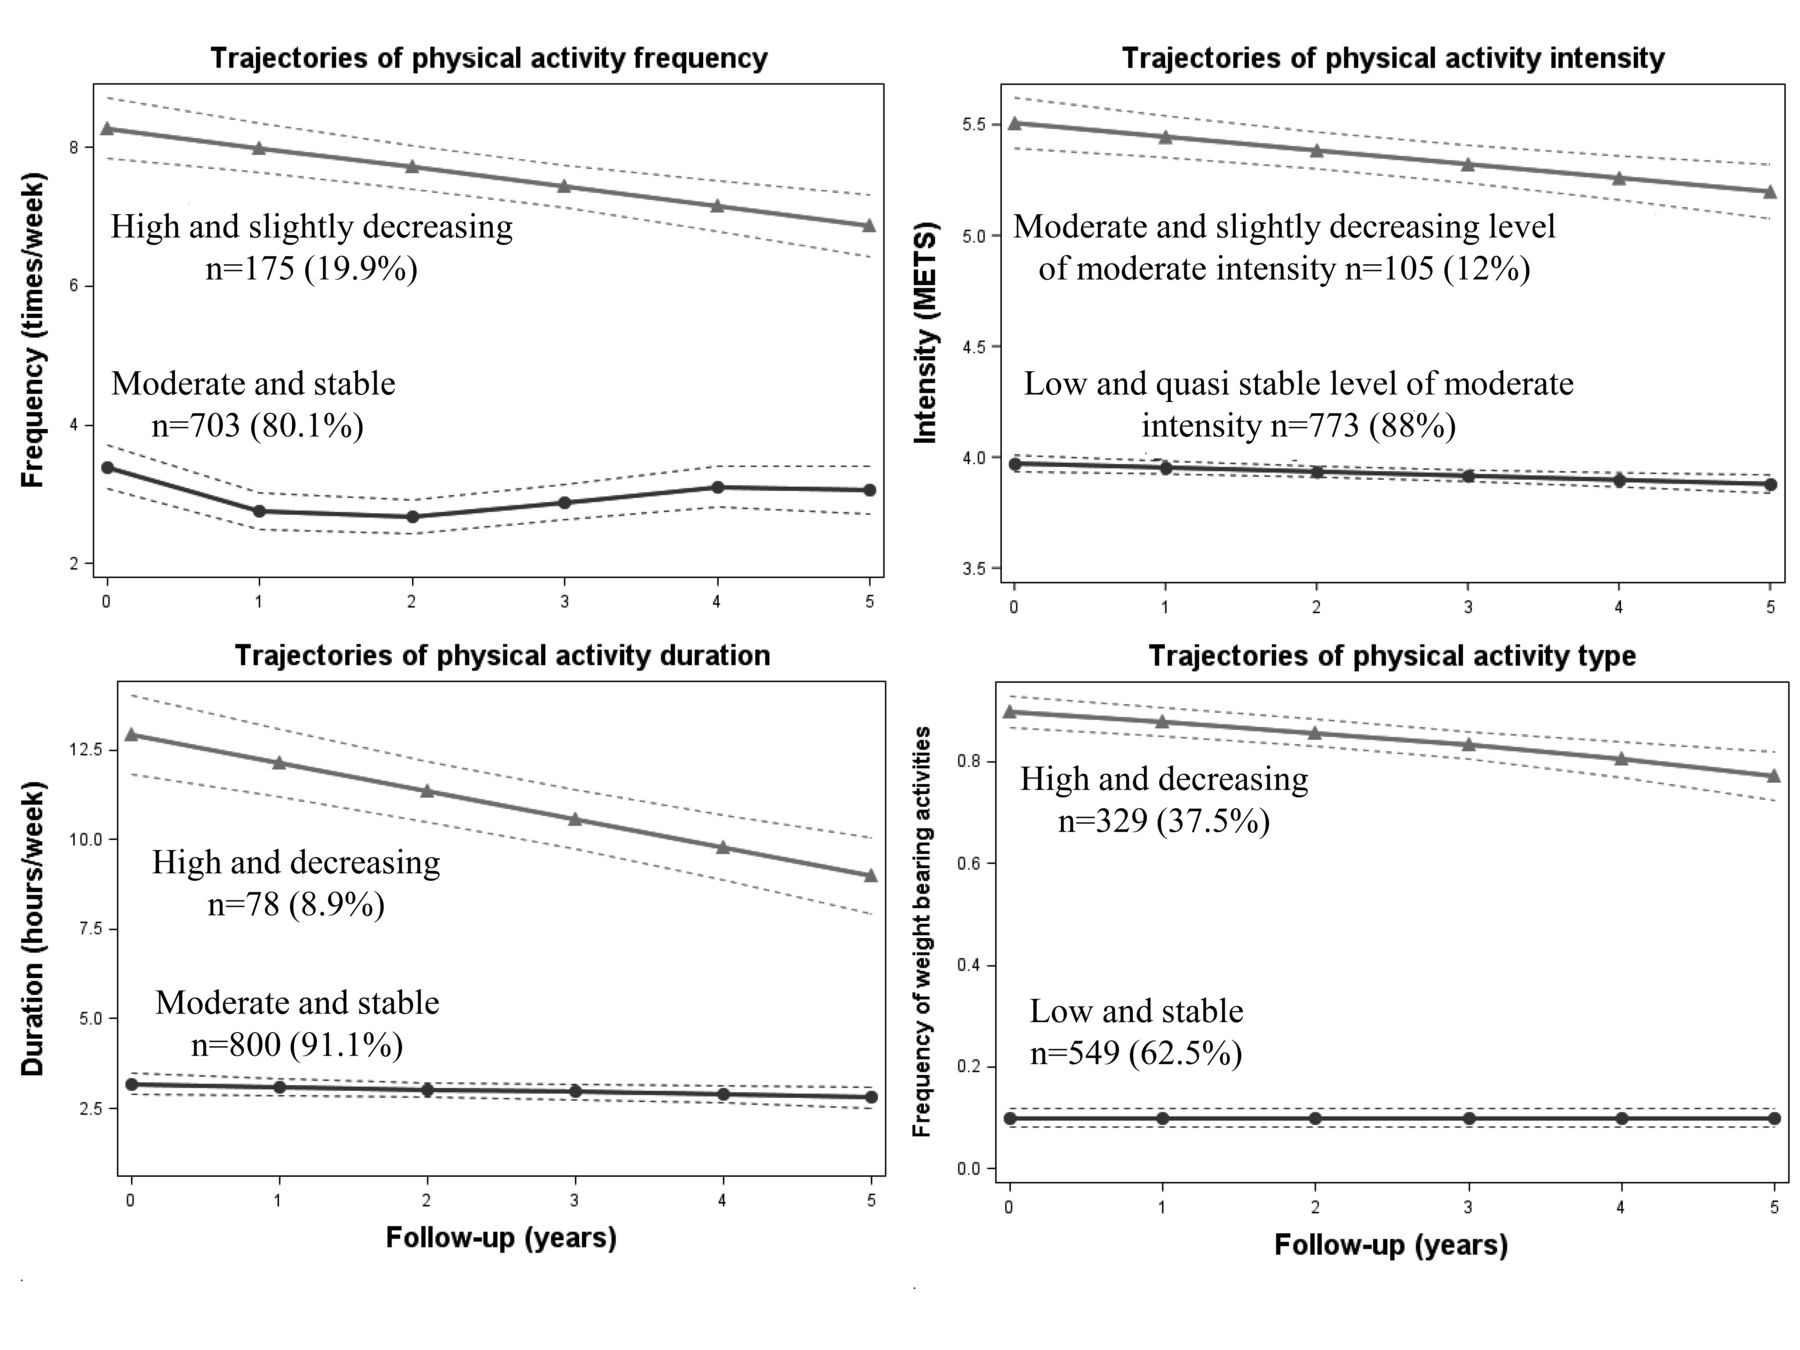
Two trajectories were identified for each PA component and 3 for screen-based SB (Figure 1 and Figure 2). With these, the average posterior probability of group membership for individuals assigned to each trajectory was > 0.8 (95% CI 0.82–0.98; Supplementary Table 1, available from the authors on request).
Trajectories of frequency: (1) moderate and stable frequency (n = 703; 80.1%) represented a mean PA frequency of 3 times/week; and (2) high and slightly decreasing frequency (n = 175; 19.9%), a frequency of 8 times/week at inclusion, which decreased to 7 times/week at 5-year follow-up.
Trajectories of intensity: (1) low and quasi-stable level of moderate intensity (n = 773; 88%) represented a mean of 4 MET during follow-up; and (2) moderate and slightly decreasing level of moderate intensity (n = 105; 12%) represented intensity slightly decreased from 5.5 MET at inclusion to 5 MET at 5-year follow-up.
Trajectories of duration: (1) moderate and stable duration (n = 800; 91.1%) represented a mean duration of 3 h/week; and (2) high and decreasing duration (n = 78; 8.9%) represented a duration decreased from 12.9 h/week at inclusion to 3 h/week at 5-year follow-up.
Trajectories of type: (1) low and stable frequency of WB activities (n = 549; 62.5%) represented stable prevalence of WB activities at 9% during follow-up; and (2) high and decreasing frequency of WB activities (n = 329; 37.5%) represented decreased prevalence from 89.7% at inclusion to 77.2% at 5-year follow up.
Trajectories of screen-based SB: (1) low and slightly increasing SB (n = 500; 57.1%) represented screen-based SB slightly increased from 2.8 at inclusion to 3.2 h/day at 5-year follow-up; (2) moderate and slightly increasing SB (n = 290; 33%) represented screen-based SB slightly increased from 4.9 at inclusion to 5.3 h/day at 5-year follow-up; and (3) high and stable SB (n = 88; 10%) represented screen-based SB stable at 8.4 h/day during follow-up.

Identified trajectories of physical activity components. MET: metabolic equivalent of task.

Identified trajectories of sedentary behavior.
Predictors of physical activity and screen-based sedentary behavior trajectories
Results of bivariate associations are in Supplementary Tables 3 and 4 (available from the authors on request). Predictors of PA components and SB from multivariable logistic regression are in Table 2 and Table 3, respectively.
Factors associated with physical activity frequency and type trajectories derived from the multivariable logistic regression.
Factors associated with sedentary behavior trajectories derived from the multivariable logistic regression.
For trajectories of intensity, no sociodemographic or clinical factors were statistically significant in the multivariable logistic regression model.
For trajectories of duration, only sex was a predictor for duration trajectories. Females belonged mostly to the moderate and stable trajectories more so than to the high and decreasing group (OR 0.3, 95% CI 0.1–0.5, P < 0.0001).
For trajectories of frequency, the probability of belonging to the high and slightly decreasing rather than the moderate and stable trajectory was associated with age (≥ 60 yrs), low monthly income level (OR 0.5, 95% CI 0.3–0.9, P = 0.02), and improved WOMAC physical function (OR 0.4, 95% CI 0.3–0.7, P = 0.0007; Table 2).
For trajectories of type of PA, the probability of belonging to the high and decreasing versus stable frequency of WB activities was reduced with female sex (OR 0.6, 95% CI 0.4–0.9, P = 0.007) and obesity (OR 0.5, 95% CI 0.3–0.9, P = 0.007), and with better SF-36 vitality level (OR 2.2, 95% CI 1.3–3.8, P = 0.004), OAKHQOL physical function score (OR 2.1, 95% CI 1.1–3.9, P = 0.03), and WOMAC physical function score (OR 0.5, 95% CI 0.3–0.8, P = 0.02], and improved pain VAS level (OR 0.4, 95% CI 0.3–0.7, P = 0.002; Table 2).
For trajectories of screen-based SB, the probability of belonging to the high and stable versus low and slightly increasing trajectory was associated with being single (OR 1.8, 95% CI 1.1–2.9, P = 0.02), a smoker (OR 2.0, 95% CI 1.1–3.7, P = 0.02), and age 60 years or greater (OR 0.4, 95% CI 0.2–0.9, P = 0.01). As well, the probability of belonging to the moderate and slightly increasing versus low and slightly increasing trajectory was associated with being single (OR 1.5, 95% CI 1.1–2.1, P = 0.01), and was reduced with female sex (OR 0.7, 95% CI 0.5–1.0, P = 0.02) and obesity (OR 2.1, 95% CI 1.4–3.1, P = 0.002; Table 3).
DISCUSSION
In this current investigation of the trajectories of PA and SB over time in patients with OA, we report 2 major findings. First, in general, patients with OA were distributed between 2 distinct trajectories for each PA component (a low to moderate stable trajectory including most patients, and a high decreasing trajectory with a few patients), and 3 distinct trajectories of SB (low, moderate, and high level of screen-based SB). Second, determinants of trajectories differed according to the PA components, confirming that PA involves complex and multidimensional behavior4. These determinants were mostly predictors of the frequency and type of PA trajectories. The lack of significance for the association with PA duration despite a significant association in the bivariate analysis may be due to the small sample size of the high and decreasing duration trajectory versus the moderate and stable trajectory (9% vs 91%), and future studies investigating this association are needed to confirm our results. Patients with impaired PROM and obese patients more often featured a lower prevalence of WB activities. Women more often showed a moderate and stable PA duration and lower and stable prevalence of WB activities. Predictors of moderate and higher screen-based SB trajectories were all sociodemographic, including male sex, age < 60 years, single status, obesity, smoking, and less physical jobs.
To our knowledge, this is the first study using longitudinal data to describe the trajectories of PA components and SB over a long time in a well-defined sample of people with hip and/or knee OA. This innovative method, group-based trajectory modeling, has been used in more recent studies investigating PA levels among the general adult population and in specific populations with heart disease and breast cancer, but has not been used in OA10,12,27.
Our results agree with previous findings for older adults showing the presence of stable and decreasing trajectories of PA, with stable trajectories more prevalent than change trajectories9. Our study adds to the existing knowledge by considering the different components of PA in patients with OA.
PA is associated with reduced pain sensitivity among healthy adults28. Despite the potential long-term benefits of PA for patients with hip and/or knee OA, it is often challenging for them to regularly practice because their symptoms can worsen29,30. Our results show that individuals with more impairment, including self-reported pain, functional abilities, and vitality, performed less WB PA. For most, this type of PA is unlikely to be recommended by a health professional because most of the KHOALA patients are followed up by primary care physicians who rarely give advice on types of PA. The perceived functional ability was also a predictor of the frequency of PA, with individuals with higher impairment practicing less frequently. In a systematic review, limited evidence was available to support the association between reduced functional impairment and lower level of PA in hip and knee OA. However, in this review, the PA level definition gave major weight to intensity; as well, the authors did not study PA components and the studies were cross-sectional31. However, results of studies describing PA trajectories in the general population have shown that patients with physical difficulties, disabilities, or poor self-rated health were less likely to follow a persistently active trajectory and more likely to follow a low active or inactive trajectory9. Our results complement these studies by showing that inactivity or low activity in the context of OA results in a lower frequency of PA and less WB PA.
Previous studies describing PA trajectories in the general population have shown active trajectories are more prevalent among males than females32. Our results present new elements in patients with OA, showing that women more often practiced moderate and stable durations of PA than other frequencies of PA and RWB PA. Thus, proposing moderate duration and RWB PA could be appropriate for women and may be more successful. Obese patients more often showed a lower than higher prevalence of WB PA. In fact, RWB activities are selected by obese patients for being more tolerable then WB activities, which involve more loading on the joints33.
Previous work has shown greater pain during PA among OA patients with higher levels of catastrophizing34,35. Without measuring catastrophizing scores but with measuring related psychological measures (anxiety and depression), no relationship with PA components was found. Fatigue was the strongest predictor of reduced subsequent activity in patients with OA in 1 study36. However, vitality, a close concept, did not differ between frequency, duration, or intensity of PA trajectories but was associated with increased frequency of WB PA.
None of the factors predicted the intensity trajectories. Intensity expressed by the metabolic equivalent MET may explain this result. Indeed, MET are defined by the Compendium of Physical Activities37; the compendium does not consider the individual energy cost of PA, which differs especially according to sex and BMI, but instead standardizes the intensities of each PA. However, PA intensity is often of major importance in the outcome criteria chosen to study factors associated with PA level.
SB is detrimental to health, even when recommended levels of PA are reached15. Predictors of moderate and higher screen-based SB trajectories were all sociodemographic (male sex, age < 60 years, single status, obesity, smoking, and less physical jobs). Some of these characteristics were similar to determinants of a sedentary lifestyle in older people without OA38 and to those of inactive trajectories in the general population39. Our PROM were not associated with screen-based SB trajectories. For older women, mobility impairment, depression, and lack of energy were associated with SB10. In a previous OA cross-sectional study, SB was related to worse physical function, but no longitudinal studies have explored the effect of PROM impairment on SB40. Thus, symptoms and clinical severity do not seem to prevent individuals from being less sedentary.
Our study has limitations. PA was assessed with a self-reporting questionnaire, which may have introduced some measurement error. Although in general, our results show compliance with recommendations for PA components, results from other studies using accelerometers showed reduced levels of PA41. However, accelerometers are not appropriate for long-term measurements, and they are not suitable to measure some PA such as water-based activities42. As well, SB measured only the time spent in front of the TV and computer and may therefore underestimate the real sedentary time of patients. However, SB is not a single construct; it involves different types of behavior, and screen time is the most-used type of SB studied.
Identifying diverse trajectory groups using group-based trajectory modeling adds to previous knowledge by providing evidence of the heterogeneity of PA and SB. Thus, this study allowed for understanding the variation that occurs in the frequency, duration, intensity, and types of PA and SB during a 5-year follow-up, as well as the factors relating to belonging to specific trajectory classes. Our results allowed for identifying sociodemographic and clinical predictors, mainly of PA frequency and type of PA trajectories, as well as sociodemographic predictors of SB trajectories. This information can help in planning tailored and well-targeted PA promotion strategies and interventions for the OA population, especially those who are sedentary.
Footnotes
Funding for the KHOALA cohort study was obtained from public sources (INSERM, CHU de Nancy, Conseil Régional de Lorraine, Société Française de Rhumatologie) and unrestricted grants from pharmaceutical companies (Expanscience, Genevrier, Grünenthal, Merck & Co Inc., Pfizer, Pierre Fabre Médicaments, Sanofi-Aventis France). Opinions expressed in the present article are those of the authors and do not necessarily reflect those of the sponsors. The study sponsors did not take part in the study design, collection, analysis, and interpretation of data, writing of the report, or the decision to submit the article for publication.
- Accepted for publication February 28, 2020.


