

Abstract
Objective. To evaluate the utility of contrast-enhanced ultrasound (CEUS) compared with 18F-fluorodeoxyglucose–positron emission tomography (FDG-PET) in assessing vessel inflammation of Takayasu arteritis (TA).
Methods. This is a retrospective analysis of 71 patients with TA who had undergone carotid CEUS. Twenty-two of 71 patients underwent FDG-PET after CEUS. Clinical disease activity was assessed by Kerr criteria and the Indian Takayasu Clinical Activity Score 2010 (ITAS2010). We investigated the correlation between carotid vascularization on CEUS and clinical data. The consistency of carotid CEUS and PET data has been analyzed for TA disease activity.
Results. There was a statistically significant correlation between the results of CEUS and ITAS2010 (p = 0.004) or Kerr criteria (p < 0.001). According to ITAS2010, thirty-four of 71 patients with TA were clinically inactive. Assessment of 34 TA patients with clinically inactive disease yielded 11 CEUS scans that showed active lesions (visual grade ≥ 2) in the left or right carotid artery. In 22 cases that underwent CEUS and FDG-PET, 12 were active and 10 were inactive on the basis of ITAS2010. Moreover, bilateral carotid CEUS vascularization score positively correlated with vascular FDG uptake in these patients with TA (p = 0.004). When vascular inflammation was defined as FDG uptake with visual grade ≥ 2, carotid CEUS showed sensitivity of 100% and specificity of 80%.
Conclusion. For TA patients with clinically inactive disease, CEUS could help clinicians to identify active lesions in the carotid vascular region. Carotid CEUS may be a rapid and cost-effective imaging tool in the followup of patients with TA.
Takayasu arteritis (TA) is a chronic panarteritis, predominantly involving the aorta, its major branches, and the pulmonary arteries. Chronic vasculitis may lead to stenosis, occlusion, dilation, or aneurysm formation. In about 50% of patients with TA, clinical features do not correlate with inflammatory markers, rendering disease activity more difficult to assess1. The lack of a reliable standard for disease activity has limited clinical management and research on TA. Further, routinely applied biomarkers do not accurately distinguish between active and inactive disease2. Clinical evaluation may be performed with the Indian Takayasu Clinical Activity Score 2010 (ITAS2010)3. However, patients with an ITAS2010 indicating inactive disease often experience vascular progression4, and active disease may persist in patients with normal C-reactive protein (CRP) and erythrocyte sedimentation rate (ESR) values5. These criteria do not account for the earliest signs of inflammation within vessel walls.
Accurate evaluation of disease activity is essential for effective treatment of a patient with TA. A reproducible, repeatable marker of disease activity is needed to assess disease activity and monitor the effects of treatment6. With the development of angiography, various noninvasive techniques have been used to facilitate the diagnosis and evaluation of patients with TA7. Techniques applied to the management of TA include computed tomography (CT) angiography (CTA), ultrasonography (US), positron-emission tomography (PET)/CT, and contrast-enhanced magnetic resonance (MR) angiography. In addition, new European League Against Rheumatism recommendations propose that MR imaging to investigate mural inflammation and/or luminal changes should be used as the first imaging test to make a diagnosis for patients with suspected TA, assuming high expertise and prompt availability of the technique8. However, these approaches are not without some shortcomings, including radiation, possible nephrotoxicity due to the iodine contrast media used, and economic considerations9,10,11.
US may be used to diagnose TA and/or reveal prestenotic changes12. In patients with TA, US may uncover concentric arterial wall thickening, which may lead to active arterial wall inflammation and edema13,14. However, the correlation between wall enhancement on US and active arteritis remains to be established. Some clinicians have recently started to use contrast-enhanced US (CEUS) for vascular imaging15. Several studies have shown that CEUS enhances visualization of the vessel lumen as well as the growth of new blood vessels16,17. Carotid CEUS is a novel imaging modality proposed for the assessment of TA. This approach is particularly helpful for quantifying vascularization (vasa vasorum) within the vessel wall18,19. CEUS can visualize the parietal vasa vasorum and quantify carotid wall vascularization; thus it may be an effective noninvasive technique for detecting carotid artery inflammation and monitoring therapeutic interventions in patients with TA.
Few studies have investigated the correlation between CEUS and disease activity in TA. To our knowledge, no report published to date has investigated such a correlation in an Asian population. This study was performed to evaluate evidence of active disease on CEUS and to correlate imaging findings with clinical activity using the ITAS2010/Kerr criteria. The purpose of this study was to evaluate disease activity in TA patients with carotid artery CEUS and to compare the results obtained with CEUS to those obtained with PET.
MATERIALS AND METHODS
The Ethics Committee of Xijing Hospital approved this study (KY20163015-1). All subjects provided written informed consent prior to participation.
Patients
Seventy-one consecutive patients with TA (60 women and 11 men aged ≥ 18 yrs) were recruited for the study. All patients fulfilled criteria from the American College of Rheumatology for TA5. Any patient was excluded if they had giant cell arteritis, Behçet disease, Cogan syndrome, Kawasaki disease, Marfan syndrome, Ehler-Danlos syndrome, or infective aortitis, because these diseases may mimic TA. Exclusion criteria were contraindications for use of an US contrast agent, such as severe renal failure (glomerular filtration rate < 30 ml/min/1.73 m2), pregnancy, unstable angina, acute endocarditis, acute cardiac failure, known right-to-left shunts, and known allergy to microbubble contrast agents. Based on the reported accuracy of CT and MR imaging for the diagnosis of TA, either CT angiography or MR angiography was performed, instead of conventional angiography20,21. Patients included in the study represented a cross-section of all such individuals seen at our institution during the period from December 2016 to July 2017. All patients included in the study underwent CEUS, and 22/71 underwent PET/CT. All CEUS and PET/CT studies were accomplished without complication.
Clinical data
Imaging data, existing symptoms, and results of the physical examination (including vascular tenderness, pulse, and bruit) were recorded for each patient. Laboratory tests for complete blood count, CRP, and ESR were conducted < 1 week after patients had undergone CEUS and PET/CT imaging. ESR was evaluated by Westergren method. For ESR, normal range was defined as 0–15 mm/h for males and 0–20 mm/h for females. A latex-enhanced immunoturbidimetric assay was used to measure CRP level (ADVIA Chemistry System, Bayer Healthcare AG). Increases in CRP were defined as levels > 0.8 mg/dl. Samples were randomized and analyzed by blinded researchers.
Clinical disease activity in each patient was evaluated based on Kerr criteria22 and ITAS201023. Based on these results, an ITAS2010 of ≥ 5 was classified as active.
Acquisition of carotid US
Carotid CEUS was performed with an iU-22 device (Philips Medical Systems) equipped with an L9-3 transducer. In summary, bilateral carotid arteries were examined with the patient in resupination, with his or her head turned to the contralateral side. For coordination of the US examination, B-mode and CEUS images were displayed side by side. Contrast mode was used to complete the CEUS examination. Other measures were set as follows: compression, 60; gain, 30%; imaging depth, 3.0 cm. These presets were adjusted per patient to obtain optimal quality of the US clips. Researchers adjusted these measures when necessary to acquire optimal US images. CEUS was performed by injecting Sono Vue US contrast agent (Bracco SpA). The bilateral common carotid artery, internal carotid artery, and external carotid artery were evaluated, with close attention to the presence of carotid lesions. Cine clips of carotid artery CEUS were digitally stored and checked offline.
Carotid US analysis
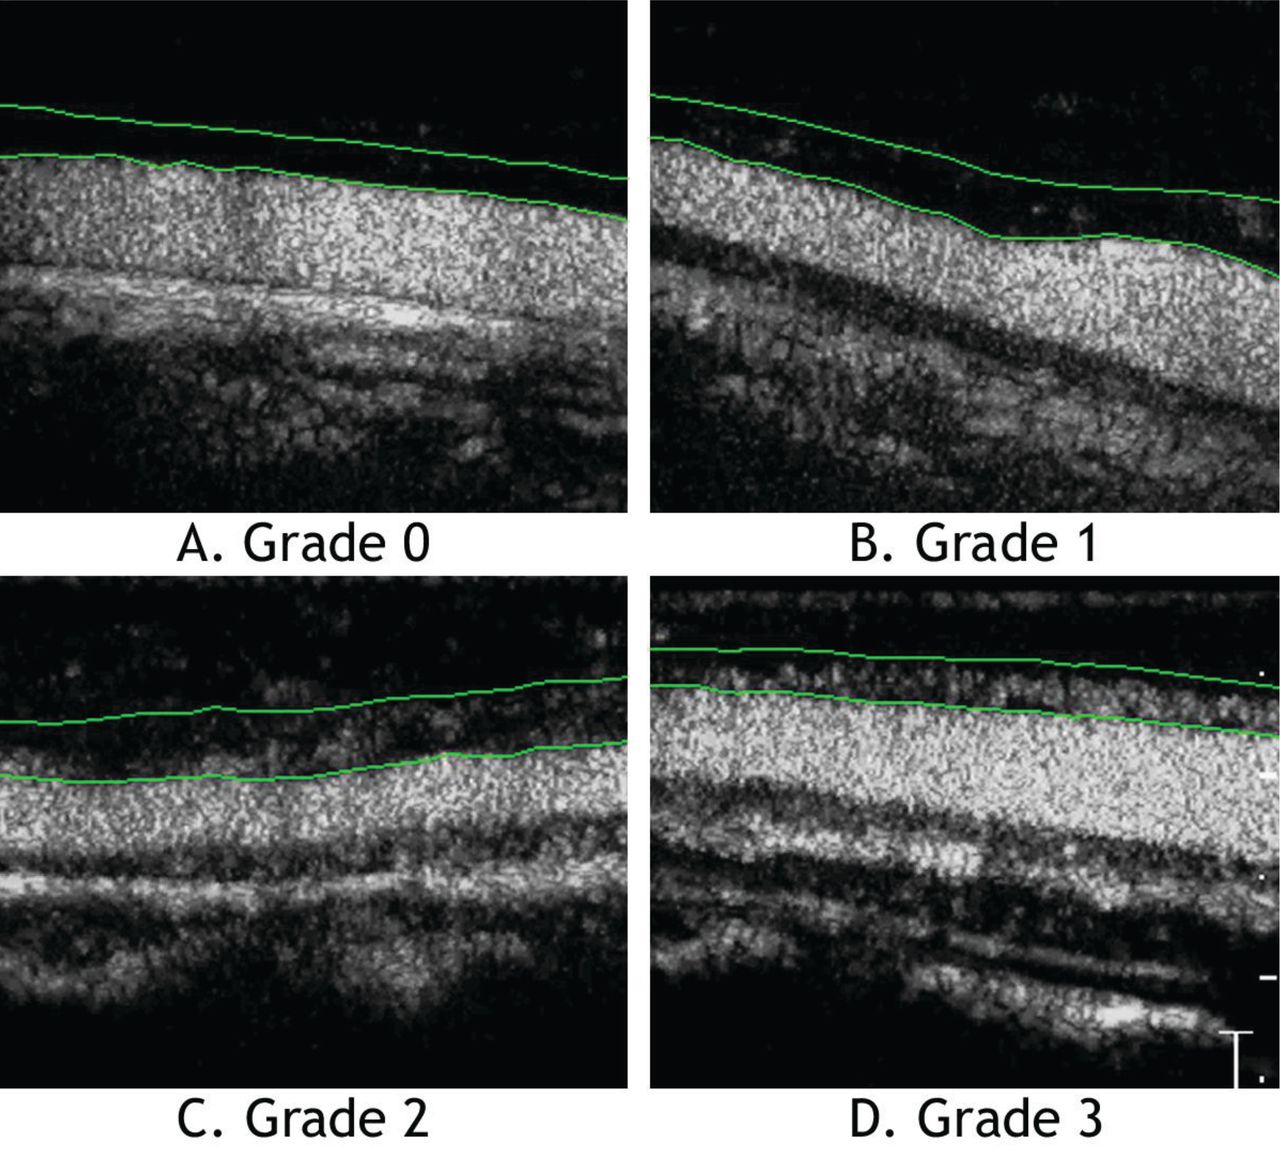
CEUS outcomes were evaluated by 2 independent observers who were unaware of clinical symptoms and laboratory data associated with the individual who had provided a particular sample. In the case of a discrepancy in scores between independent specialists, consensus was achieved through discussion. CEUS clips of carotid arteries were scored according to the extent of wall vascularization. Wall vascularization was visually estimated using a formerly published grading method, as follows: grade 0, no vascularization (no appearance of microbubble contrast agent in the carotid lesion); grade 1, limited vascularization (limited visualization of moving microbubbles in the carotid lesion); grade 2, moderate vascularization (moderate visualization of moving microbubbles in the carotid lesion); and grade 3, severe vascularization (extensive wall vascularization with microbubbles clearly seen)24. Visual grade ≥ 2 was regarded as disease activity for TA. Image examples of different grades of carotid CEUS have been shown in Figure 1.

Degree of intima-adventitia neovascularization (green lines) at carotid contrast-enhanced ultrasound. A. Grade 0: no vascularization (no appearance of microbubble contrast agent in the carotid lesion). B. Grade 1: limited vascularization (limited visualization of moving microbubbles in the carotid lesion). C. Grade 2: moderate vascularization (moderate visualization of moving microbubbles in the carotid lesion). D. Grade 3: severe vascularization (extensive wall vascularization with microbubbles clearly seen).
PET/CT examination
Within 3 days before or after CEUS, 22 out of 71 TA patients underwent 18F-fluorodeoxyglucose (FDG)–PET/CT. FDG-PET images were obtained using a whole-body tomography scanner (Allegro; Philips) with 3.30-min emission scan/bed and correction for CT attenuation. All subjects had fasted for ≥ 4 h before injection of FDG (37 MBq FDG per 13 kg body weight). Prior to examination, each patient was determined to have glucose levels ≤ 200 mg/ml. Average time from injection to collection was 60 min. FDG-PET/CT images were reconstructed through standard company reconstruction algorithms and reviewed by 2 physicians with expertise in nuclear medicine, who had been blinded to clinical data. Any disagreement was resolved through additional review. Standardized uptake value (SUV) was determined on the basis of decay-corrected injected dose, measured activity, and the patient’s body weight. Carotid artery FDG vascular uptake was recorded for each patient. A semiquantitative method was used to analyze maximum and mean SUV values. Visual scores were assigned to each arterial segment using a 4-point scale: 0 = no uptake; 1 = minimal but not negligible uptake (below hepatic levels); 2 = intermediate uptake (similar to hepatic levels); and 3 = intense uptake (higher than hepatic levels). FDG vascular uptake scores ≥ 2 were regarded as positive for vasculitis, and scores < 2 were considered negative for vasculitis.
Data and statistical analysis
Statistical analyses were performed using SPSS software (version 19.0). The degrees of agreement were assessed using a weighted ϰ statistic for the 2 nuclear physicians and 2 independent observers of CEUS, respectively. Quantitative data for normal distribution are shown as mean ± SD. Categorical variables are expressed as number (%). The Mann-Whitney U test was used to compare continuous variables in the active and inactive disease groups. Spearman rank correlation analysis was used to evaluate the correlation between indices used for grading US and clinical and laboratory variables. Sensitivity, specificity, predictive values, and likelihood ratios are presented with 95% CI. P < 0.05 was considered statistically significant.
RESULTS
Descriptive statistics
Patient characteristics are summarized in Table 1. A total of 71 patients were enrolled in the study, with 60 females and 11 males. Ages of those included in the study ranged from 18 to 74 years. Median age was 32 years. Mean disease duration, from the onset of symptoms, was 65.34 ± 66.33 months. Most patients included in the study (81.7%) were within the age range of 21–45 years. The most common type of TA was Type 5 (n = 45; 62.5%).
Clinical characteristics and current medications of patients with Takayasu arteritis (TA).
Sixty-nine patients (97.2%) had previously been treated with glucocorticoid therapy; 63 patients (88.7%) had previously been treated with immunosuppressant therapy (Table 1).
Correlation between findings on CEUS and disease activity
Carotid CEUS revealed vascularization within the right carotid artery wall in 70 patients with TA (97.2%). The severity of vascularization in the wall of the carotid artery was grade 1 in 25 patients, grade 2 in 26 patients, and grade 3 in 19 patients. Scans for 45 of 71 patients who underwent CEUS showed active lesions (visual grade ≥ 2) in the left or right carotid vascular region. Table 1 presents data on clinical disease activity, including the relevant laboratory indices. Interobserver agreement for CEUS score was strong (κ = 0.921).
At the time of the examination, the use of ITAS2010 criteria identified 37 of 71 patients with TA as having active disease. CEUS revealed severe carotid vascularization (visual grade ≥ 2) in the left or right carotid artery for 34 out of 37 patients with clinically active disease, compared to 11 out of 34 subjects without active disease (by the same criteria); the difference was significant (chi-square = 27.06; p < 0.001). The sum score of 2-sided carotid arteries was significantly higher in patients with clinically active disease, compared to patients with clinically inactive disease (z = 4.99, p < 0.001; Table 2).
Spearman correlation coefficients between clinical data/FDG uptake and carotid CEUS.
For the bilateral carotid arteries, total vascularization score as determined with CEUS was significantly associated with scores on Kerr criteria (r = 0.583, p < 0.001) and ITAS2010 (r = 0.342, p = 0.004) at the time of CEUS examination (Table 2).
Among 55 TA patients with normal ESR, 31 CEUS scans showed active lesions (visual grade ≥ 2) in the right or left carotid vascular region. In 45 TA patients with normal CRP, 22 CEUS scans showed active lesions (visual grade ≥ 2) in the right or left carotid vascular region.
Elevations in ESR or CRP were considered markers of disease activity and compared with CEUS findings for the same patient. Total CEUS vascularization score was significantly associated with levels of CRP (r = 0.322, p = 0.006) and ESR (r = 0.394, p = 0.001; Table 2).
Correlation between findings on CEUS and uptake of FDG
Twenty-two patients (3 male, 19 female) underwent FDG-PET scans. According to ITAS2010, the 22 cases were divided into active (12/22) and inactive (10/22). Carotid FDG-PET/CT and US findings for 22 patients are shown in Table 3. Visual scores showed robust agreement between nuclear medicine physicians (ϰ = 0.84). Bilateral visual score on carotid CEUS positively correlated with that on FDG-PET/CT (r = 0.597, p = 0.004).
Values of laboratory indices, clinical disease activity, CEUS, and FDG uptake.
Of the 22 cases, 11 had disease activity on the basis of the carotid FDG-PET/CT results. Visual grade ≥ 2 as determined on carotid FDG-PET/CT was more common among patients with active TA, compared to TA patients with inactive disease [75% (9/12) vs 20% (2/10), p = 0.03]. When visual grade ≥ 2 on FDG-PET/CT was used as the standard for active carotid vasculitis, carotid CEUS had 100% sensitivity and 80% specificity, positive predictive value of 79.2%, and negative predictive value of 100%. To evaluate the accuracy of CEUS in predicting disease assessment, receiver-operating characteristic curves were constructed for the combination of sensitivity and specificity. The resulting area under the curve (= 0.968) indicated excellent ability to discriminate between active and inactive disease in the carotid artery (Figure 2).

ROC curve analysis for accuracy of CEUS versus PET/CT in assessing disease severity. ROC: receiver-operating characteristic; CEUS: contrast-enhanced ultrasound; PET/CT: positron-emission tomography/computed tomography; AUC: area under the curve.
DISCUSSION
Visual score of the bilateral carotid artery was higher for TA patients with clinically active disease, compared to TA patients with clinically inactive disease. Measurements of carotid artery vascularization by carotid artery CEUS supported those obtained with vascular uptake of FDG-PET. Carotid CEUS vascularization positively correlated with clinical data (e.g., ITAS2010, Kerr criteria). Higher vascularization score on carotid CEUS indicated inadequate control of active disease by the patient’s current therapy.
There is no standardized method for the assessment of disease activity and response to treatment in patients with TA22. Miller, et al reported that histological evidence of ongoing vasculitis was discovered by surgical aortic biopsy in 44% of patients with clinical relief, while nearly 60% of patients with clinical remission showed angiographic progression22,25. Depending on the clinical question under evaluation, TA may be assessed with the help of various imaging modalities, including conventional angiography, CTA, FDG-PET, and MRA19,26,27,28. Repeated application of these imaging means is not appropriate for young women with confirmed or suspected TA because of side effects.
The main advantage of CEUS over CT (FDG-PET) and conventional angiography is that it does not require ionizing radiation or use of iodinated contrast material. CEUS is a noninvasive technique that may be used to assess vessel wall vascularization as well as luminal visualization. Such a technique is valuable for evaluating the extension of neovascularization into the artery wall, which indicates active vasculitis in patients with TA25. The proinflammatory component of angiogenesis involves expression of adhesion molecules by leukocytes, which then penetrate the vessel wall at the sites of newly formed vessels29. For this reason, the visualization of contrast microbubbles in the incrassate artery wall is considered a sign of inflammation, and may be used to quantify the level of disease activity30. Delayed-enhancement MR has been used to assess vascular remodeling rather than active inflammation in animal models31. There is still little evidence about the possibility that contrast enhancement indicates remodeling in CEUS. Further studies are needed to clarify this point in patients with TA.
The data presented above demonstrate a correlation between ITAS2010 (ESR, FDG uptake, Kerr criteria) and the score of vascularization on CEUS imaging. Our findings are consistent with previous reports by Germano, et al32, who said that findings on CEUS were concordant with the results of clinical examination in 92% of cases. After treatment for TA has been initiated, levels of disease activity may be quantified by followup CEUS studies to measure the decrease in wall vascularization of involved vessels33.
On the basis of ITAS2010 criteria, 34 patients had inactive disease at the time of examination; CEUS revealed severe vascularization of the left or right carotid in 11 cases. Interestingly, we found that 56.4% (31/55) of TA patients with normal ESR values showed active lesions (visual grade ≥ 2) in the left or right carotid vascular region, and 48.9% (22/45) of TA patients with normal CRP levels revealed active lesions (visual grade ≥ 2) in the right or left carotid vascular region in CEUS scans. CEUS was thus effective in identifying severe carotid vascularization in TA patients with inactive disease and/or normal levels of ESR/CRP. Further studies are needed to observe whether these inactive patients with severe carotid vascularization show disease progression of luminal stenosis, arteriolar wall thickening, and fibrosis.
CEUS represents a viable alternative for management and followup of TA. In a study by Czihal, et al34, the carotid CEUS scores decreased sharply in 3 patients with TA after tocilizumab treatment. Carotid CEUS may thus be more useful than clinical examination or laboratory indices for evaluating TA disease activity.
The FDG-PET/CT scan has generally been viewed as a reliable means with which to monitor disease activity in patients with TA11,35. Previous studies have reported that vascular FDG uptake was positively correlated with clinical disease activity or laboratory indices (ESR/CRP) and was superior to ESR/CRP in discriminating active disease in patients with TA11,36. In other studies, use of FDG-PET/CT improved sensitivity and specificity in the diagnosis of TA27,28. Ultimately, FDG-PET/CT was effective for monitoring active vasculitis in patients with TA (before treatment, after treatment, and in the case of disease recurrence after remission)36. These findings suggest that FDG-PET/CT may be more sensitive and specific than conventional clinical and serological indicators for assessment of disease activity in patients with TA.
The findings recorded for 22 patients with TA who underwent FDG-PET/CT and CEUS showed that measurements of carotid wall vascularization on CEUS correlated strongly with carotid uptake as measured by FDG-PET/CT. This correlation was confirmed through visual semiquantitative analysis. The numbers of carotid arteries classified as visual grade ≥ 2 according to ITAS2010 on FDG-PET/CT and CEUS images were higher among TA patients with clinically active disease than among those without clinically active disease. The results presented above show that vascularization is closely related to inflammation of the vascular wall. Nevertheless, CEUS showed 100% sensitivity, with specificity of 80%. One factor that may lower sensitivity is sustained angiogenesis after inflammation has subsided.
Limitations of our study included the small sample size and the relatively low prevalence of TA patients with clinically active disease, as defined by ITAS2010 criteria. In addition, the use of glucocorticoids or other immunosuppressive agents may have interfered with imaging outcomes. Finally, followup images were not obtained for comparison.
Carotid CEUS improves visualization of the lumen border and enables clinicians to evaluate carotid wall vascularization, a latent sign of vasculitis in TA. The correlation between CEUS vascularization and FDG-PET/CT uptake suggests a correlation between vascularization and inflammation and supports the use of CEUS as a noninvasive means of distinguishing active from inactive disease activity in patients with TA. Carotid artery CEUS represents a rapid, reproducible, inexpensive, and minimally invasive method with which to monitor arterial inflammation in TA. In addition, further studies are necessary to clarify the prognostic effect of CEUS findings.
Footnotes
This work was supported by the National Basic Research Program of China (No. 2015CB553704) and the National Nature Science Foundation Key Research Project of China (2017YFC0909002).
- Accepted for publication October 29, 2018.


