

Abstract
Objective. To compare proton density–weighted short-tau inversion recovery (PD-STIR) and T2-weighted fat-suppressed turbo spin echo (T2-FS) sequences for detecting osteitis lesions of the sacroiliac joints (SIJ) in patients with chronic low back pain (CLBP).
Methods. This prospective study included 110 patients with CLBP and suspected spondyloarthritis and 18 healthy controls. All 128 participants (age range: 19–57 yrs) underwent 3.0 Tesla magnetic resonance imaging (MRI) of the SIJ including PD-STIR and T2-FS. Two readers independently scored PD-STIR and T2-FS images for osteitis in separate sessions. Sum scores and signal-to-noise (SNR) and contrast-to-noise (CNR) ratios were calculated. Images were further analyzed as to whether they fulfilled the Assessment of SpondyloArthritis international Society (ASAS) criterion of a positive MRI (MRI+). Interreader agreement was calculated using intraclass correlation coefficients.
Results. Average osteitis sum scores were higher for T2-FS images (mean sum score of 4.10 in T2-FS vs 2.55 in PD-STIR, p = 0.017). Mean SNR was 16.54 for PD-STIR and 37.30 for T2-FS (p = 0.0289). Mean CNR was 4.14 for PD-STIR and 20.20 for T2-FS (p = 0.0212). For both readers, the ASAS MRI+ definition was more often fulfilled by T2-FS than by PD-STIR images, resulting in more patients being classified as having axial spondyloarthritis (axSpA): 68 patients using T2-FS versus 58 patients using PD-STIR. Interreader intraclass correlation coefficients were very good for both PD-STIR (0.91) and T2-FS (0.86).
Conclusion. T2-FS sequences improve image quality and hence the detection of osteitis compared to the PD-STIR sequence. More patients were classified as axSpA based on a positive MRI by T2-FS.
The diagnosis and classification of axial spondyloarthritis (axSpA) strongly relies on imaging of the sacroiliac joints (SIJ) and the spine1. With an estimated prevalence of 1.9%, SpA is regarded as a relevant rheumatic disorder2. Inflammatory back pain affecting the SIJ and spine is the leading symptom of its axial form3,4.
The Assessment of Spondyloarthritis international Society (ASAS) established classification criteria for axSpA in 20093,5. These criteria are based on chronic back pain starting before age 45 and HLA-B27 positivity or imaging evidence of sacroiliitis as key domains with a variety of additional clinical and laboratory abnormalities. Chronic sacroiliitis on digital radiographs and active sacroiliitis on magnetic resonance imaging (MRI) are equally relevant. In addition, efforts were made to define a “positive MRI” of the SIJ6,7, and a state-of-the-art MRI protocol was proposed, which should include T1-weighted spin echo sequences and short-tau inversion recovery (STIR) sequences7,8. The most crucial MRI lesion demonstrating inflammation is paraarticular osteitis, also designated as bone marrow edema. The term osteitis will be used throughout this article, because it better reflects the true character of the finding9,10.
STIR is the best-known MRI sequence among rheumatologists for the detection of inflammation of the SIJ. However, investigators have also proposed other MRI techniques including use of a T2-weighted fat-suppressed turbo spin echo (T2-FS) sequence or acquisition of a T1-weighted FS turbo spin echo sequence after administration of a parametric contrast medium such as a gadolinium-based agent (T1/Gd)11,12. Clinical trials were conducted to compare STIR and T1/Gd sequences both for spinal and SIJ imaging13,14. In these trials, use of a gadolinium-based contrast agent was shown to increase lesion detection by only 6%14. This difference is in general regarded as negligible, and MRI protocols currently used for clinical trials typically include T1 and STIR sequences only. The other MRI technique capable of demonstrating inflammation — T2-FS sequence — has to date not been investigated to a larger extent in comparison to STIR or T1/Gd sequences in the context of axSpA.
STIR and T2-FS sequences use different techniques for fat suppression15 and depict osteitis lesions with a bright signal because of their long T2 relaxation time resulting from an increased free water content11. STIR relies on an inversion radiofrequency pulse that is applied at a given time in the course of the MR sequence to null the signal of fat. T2-FS sequences use spectral fat suppression, accomplished by applying strong gradient pulses that specifically erase signal from fat spins16. T2-FS is known to obtain a specific fat suppression whereas STIR is not specific for fat if any other material with a similar T1 relaxation time to that of fat would be present, such as methemoglobin, mucoid tissue, or melanin17. However, STIR reveals a robust performance in every field strength while specific fat saturation is vulnerable to magnetic field inhomogeneities18.
Based on images and clinical data of the previously published SacroIliac joint MAgnetic resonance imaging and Computed Tomography (SIMACT) study19, we aimed to define the relative value of proton density–weighted STIR (PD-STIR) and T2-FS sequences for the detection of osteitis and to evaluate possible differences in the number of inflammatory lesions detected in the SIJ of patients with axSpA.
MATERIALS AND METHODS
Subjects
The SIMACT study enrolled 110 consecutive patients presenting to the rheumatology department of a university hospital with chronic low back pain (CLBP) and suspected SpA. Hence, this cohort included patients with ankylosing spondylitis (AS), nonradiographic axial spondyloarthritis (nr-axSpA), osteitis condensans ilii, osteoarthritis (OA) of the SIJ, and nonspecific back pain. This prospective single-center study aimed at comparing the diagnostic value of conventional radiographs, low-dose computed tomography, and MRI with a special focus on structural damage such as erosions, sclerosis, and joint space alterations. These results have been reported recently19. A secondary aim of the SIMACT trial was to compare PD-STIR and T2-FS sequences for the detection of osteitis. Patients older than 60 years, or with pacemakers, other kinds of metal implants, or pregnant patients were not eligible for this study. Eighteen age- and sex-matched healthy controls without any reported back pain or known spinal or SIJ disease served as controls. In addition to MRI, clinical variables were documented including the duration and character of back pain, C-reactive protein values, HLA-B27 testing, previous diseases of the back, family history of SpA, and evidence of uveitis, psoriasis, or inflammatory bowel disease. An expert rheumatologist established the final diagnosis, as described earlier19. In short, all clinical data, laboratory results, and imaging findings were taken into account using a published algorithm20.
The study, including imaging procedures, was approved by the local ethics committee (registration number EA1/073/10). All patients and controls signed informed consent prior to the MRI scan.
MRI protocol
All study participants underwent an MR examination on a 3.0-Tesla system (Siemens Magnetom Skyra; Siemens). A PD-STIR sequence and T2-FS sequence in the oblique coronal plane were obtained as part of the MRI protocol of the SIMACT study. The technical variables of the 2 sequences are presented in Table 1. T1-weighted spin echo and 3-D gradient echo sequences were used for anatomic correlation.
Technical variables.
Osteitis scoring
Images were scored for osteitis in 2 separate sessions with readers blinded to any clinical information of the patients and controls. Blinding was accomplished by assigning a randomized pseudonym to each subject in each session. Session 1 included each subject’s PD-STIR sequence and session 2 the T2-FS sequence. In both sessions, an MR sequence was available for anatomic reference.
Image scoring was done as described previously by our group19. Briefly, SIJ were divided into 4 quadrants (2 quadrants in the sacral portion and 2 quadrants in the iliac portion) and 3 positions (anterior, middle, posterior) on each side, resulting in a total of 12 regions to be evaluated on each side (Figure 1). Images were scored for the presence of osteitis as a sign of inflammation. A 4-point scale was used to grade the extent of osteitis (0 = no osteitis detectable, 1 = osteitis in up to 33% of the quadrant area, 2 = osteitis in up to 66% of the quadrant area, 3 = osteitis in > 66% of the quadrant area), resulting in a total sum score of 0–36 for each SIJ and 0–72 per patient.

A 3-D representation of the 24 joint regions evaluated. The first 8 quadrants show changes of both sacroiliac joints in their anterior aspect, defined by the depiction of the true pelvis in the center of the MR image. The second 8 quadrants (numbered 9 to 16) show both sacroiliac joints in their mid-position, defined by the depiction of the sacral foramina. The remaining quadrants (numbered 17 to 24) show the posterior aspect, recognized by visualization of sacral nerve roots and the entheseal joint compartment. MR: magnetic resonance.
Scoring was performed independently by 1 research student (reader 1, with 6 months of experience in musculoskeletal imaging) and 1 junior radiologist (reader 2, with 5 years of experience in musculoskeletal imaging) on a high-resolution monitor using OsiriX (version 6.4, Pixmeo SARL) as medical viewing software.
In addition, we assessed whether the MRI was positive (yes/no) in accordance with the ASAS definition of active sacroiliitis on MRI (“positive MRI”, MRI+)6,7. Osteitis had to be present in the subchondral or periarticular bone marrow. Results were only counted positive if both readers were confident that paraarticular osteitis in at least 2 consecutive slices was present and the lesions were compatible with axSpA7.
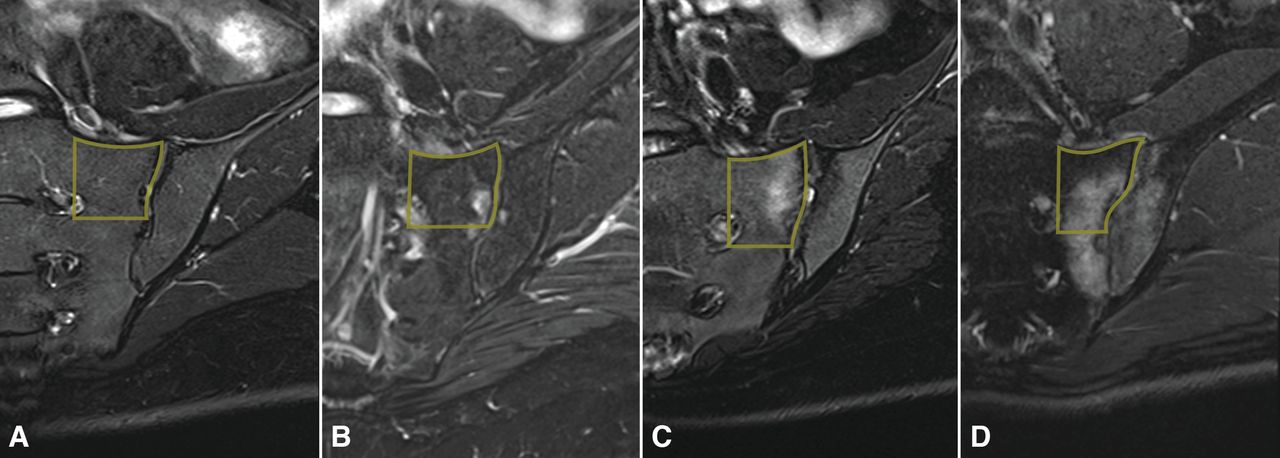
Prior to the 2 scoring sessions, the 2 readers had 2 training sessions under the supervision of a senior radiologist (15 years of experience in musculoskeletal imaging). The training began with a discussion of the range of findings in sacroiliitis, OA, and osteitis condensans ilii, as well as anatomic variants in 10 cases, and typical imaging findings were compiled in a reference atlas (Figure 2) in PowerPoint format. Thereafter a training set of 5 MR examinations was scored independently by the 2 readers and the supervisor, followed by a joint discussion of discrepant scores. The 2 main scoring sessions were initiated after the completion of the training and further calibration between primary readers.

Imaging examples of osteitis grades 0–3 from the atlas of reference images. T2-weighted fat-suppressed turbo spin echo sequences are shown. A. Grade 0. B. Grade 1. C. Grade 2. D. Grade 3. Quadratic example regions are drawn as overlays.
Quantitative measurements
To obtain a numerical estimate of image quality, both contrast-to-noise ratios (CNR) and signal-to-noise ratios (SNR) were calculated. These measurements were performed by 1 reader (reader 1) using the same high-resolution monitor as for the scoring sessions. The following regions of interest (ROI) were measured by using an electronic cursor on both sides of the SIJ: osteitis (if present), normal bone marrow, muscle tissue, and air outside the patient. The ROI size was kept constant for all measurements. Both mean signal intensity and SD were documented.
For calculation of SNR, the mean signal intensity of the different tissues was divided by that of image noise outside the patient (i.e., air).
CNR was calculated by dividing the difference between mean tissue signal intensity and mean signal intensity of muscle by mean signal intensity of image noise outside of the patient21.
Statistical analysis
For statistical analysis, patients with nr-axSpA and AS were assigned to group A (axSpA), patients with osteitis condensans ilii and OA to group B (mechanical disease), and patients with back pain without structural changes to group C (nonspecific back pain). The Kruskal-Wallis test was used to test for group differences of clinical data. Controls were analyzed separately.
Osteitis sum scores were analyzed using linear models with repeated measures and the patient as repeated factor. The number of regions affected by osteitis was tested with the nonparametric McNemar test. Interreader variance was derived from the osteitis sum scores and was calculated as intraclass correlation coefficients (absolute agreement definition). The same method was done to calculate intrareader reliability with a random selection of 15 cases. Regarding ASAS classification for positive MRI sacroiliitis, binary values were counted positive only if both readers agreed on the respective scoring item. Statistical analysis was performed with SAS 9.4 (SAS Institute Inc.) and SPSS Statistics, version 23.
RESULTS
Subjects
MRI was completed in all patients and controls. A total of 256 SIJ were scored. The mean age of the study population of 110 patients (53 men, 57 women) was 36.1 years (range 19–57 yrs), with a mean duration of chronic back pain of 6 years and 10 months (range: 2 mos to 32 yrs; median: 4 yrs). Inflammatory back pain was present in 87 patients (79.1%). The final diagnoses made by the expert rheumatologist were as follows: group A (axSpA) — 58 patients (52.7 %); group B (mechanical disease) — 36 patients (32.7%); group C (nonspecific back pain) — 16 (14.5%). In group A, 23 patients had AS and 35 had nr-axSpA. The 18 controls (9 men, 9 women) had a mean age of 34.6 years (range: 20–53 yrs). Clinical variables of the patients and controls are compiled in Supplementary Table 1, available with the online version of this article.
Osteitis sum score
In all 110 patients taken together, reader 1 assigned a mean osteitis sum score of 2.55 ± 4.41 for the PD-STIR sequence and of 3.90 ± 5.67 for the T2-FS sequence. Reader 2 assigned a mean osteitis sum score of 3.95 ± 5.79 and 7.10 ± 8.69, respectively. The following p values were derived from linear statistical models taking both readers into account. Osteitis sum scores showed a statistically significant difference between the 2 sequences (p = 0.017; Figure 3) and also between the 3 patient subgroups (p < 0.0001). On average, a higher osteitis sum score was assigned using the T2-FS sequence (mean sum score of 4.10 for T2-FS vs 2.55 for PD-STIR). The mean osteitis sum score was highest in the axSpA group (6.54), followed by the mechanical disease group (2.32) and the group of nonspecific back pain (1.13).

Overall osteitis sum score of both readers. Points represent sum scores calculated by subtracting osteitis sum scores of T2-FS sequences from osteitis sum scores of PD-STIR sequence for each subject. Negative values represent less osteitis and positive values more osteitis detected by PD-STIR. T2-FS: T2-weighted fat-suppressed turbo spin echo; PD-STIR: proton density–weighted short-tau inversion recovery.
Different osteitis cutoff values
In the 110 patients, inflammatory lesions with an osteitis grade of 1 or higher in at least 1 region, as detected by both readers, were present in 60 cases (54.5%) on PD-STIR and 72 subjects (65.5%) on T2-FS (p = 0.031). When defining an osteitis cutoff score of ≥ 2 in at least 1 affected region per patient, 19 patients (17.3%) were positive on PD-STIR and 31 (28.2%) on T2-FS (p = 0.004).
Effect of PD-STIR versus T2-FS selection on ASAS classification of patients
Classification was assessed schematically for each patient separately, first taking into account clinical variables, consensus radiograph results, and consensus PD-STIR results, and second using consensus T2-FS instead of PD-STIR, without taking into account the clinical diagnosis. The use of T2-FS resulted in a slight change in patient classification (Figure 4) with 4 more patients being classified as having axSpA compared to the PD-STIR sequence (6 patients were classified positive with T2-FS but not with PD-STIR; 2 patients were classified with PD-STIR but not T2-FS). Importantly, fewer patients were classified as having axSpA based on HLA-B27 positivity and clinical variables alone (the so-called “clinical arm”; Figure 4), and the axSpA classification criteria were fulfilled by imaging in more patients (58 patients taking PD-STIR into account vs 68 patients taking T2-FS into account).
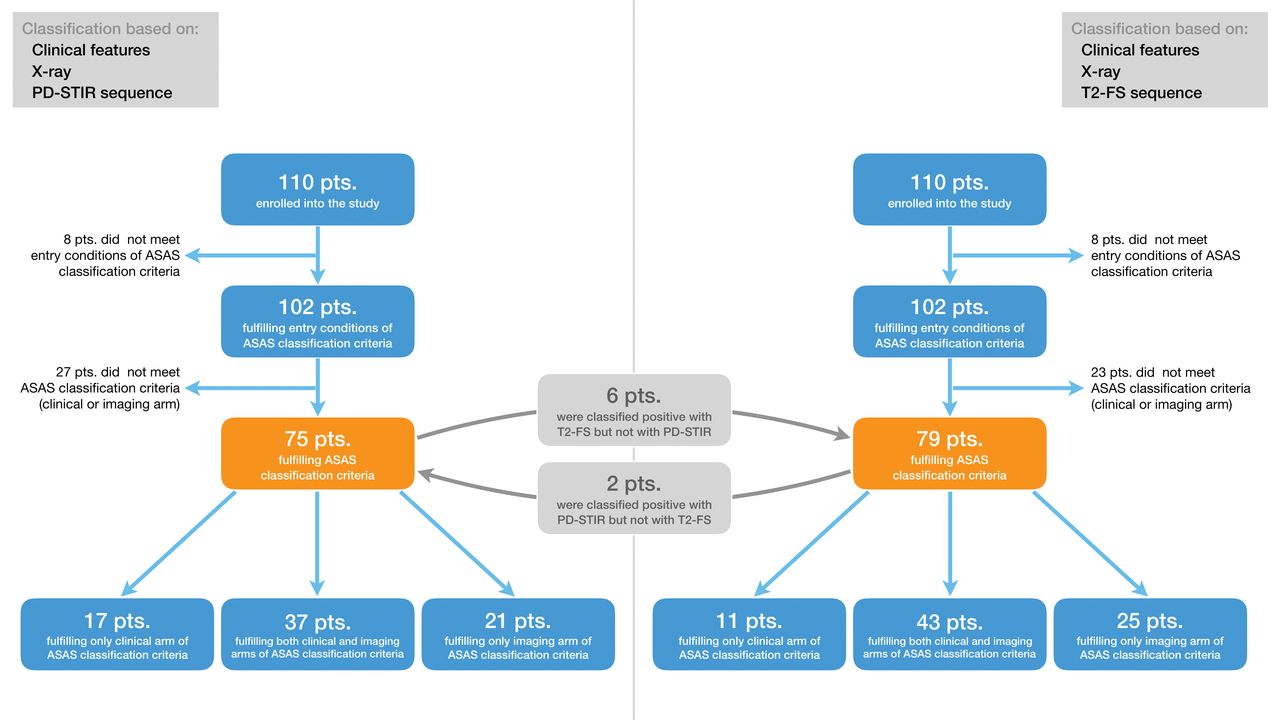
Effects of PD-STIR and T2-FS sequence on ASAS classification. While 75 patients of this cohort could be classified as having axial spondyloarthritis (axSpA), taking into account clinical features including HLA-B27 testing, pelvic radiograph, and the PD-STIR sequence, 79 patients were classified as having axSpA when the PD-STIR sequence was exchanged by the T2-FS sequence. The number of patients classified by the clinical arm alone was reduced from 17 to 11. T2-FS: T2-weighted fat-suppressed turbo spin echo; PD-STIR: proton density–weighted short-tau recovery; ASAS: Assessment of SpondyloArthritis international Society.
When the 2 MRI sequences were compared with the clinical diagnosis as established by the treating rheumatologist [axSpA (n = 58) vs non-SpA (n = 52)], the sensitivity for a positive MRI according to the ASAS definition was 56.9% and 75.9% for PD-STIR and T2-FS, respectively, and specificity was 34.6% and 44.2%, respectively.
Osteitis in healthy controls
Regarding osteitis (minimum osteitis grade of 1 in at least 1 region, as detected by both readers), lesions were evident in 4 subjects in PD-STIR and in 9 subjects in T2-FS. However, an osteitis grade ≥ 2 as detected by both readers was not found in any of our healthy controls (Supplementary Table 2, available with the online version of this article).
Interreader and intrareader results
Interreader agreement was very good for the 2 sequences, with intraclass correlation coefficients of 0.91 for PD-STIR (95% CI: 0.82–0.95) and 0.86 for T2-FS (95% CI: 0.65–0.93). Intrareader agreement was excellent for both sequences with an average intraclass correlation coefficient value for PD-STIR of 0.96 and for T2-FS of 0.97.
SNR and CNR
Mean SNR for all inflammatory lesions on PD-STIR and T2-FS images was 16.54 and 37.30, respectively. Mean CNR was 4.14 and 20.20, respectively. SNR and CNR were significantly higher for the T2-FS sequence compared to the PD-STIR sequence (SNR: p = 0.0289, CNR: p = 0.0212; Supplementary Figure 1, available with the online version of this article). Examples illustrating the different appearance of osteitis on T2-FS and PD-STIR images are presented in Figure 5.
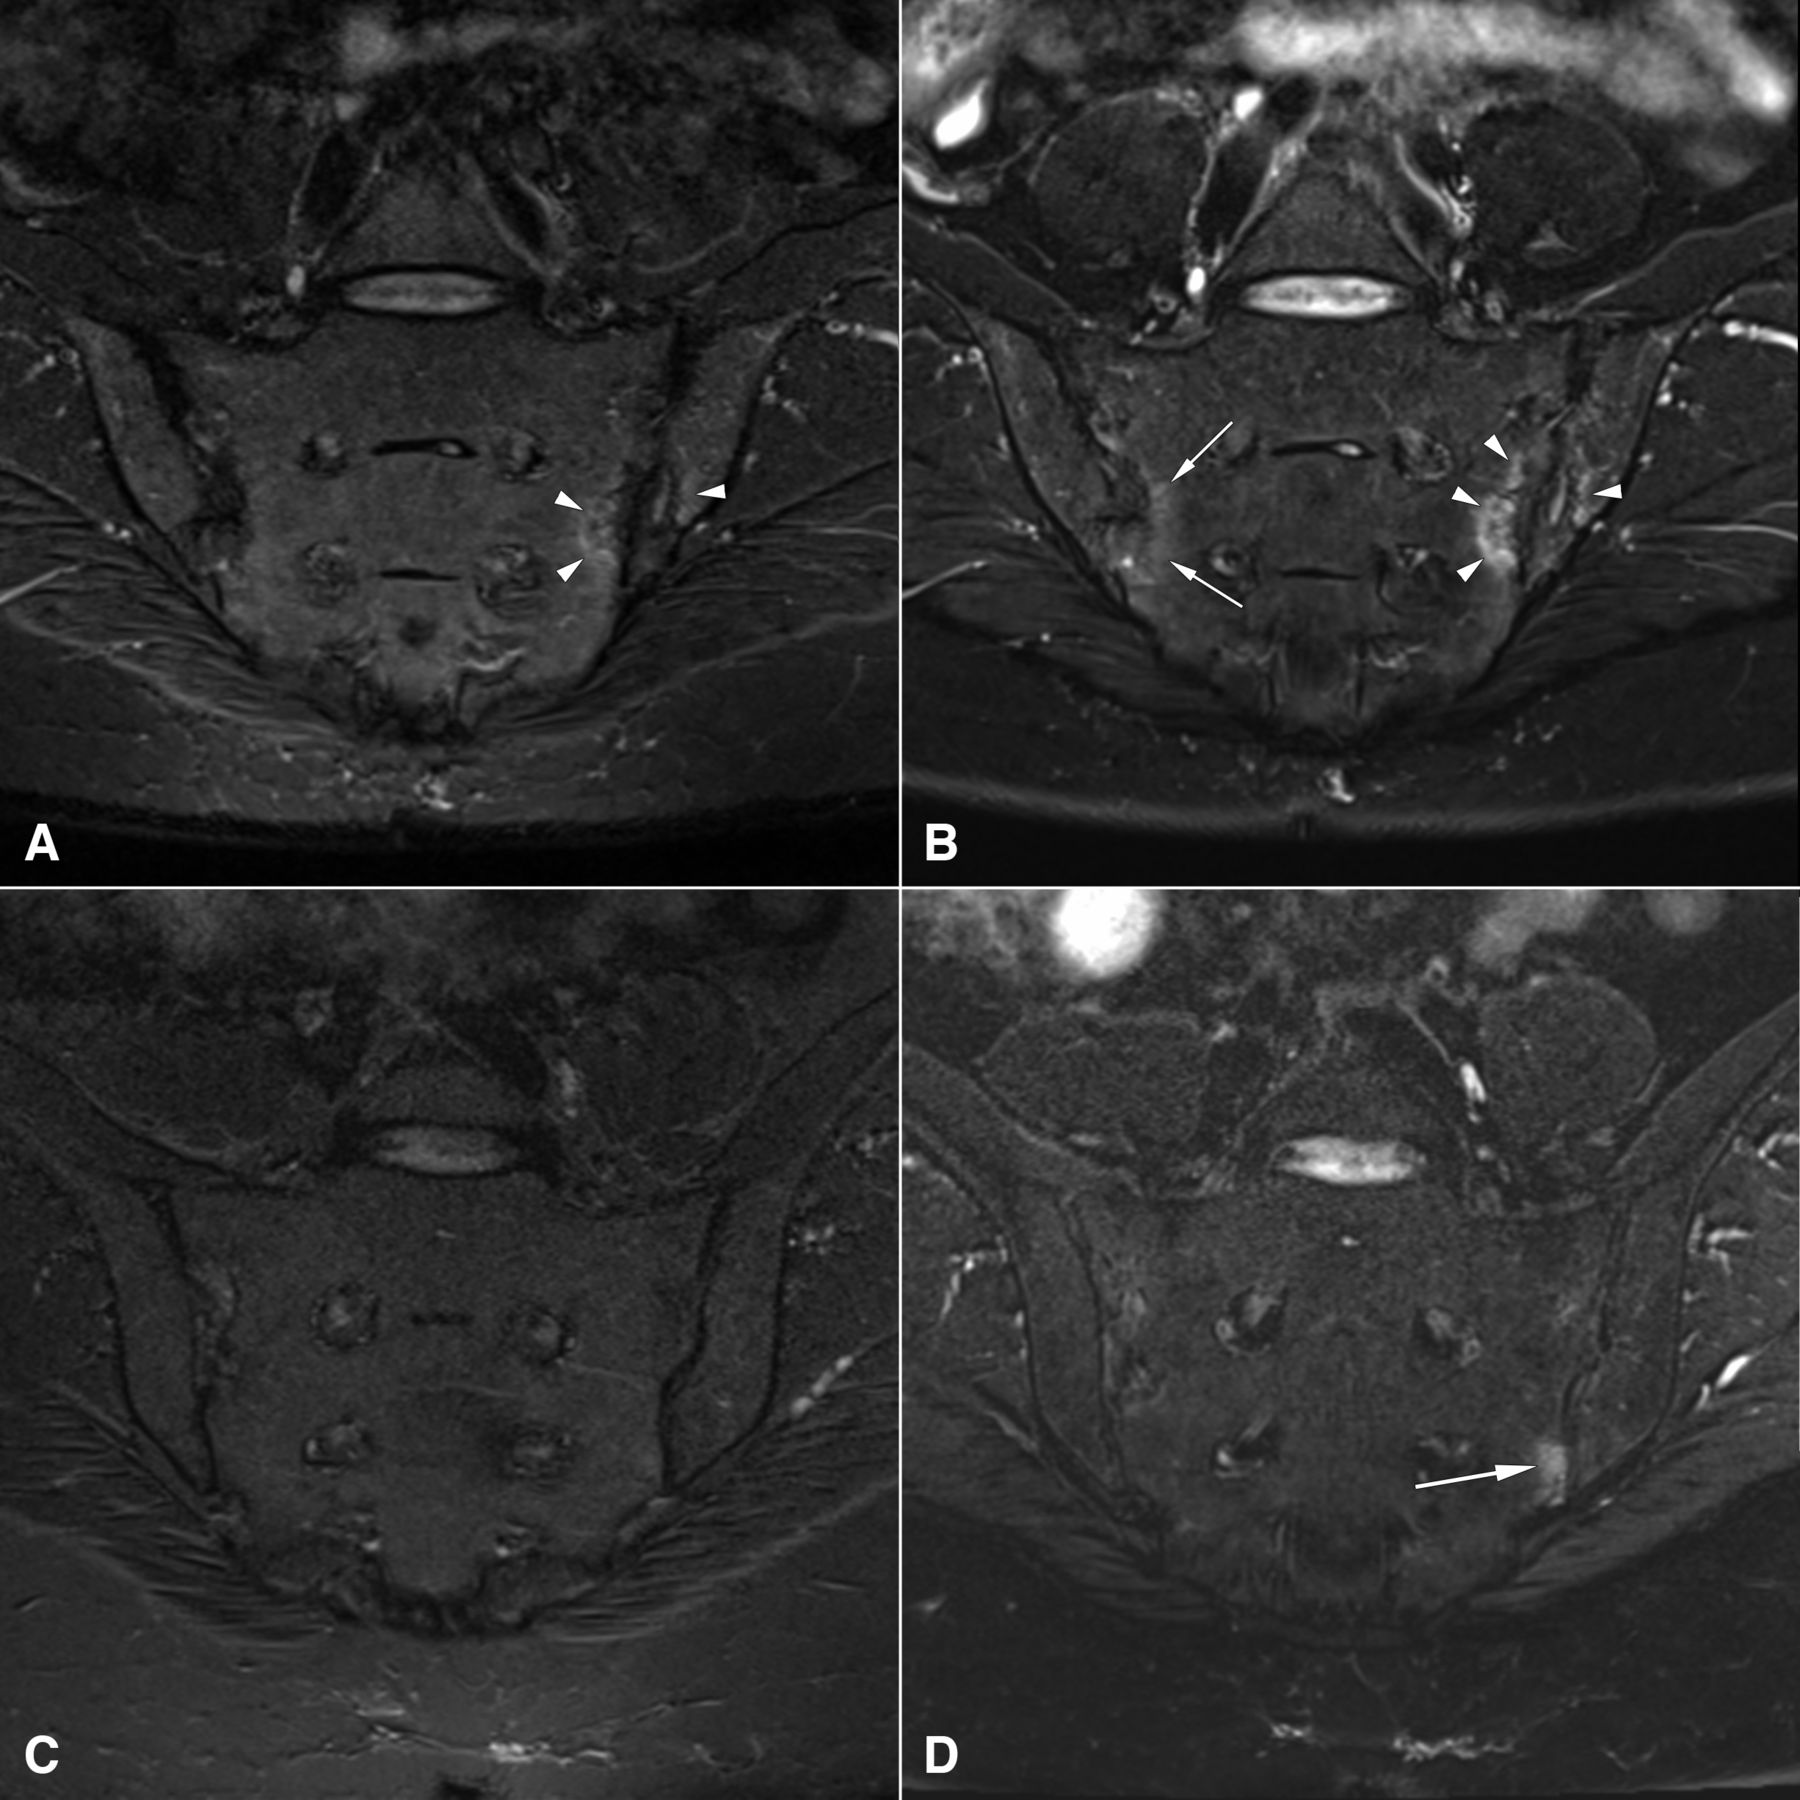
Appearance of osteitis in PD-STIR and T2-FS images. Panels A and C show the coronal PD-STIR sequence; panels B and D show the coronal T2-FS sequence. Images illustrate different appearance of osteitis lesions. Upper row: osteitis present in both sequences at the left sacroiliac joint (arrowheads), additional visualization of osteitis at the right sacroiliac joint only in T2-FS sequence (arrows). Lower row: osteitis visualized at the left sacroiliac joint identified only with T2-FS sequence (arrow). The cartilage in the L5/S1 intervertebral disc appears much brighter on the T2-FS images (B and D), confirming the superiority of T2-FS for the detection of water-based signal compared to PD-STIR (A and C), independent of any pathological process. T2-FS: T2-weighted fat-suppressed turbo spin echo; PD-STIR: proton density–weighted short-tau inversion recovery.
DISCUSSION
This prospective study is one of the first to compare and define the diagnostic value of a PD-STIR sequence and another MRI sequence using fat suppression (T2-FS sequence) in the context of detecting osteitis in a large group of patients with CLBP suspected of having sacroiliitis.
Our results show overall higher osteitis sum scores using the T2-FS sequence compared with the PD-STIR sequence. Moreover, the T2-FS sequence scoring resulted in more patients fulfilling the ASAS criteria of a positive MRI in the consensus of both readers. The same holds true when analyzing only unambiguous lesions (score of 2 or more per region).
We further analyzed whether the ASAS classification criteria for axSpA were fulfilled by clinical variables through the so-called “clinical arm” or by imaging findings on radiographs or MRI using the “imaging arm.” While the overall difference was only 4 patients, which seems a rather small number, the use of the T2-FS sequence compared to the PD-STIR sequence resulted in a gain of 10 more patients that could be classified through the imaging arm. Further, the number of patients classified by the clinical arm alone was reduced from 17 to 11 patients.
Additionally, we compared the 2 MRI sequences on the background of the clinician’s diagnosis of axSpA or non-SpA. However, we could not use this as a primary outcome variable because we did not control the clinician’s knowledge of the imaging results. In this analysis, T2-FS resulted in a higher sensitivity (75.9% vs 56.9%) and specificity (44.2% vs 34.6%) for the diagnosis of axSpA. The rather low specificity values are explained by the inclusion criteria of the SIMACT cohort: patients did not necessarily need to be active. Thus, it has to be clarified in future controlled studies whether the increase of sensitivity and specificity holds true also on the larger scale.
The T2-FS sequence resulted in significantly higher SNR and CNR, confirming an overall better image quality for the detection of osteitis lesions. Analysis of interreader and intrareader agreement yielded very good results as measured by intraclass correlation coefficient values. However, it must be noted that the interreader variance is in the range of the difference between PD-STIR and T2-FS osteitis sum scores. The results suggest that FS sequences, such as the T2-FS sequence used in our present study, have potential benefit in the diagnostic setup of patients suspected of having axSpA.
About 10–25% of patients diagnosed with nr-axSpA by their treating rheumatologist do not show structural lesions or subchondral bone marrow edema in the sacroiliac joints22. Why patients with a clinical diagnosis of axSpA can be negative on imaging continues to be a riddle. When STIR sequences of the SIJ were compared with histological investigations of biopsies from these joints, only 37.7% of those patients with AS who had histological inflammation were STIR-positive, while none of the STIR-positive patients had a negative histology23. Thus, the current MRI protocols with nearly exclusive use of the STIR sequence might have limited sensitivity for the detection of subchondral bone marrow inflammation. Our results support such an assumption and offer a more sensitive MRI method for the detection of subchondral osteitis by MRI.
However, it must be noted that edematous bone marrow lesions can also be induced mechanically and also occur in degenerative SIJ diseases such as OA or osteitis condensans ilii24. Besides, osteitis lesions in healthy controls have been described in several studies before25,26,27. Although osteitis lesions were also found in our healthy control group, these lesions were only low-grade, with scores not higher than 1. While the nature of these lesions remains unclear, subclinical mechanical stress might be one explanation.
Earlier studies aimed at identifying the most appropriate MRI sequence for the detection of inflammation in patients with axSpA rarely included the T2-FS sequence. To our knowledge, there is only 1 recent study comparing STIR with T2-FS in the context of axSpA28. In that study, Dalto, et al assessed agreement of STIR, T2w SPAIR (T2-weighted spectral attenuated inversion recovery sequence), and SPIR (spectral presaturation with inversion recovery) T1-weighted postcontrast sequences in a cohort of 76 patients with clinically confirmed SpA28. Results showed similar performance and high agreement of STIR and SPAIR sequences in osteitis detection. Comparison of STIR and T2-FS sequences was further done in the setting of other clinical indications (e.g., detection of bone contusions of the knee)29. Here, the authors found the image quality of the T2-FS sequence to be slightly superior to that of the STIR sequence.
Our study has some limitations. All MRI examinations were performed at 3.0 Tesla. While this field strength is more and more introduced into diagnostic routine, most MRI examinations are still performed at 1.5 Tesla. Comparison of 1.5 and 3.0 Tesla systems was done regarding image quality and detection of bone marrow edema in patients with rheumatoid arthritis by T2-FS and T1-Gd sequences30. Image quality was better using the 3.0 Tesla system; however, image quality at 1.5 T was mostly regarded as excellent as well. The MR sequence measurements selected for our STIR sequence resulted in a PD-STIR sequence to allow for good anatomical detail visibility. Hence, there was no true T2 weighting. The inversion pulse inherent to all STIR sequences with the measurements used here may allow sensitive visualization of fluid; however, the potential for inadequate T2 weighting in the spine with STIR is not widely known or understood. Another limitation of our study is the absence of a gold standard for the detection of inflammatory SIJ lesions. However, this limitation applies to many imaging studies in the field of rheumatology because biopsies are rarely available, for a variety of reasons. Our MRI protocol did not include a T1/Gd sequence because several studies already compared T1/Gd and STIR sequences11,13,14,31. Also, complete blinding to all factors during the reading sessions was not possible because PD-STIR and T2-FS images have a slightly different appearance and readers might have been aware which MR pulse sequence they were reading. However, at no time during evaluation were readers able to compare PD-STIR and T2-FS images side by side.
The use of the T2-FS sequence improves image quality and detection of osteitis compared to a proton density–weighted STIR sequence. More patients were classified as having axSpA based on a positive MRI by T2-FS. Further studies are warranted to evaluate the sensitivity and specificity of this pulse sequence for diagnosis and classification in greater detail. Nonetheless, it should be noted that adequately T2-weighted STIR sequences are still a robust method for osteitis detection.
ONLINE SUPPLEMENT
Supplementary material accompanies the online version of this article.
Acknowledgment
The authors thank Bettina Herwig for language editing and Nikolay N. Tonkoff for graphic support with Figure 1.
- Accepted for publication August 27, 2018.


