

Abstract
Objective. HLA-DRB1 is the most important locus associated with rheumatoid arthritis (RA) and anticitrullinated protein antibodies (ACPA). However, fluctuations of rheumatoid factor (RF) over the disease course have made it difficult to define fine subgroups according to consistent RF positivity for the analyses of genetic background and the levels of RF.
Methods. A total of 2873 patients with RA and 2008 healthy controls were recruited. We genotyped HLA-DRB1 alleles for the participants and collected consecutive data of RF in the case subjects. In addition to RF+ and RF− subsets, we classified the RF+ subjects into group 1 (constant RF+) and group 2 (seroconversion). We compared HLA-DRB1 alleles between the RA subsets and controls and performed linear regression analysis to identify HLA-DRB1 alleles associated with maximal RF levels. Omnibus tests were conducted to assess important amino acid positions.
Results. RF positivity was 88%, and 1372 and 970 RF+ subjects were classified into groups 1 and 2, respectively. RF+ and RF− showed similar genetic associations to ACPA+ and ACPA− RA, respectively. We found that shared epitope (SE) was more enriched in group 2 than 1, p = 2.0 × 10⁻⁵, and that amino acid position 11 showed a significant association between 1 and 2, p = 2.7 × 10⁻⁵. These associations were independent of ACPA positivity. SE showed a tendency to be negatively correlated with RF titer (p = 0.012). HLA-DRB1*09:01, which reduces ACPA titer, was not associated with RF levels (p = 0.70).
Conclusion. The seroconversion group was shown to have distinct genetic characteristics. The genetic architecture of RF levels is different from that of ACPA.
Rheumatoid arthritis (RA) is a chronic autoimmune arthritis affecting about 1% of the general population. Sustained inflammation of the affected joints leads to joint destruction and functional impairment. Both environmental factors and genetic factors are known to contribute to the development of RA1,2,3.
HLA-DRB1 is the gene most strongly associated to RA. Most of the RA-associated HLA-DRB1 alleles share similar amino acid sequences at position 70 to 74 on HLA-DR β chain called the shared epitope (SE)4. The SE alleles are associated not only with RA susceptibility, but with disease onset and the severity of RA5. Large-scale association studies have revealed that the contribution of the HLA region to RA susceptibility can be explained by particular amino acid positions of HLA-DRB1, B, DPB1, and A6,7. Among amino acid positions of HLA-DRB1, positions 11 or 13, 71, and 74 are strongly associated with RA. While these studies were conducted in the European population, a previous study using an Asian population revealed a very similar genetic architecture to the European population, although amino acid position 57 was unique to the Asian population8.
Rheumatoid factor (RF) and anticitrullinated peptide/protein antibody (ACPA) are characteristic autoantibodies found in patients with RA. Because ACPA is a highly specific autoantibody to RA, many of the previous genetic analyses have focused on RA subsets based on the positivity of ACPA. Previous studies have revealed that ACPA+ RA has different genetic components from ACPA− RA, especially in the HLA region9,10,11. SE was strongly associated with ACPA+ RA, but weakly associated with ACPA− RA. Amino acid position 11 showed the strongest association with both RA subsets, with different association patterns of amino acid residues at this position7. Genetic components contributing to RA susceptibility are also associated with titer of ACPA12,13.
The genetic architecture of RA subgroups based on RF and of RF levels is not fully known. Some previous reports show the association of seropositivity of RF and SE based on the comparison between RF+ RA and healthy controls14,15,16. No studies have addressed amino acid positions important for RF+ or RF− RA. Because RF fluctuates over the disease course17 in contrast to ACPA, which is relatively stable, it has been difficult to define fine subgroups of RA according to consistent RF positivity. Previous studies have revealed that the positivity for and levels of RF are associated with joint destruction18,19, suggesting the importance of not only the positivity but also the levels of RF, on RA outcome. Thus, it would be important to clarify genetic components underlying RF production in RA. In our study, we define RA subgroups with consecutive RF data and analyze the genetic components characterizing the subgroups and the levels of RF using 2 independent datasets.
MATERIALS AND METHODS
Study population
We recruited 490 patients with RA from the KURAMA (Kyoto University Rheumatoid Arthritis Management Alliance) cohort20 and 2383 cases from the IORRA (Institute of Rheumatology, Rheumatoid Arthritis) cohort21. All of the patients fulfilled the American College of Rheumatology (ACR) 1987 revised criteria for RA22 or the ACR/European League Against Rheumatism 2010 classification criteria for RA23,24. Five hundred healthy subjects were recruited in set 1 and 1508 healthy subjects whose data were used in the previous study were recruited in set 225. This study was approved by the Kyoto University Graduate School and Faculty of Medicine Ethics Committee (No. G1006) and the ethics committee of Tokyo Women’s Medical University (No. 2952). Written informed consent was obtained from each participant. Clinical information was obtained from electronic clinical charts or the database of the 2 cohorts in an unbiased manner.
Quantification of RF and ACPA
A latex agglutination turbidimetric immunoassay was used for quantitating serum RF with a cutoff value of 20 IU/ml. The Mesacup-2 cyclic citrullinated peptide (CCP) ELISA kit (Medical and Biological Laboratories), a second-generation anti-CCP antibody test, was used to measure ACPA, according to the manufacturer’s instructions, with a cutoff value of 4.5 U/ml. We collected consecutive data of RF from 2001 to 2015. RF was measured at almost every visit in the KURAMA and every 6 months in the IORRA cohort.
HLA genotyping
A WAKFlow system (Wakunaga) or an AlleleSEQR HLA-DRB1 typing kit (Abbott) was used for HLA-DRB1 typing, as previously described25. HLA-DRB1 *01:01, *04:01, *04:04, *04:05, *04:10, *10:01, *14:02, and *14:06 were defined as the SE allele.
Association study of stratified patients
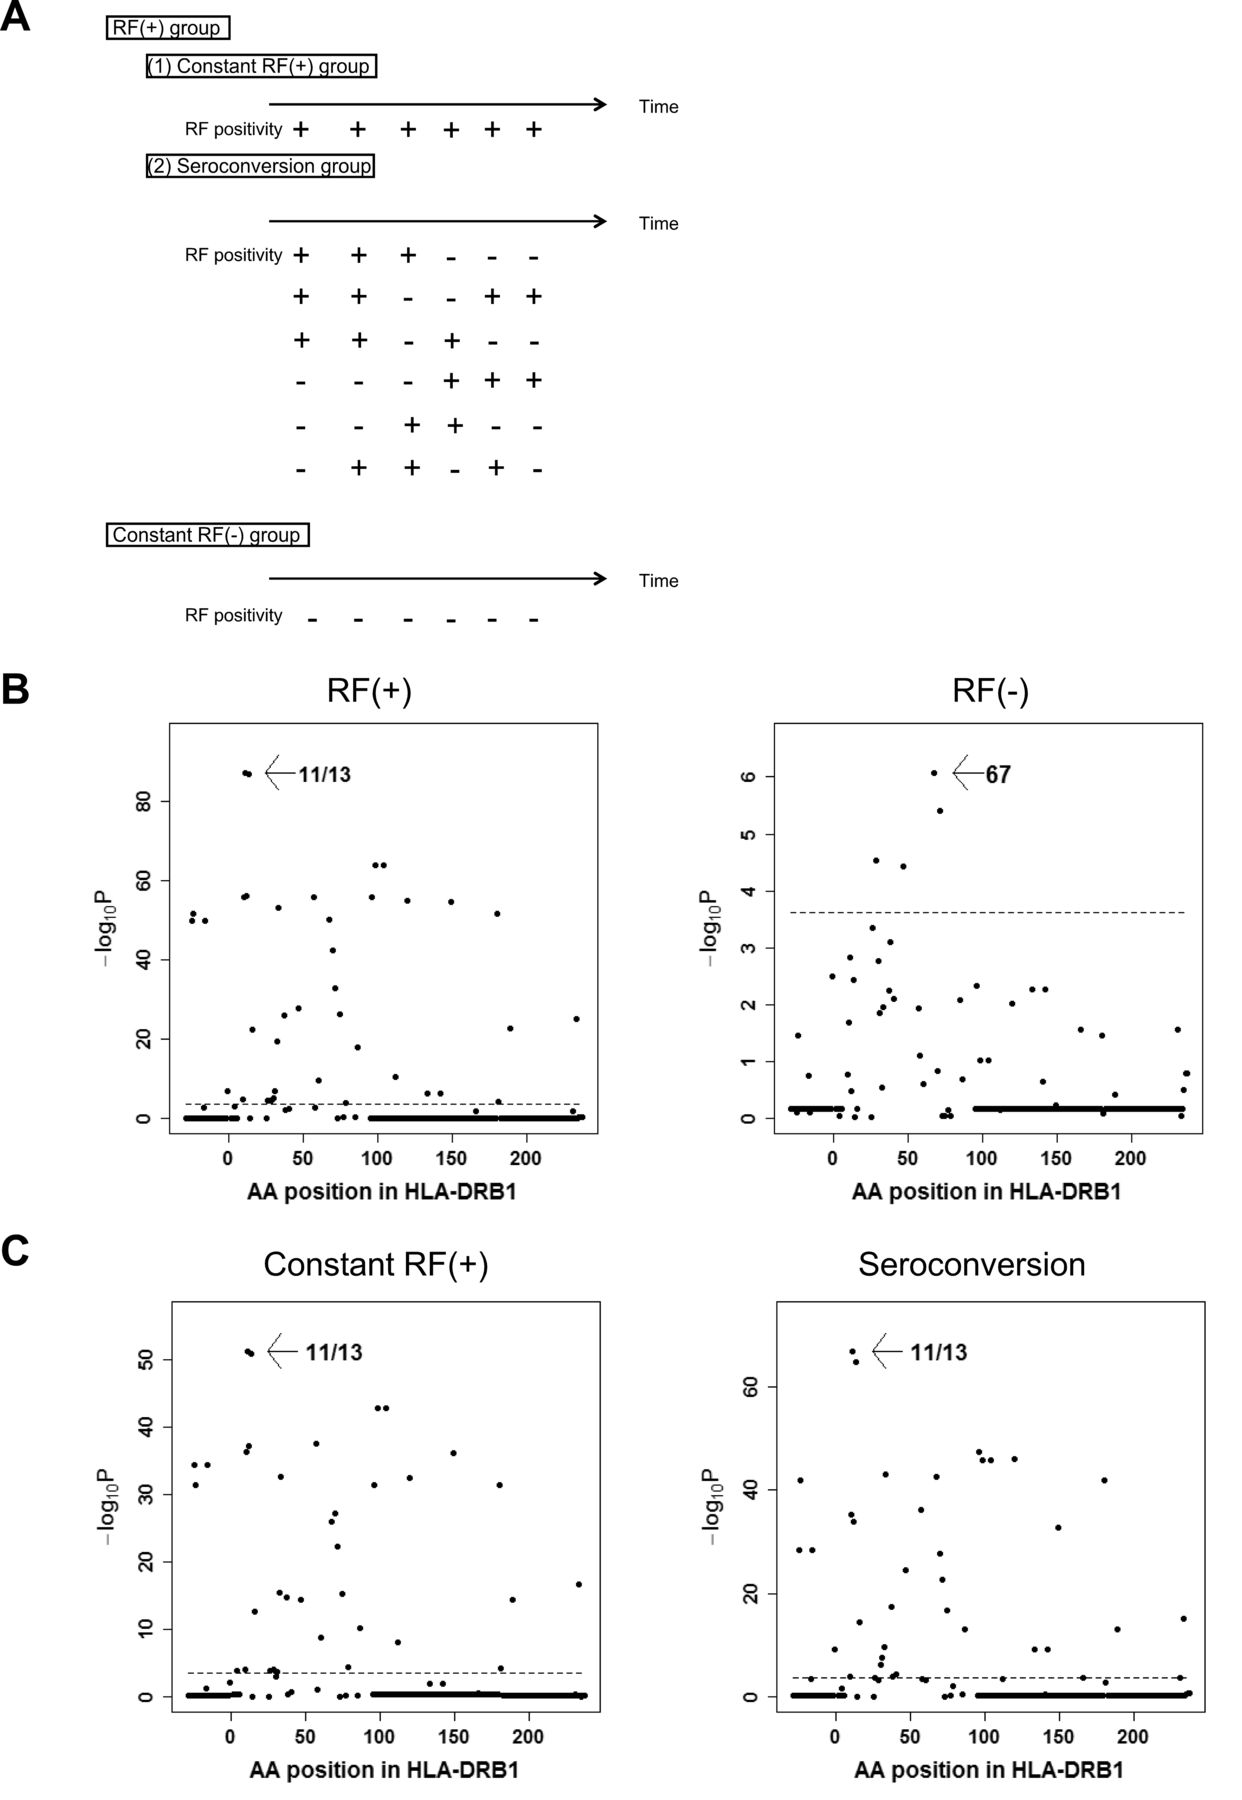
We classified the case subjects into 2 subsets based on RF positivity: RF+ and RF−. We defined patients as RF-positive if they were ever positive for RF during the study period. We further divided RF+ subjects into 2 groups: 1 (constant RF+), and 2 (seroconversion). We defined patients as seroconverted if they were at least once both positive and negative during the study period (Figure 1A).

Subdivisions of RA subjects based on RF data and omnibus tests for susceptibility to each subset. (A) Subjects who had at least 1 RF-positive timepoint were classified into the RF+ group. The RF+ group was divided into 2 subgroups: constant RF+, and seroconversion. Subjects who were RF− at all timepoints were classified into the constant RF− group. (B, C) Results of association studies for AA positions. Omnibus p values are shown for each HLA-DRB1 AA position of RF+ RA and RF− RA (B), and constant RF+ subgroup and seroconversion subgroup (C). The horizontal lines indicate the level of significance (p = 0.00024). RA: rheumatoid arthritis; RF: rheumatoid factor; AA: amino acid.
Statistical analysis
We compared HLA-DRB1 alleles between RA subsets and healthy controls, and between the different RA subsets by logistic regression analysis. HLA-DRB1 alleles whose frequencies were > 0.5% in healthy controls or cases were used for the analyses. The analyses were performed in set 1 and set 2 as well as in the combined set. The status of belonging to the IORRA cohort was added as a covariate when analyzing the combined set. Conditional analyses were also performed to obtain independent signals.
Omnibus p values previously described were also calculated to assess associations of amino acid positions of HLA-DRB16,8. We performed an omnibus test for RF subset susceptibility against controls or against another RA subset. Conditional analyses were also performed. We used cohort information as an indicator covariate.
We assessed concordance of associations of amino acid residues at position 11 of HLA-DRB1 between susceptibility to seroconversion group and to constant RF+ group by the method described by Han, et al7.
Linear regression analysis using the generalized linear models was performed to identify HLA-DRB1 alleles associated with maximal RF levels. Omnibus tests were also performed. RF levels were log-transformed prior to the analyses. To compare the effect of HLA-DRB1 alleles on RF with that on ACPA antibody, association results between HLA-DRB1 alleles and ACPA levels in ACPA-positive RA using generalized linear regression analysis were extracted from the previous report26. Spearman’s correlation analysis was used to test the correlation of standardized coefficient of HLA-DRB1 alleles with RF titer and with ACPA levels.
Stringent significance levels were set based on Bonferroni correction. P values < 0.0022 (0.05/23) and 0.00024 (0.05/207) were regarded as significant regarding analyses of HLA-DRB1 allele and the omnibus test, respectively. For the other analyses, p values < 0.05 were set as significant. Calculation was performed using the R software (www.R-project.org).
RESULTS
Study participants
We recruited 490 patients from the KURAMA cohort and 2383 patients from the IORRA cohort as sets 1 and 2, respectively. Five hundred healthy subjects were recruited as controls in set 1 and 1508 healthy subjects were recruited in set 2; their data had been used in the previous study. A summary of the clinical information at baseline is shown in Table 1. The positivity of autoantibodies in RA are comparable with previous reports27,28. Because the results were consistent across the 2 sets in the current study, we showed the results of the combined set in the main text.
Summary of the clinical information of the KURAMA and the IORRA cohort at baseline.
Associations between RF positivity and HLA-DRB1
A total of 2529 and 344 subjects were RF+ and RF−, respectively. Logistic regression analysis revealed that SE, especially HLA-DRB1*04:05, was strongly associated with RF+ RA susceptibility (p = 2.2 × 10−73, OR ≥ 2.57, Table 2⇓). After adjustment for the effects of SE, HLA-DRB1*09:01 was found to be strongly associated with RF+ (OR 1.87, 95% CI 1.66–2.11, p = 5.9 × 10⁻²⁴, Table 2B). HLA-DRB1*13:02 and HLA-DRB1*14:01 were negatively associated with RF+ even after adjustment for the effects of SE and HLA-DRB1*09:01 (Table 2B). When we analyzed associations of amino acid positions using the omnibus test, amino acid position 11, the most important position to ACPA+ RA, showed the strongest association (p = 8.0 × 10−83, Figure 1B), followed by 74, 47/67, and 57/71 in conditioning analyses (Supplementary Figure 1, available with the online version of this article). Removing the ACPA− patients with RA did not alter the results (Supplementary Table 1, available with the online version of this article). These results were similar to those recently reported in ACPA+ RA29. When we analyzed RF− RA, SE alleles were significantly associated with RF− RA susceptibility with a weaker effect size than RF+ RA (OR 1.57, 95% CI 1.31–1.87, p = 7.4 × 10⁻⁷, Table 2A). When we conditioned on SE status, HLA-DRB1*13:02 was negatively associated with RF− RA (OR 0.54, 95% CI 0.36–0.80, p = 0.0022, Supplementary Table 2). These results were very similar to our previous study for ACPA− RA11. Because just 27.1% of the subjects were positive for ACPA, we did not analyze the ACPA+ RF− subset. The omnibus test revealed that amino acid position 67 showed a significant association (p = 8.4 × 10⁻⁷, Figure 1B) with substantial difference from amino acid position 11 (p for AA 11 = 0.0015). When we conditioned on amino acid position 67, amino acid position 38 revealed a significant association (Supplementary Figure 2). After conditioning on these 2 positions, no other positions showed significant associations (Supplementary Figure 2).
Associations between RF− RA and HLA-DRB1 alleles in comparison with healthy controls (HC).
Associations between RF+ RA (n = 2529) and HLA-DRB1 alleles in comparison with healthy controls (n = 2008). AF of healthy controls is the same as in Table 2A.
Associations between RA subset and HLA-DRB1
Next, we moved on to detailed analyses among RF+ RA by taking advantage of the consecutive data of RF. RF levels are known to fluctuate across the disease course and we noticed that a considerable number of patients whose maximal levels of RF were beyond cutoff level of positivity also showed negative RF values at multiple data points. We defined the RF data showing both positive and negative values in the same patient as seroconversion. Thus, we further divided RF+ RA into 2 groups, seroconversion and constant RF+ (Figure 1A, and Supplementary Table 3, available with the online version of this article). We included subjects with more than 5 RF data timepoints for this classification, because it did not seem appropriate to classify into 2 subsets subjects with only a limited number of RF data timepoints.
Associations between constant RF+ group and HLA-DRB1
Then we examined whether seroconversion of RF affects the association pattern with HLA-DRB1 alleles. We compared the constant RF+ group with healthy controls. SE was associated with the constant RF+ group as well (OR 2.23, 95% CI 1.99–2.50, p = 1.1 × 10−42; Table 3A). Removing the ACPA− patients with RA had no influence on the results (Supplementary Table 4, available with the online version of this article). Significant association was observed between HLA-DRB1*09:01 and constant RF+ group even after adjustment for the effects of SE. We found that HLA-DRB1*13:02 was negatively associated with the constant RF+ group even after adjustment for the effects of SE and HLA-DRB1*09:01 (Supplementary Table 5). HLA-DRB1*14:01 was negatively associated after adjustment for the effects of SE, HLA-DRB1*09:01, and HLA-DRB1*13:02 (OR 0.43, 95% CI 0.29–0.64, p = 3.7 × 10⁻⁵). HLA-DRB1*08:02 was negatively associated even after adjustment for the effects of SE, HLA-DRB1*09:01, HLA-DRB1*13:02, and HLA-DRB1*14:01 (OR 0.54, 95% CI 0.39–0.75, p = 1.9 × 10⁻⁴). The omnibus test revealed that amino acid position 11 showed the strongest association, followed by positions of 74, 71, and 67 (Figure 1C, and Supplementary Figure 3), all of which were previously reported as showing associations with ACPA+ RA in Asian populations8.
Associations between RA subset and HLA-DRB1 alleles in comparison with healthy controls.
Associations between seroconversion group and HLA-DRB1
We next compared the seroconversion group with healthy controls. HLA-DRB1*04:05 was associated with the seroconversion group. The association between SE and the seroconversion group was also observed (OR 2.94, 95% CI 2.58–3.35, p = 5.5 × 10−60, Table 3A). The results did not change when ACPA− patients with RA were removed (Supplementary Table 4, available with the online version of this article). After adjustment for the effects of SE, we found that HLA-DRB1*09:01 was positively associated (OR 1.91, 95% CI 1.63–2.24, p = 2.1 × 10⁻¹⁵, Supplementary Table 6). The omnibus test revealed that amino acid position 11, followed by 74, and 70 showed the associations (Figure 1C, and Supplementary Figure 4). We compared RF-positive to negative subgroup and RF-negative to positive subgroup, and found no significant differences between these 2 subgroups.
Comparison of seroconversion group and constant RF+ group
When we compared seroconversion group with constant RF+ group directly, we found that SE tended to be more enriched in the seroconversion group compared to the constant RF+ group (OR 1.32, 95% CI 1.16–1.51, p = 2.0 × 10⁻⁵, Table 3B, and Figure 2A). Further, all of the SE alleles in the seroconversion group had higher frequency than the constant RF+ group (binomial test, p = 0.031), although the difference of each allele did not reach statistical significance. No alleles were significantly related after adjustment for the effects of SE (Supplementary Table 7, available with the online version of this article). The omnibus test revealed that there was significant difference observed for amino acid position 11 (p = 2.7 × 10⁻⁵, Figure 2B). When we regressed out the associations of position 11, SE was no longer significant (p = 0.077), suggesting that the association of SE depends on amino acid position 11.
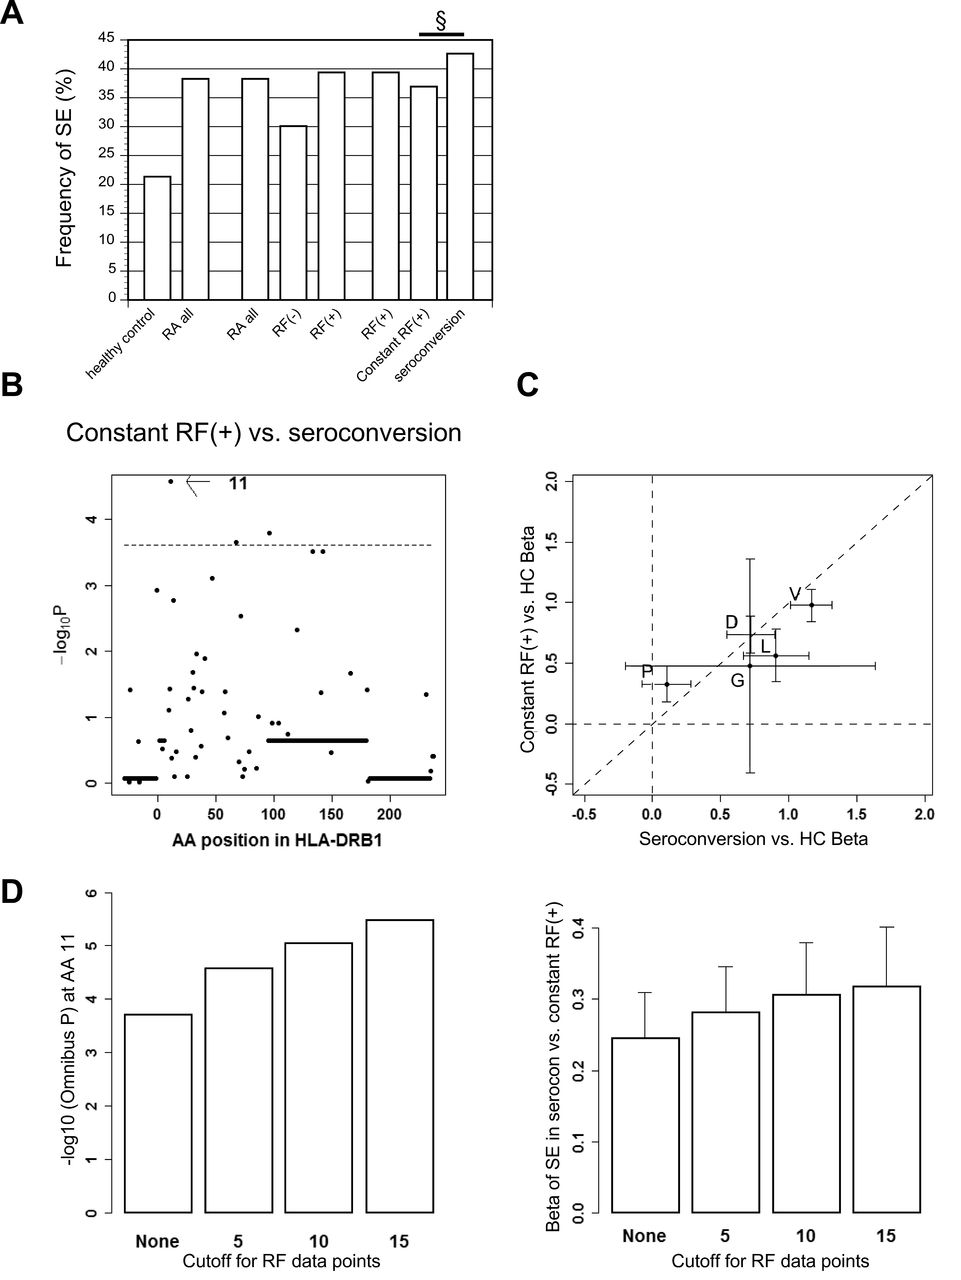
RF+ subset consists of 2 genetically distinct subsets, the seroconversion group and the constant RF+ group. (A) Frequency of SE alleles in each subset is shown. A p value between the seroconversion group and constant RF+ group is indicated. § p < 0.001. (B) Omnibus p values are shown for each HLA-DRB1 AA position of seroconversion subgroup compared with constant RF+ subgroup. The horizontal line indicates the level of significance (p = 0.00024). (C) Coefficients of HLA-DRB1 AA residues at position 11 in omnibus test using serine residue as a reference are compared between the 2 models (seroconversion group compared with healthy controls on the X-axis, and constant RF+ group compared with healthy controls on the Y-axis). The 95% CI is drawn on each plot. The diagonal line indicates y = x. (D) Left panel: Omnibus p values are shown for AA position 11 between the seroconversion and constant RF+ groups with each cutoff for RF data points. Right panel: Beta of SE are shown with standard error of susceptibility to the seroconversion group referring to the constant RF+ group with each cutoff for RF data points. RA: rheumatoid arthritis; SE: shared epitope; RF: rheumatoid factor; HC: healthy controls; AA: amino acid; P: proline; V: valine; D: aspartic acid; L: leucine; G: glycine.
Different associations of HLA-DRB1 alleles among RA subsets.
Conditional analyses on ACPA positivity or medications
Because the seroconversion group showed more RA-like genetic associations than the constant RF+ group, we performed conditional analyses on ACPA positivity to confirm that these associations were not confounded by ACPA. We found that the seroconversion group showed a rather lower rate of ACPA positivity than the constant RF+ group (p = 3.3 × 10⁻⁶; Supplementary Figure 5 and Supplementary Table 3, available with the online version of this article) and that we obtained rather stronger associations especially with SE in conditional analyses (Supplementary Figure 6). These data indicate a genetic difference between the 2 subgroups in the RF-positive subjects. In fact, we found that the association patterns of amino acid residues at position 11 against healthy controls differed between the 2 groups (p = 0.046, Figure 2C).
We also performed conditional analyses on usage of methotrexate (MTX) and biological disease-modifying antirheumatic drugs (bDMARD) to confirm that these associations were not confounded by treatment. MTX and bDMARD usage were similar between the seroconversion and constant RF+ groups (MTX usage 86.6% in the seroconversion group, 85.7% in the constant RF+ group; bDMARD usage 25.1% in the seroconversion group, 25.2% in the constant RF+ group). We obtained similar associations with SE in conditional analyses (OR 1.32, 95% CI 1.16–1.51, p = 2.3 × 10⁻⁵). We also found the consistent results in the conditional analyses with use of covariates in Supplementary Table 3 (data not shown).
Stratification based on RF data points
When we set different cutoff levels for numbers of RF data to include in the subdivision of RF+ RA, we found that the difference between the 2 groups was consistently observed, with a tendency to become more prominent with the increase in the number of data points in a dose-dependent manner, suggesting a possible contamination of subjects with limited number of data points (Figure 2D). These results were further enhanced in the conditional analysis on ACPA positivity (Supplementary Figure 6, available with the online version of this article). When we applied cutoff for RF data points only to the constant RF+ group, we observed very similar results (data not shown). Further, the associations we found between the seroconversion and constant RF+ groups were consistent when we put the number of RF timepoints as a covariate (data not shown). We also analyzed with a random sampled dataset with 5 measurements to confirm the associations were not confounded by RF timepoints. With a random sampled dataset, SE was associated with the seroconversion group compared with controls (OR 3.25, 95% CI 2.82–3.75, p = 1.5 × 10−58). SE was associated with the constant RF+ group compared with controls (OR 2.39, 95% CI 2.13–2.68, p = 5.7 × 10−51). SE was more enriched in the seroconversion group compared with the constant RF+ group (OR 1.35, 95% CI 1.18–1.55, p = 1.6 × 10⁻⁵). These results were similar to the previous analyses. Thus, we concluded that RF timepoints did not confound the associations.
Associations between maximal titer of RF and HLA-DRB1 alleles
We further analyzed the associations between maximal titer of RF and HLA-DRB1 in the 2529 RF+ subjects, especially focusing on HLA-DRB1 alleles or amino acid positions associated with ACPA levels. In contrast to the strong association of HLA-DRB1*09:01 with reduced ACPA levels (p = 3.8 × 10−42), no significant associations were observed between HLA-DRB1*09:01 and maximal RF titer (p = 0.70, Figure 3A, and Supplementary Table 8, available with the online version of this article). SE was negatively correlated with maximal RF levels, but the difference was not statistically significant (p = 0.012, Supplementary Table 8). HLA-DRB1*10:01 was the only allele that showed significant association with maximal RF levels, and this allele was associated with reduced maximal RF levels (p = 0.00034). Moreover, no significant associations were observed between standardized coefficients of linear regression analysis of HLA-DRB1 alleles with maximal RF titer and that with CCP levels (ρ = −0.090, p = 0.70, Figure 3A). The omnibus test revealed that amino acid position 67 showed the highest signal (p = 1.7 × 10⁻⁴, Figure 3B), while positions 74 and 60, the first and second strongest positions with ACPA level in the Japanese, showed associations far from significance (p ≥ 0.11, Figure 3B). These results indicate that genetic architecture underlying RF levels is quite different from that of ACPA levels.
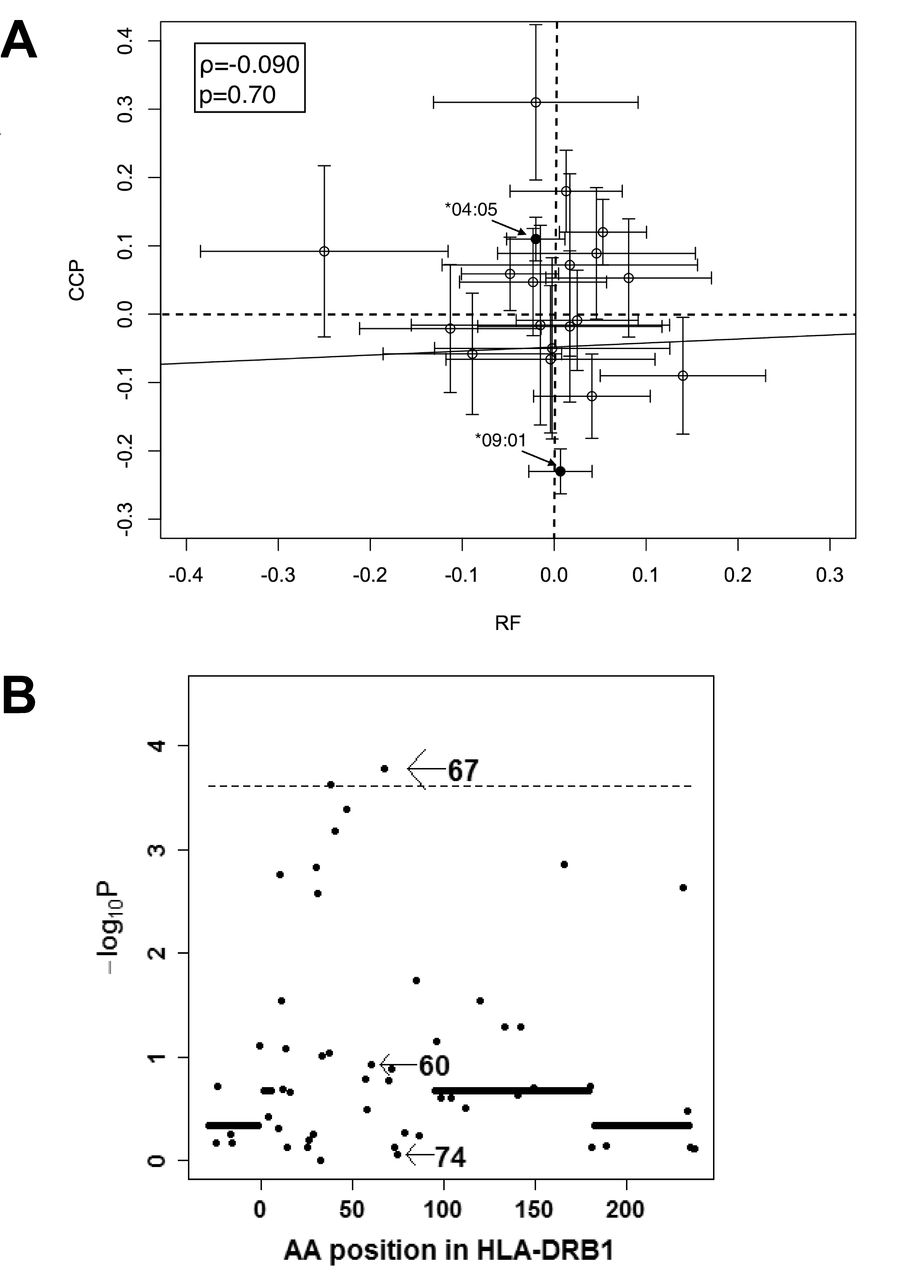
HLA-DRB1 genetic architecture underlying RF levels is distinct from that of ACPA. (A) Standardized coefficients calculated by linear regression analysis of HLA-DRB1 alleles with maximal RF titer are plotted on the X-axis. Standardized coefficients with CCP levels are plotted against the Y-axis. On each plot, 95% CI are shown, together with the regression line. Coefficient of correlation value (ϱ) and p value were determined with Spearman’s correlation analysis. (B) Results are indicated of the omnibus test for levels of RF. ACPA: anticitrullinated protein antibodies; CCP: cyclic citrullinated peptide; RF: rheumatoid factor; AA: amino acid.
DISCUSSION
We defined RA subsets according to consistent RF positivity and showed that while subdivision based on RF positivity showed similar genetic components to that based on ACPA positivity, subdivision of RF+ RA showed 2 genetically distinct groups. SE was rather enriched in the seroconversion group and amino acid position 11 could primarily explain the genetic difference among RF+ RA cases. This is similar to the genetic components to RA susceptibility because classic genetic studies using allelic information revealed enrichment of SE first, followed by identification of primary association of amino acid position 11 in HLA-DRB1.
RF− RA showed very similar associations of HLA-DRB1 alleles to ACPA− RA. It is interesting that HLA-DRB1 amino acid position 11 did not show a very strong signal in association with RF− RA in our current study. RF+ RA showed similar associations of HLA-DRB1 alleles and amino acid positions to ACPA+ RA.
Although RF titer changes during the disease course, most of the previous studies categorized RA into simply “seropositive” and “seronegative” groups. Most of the studies defined seropositivity with the RF status at onset or at the time of inclusion into the study group. These definitions might not be accurate to reflect genetic components because seroconversion from negative to positive or vice versa occurs frequently. In fact, 42.3% of RA subjects in the current study were negative for RF at least once. Further, 38.3% of RF+ RA could be classified into the seroconversion group in our study. Our findings suggest that the seroconversion group, which consists of a mixture of the conventional seropositive and seronegative subjects, has different genetic characteristics among RF+ RA. The current findings suggest the importance of integrating multiple RF data for subdivision of RA.
The seroconversion group is more strongly associated with SE and amino acid position 11, indicating enrichment of genetic components characterizing the conventional “seropositive RA.” These results were somewhat unexpected; we expected to see mixed genetic background representing a mixture of seropositive and seronegative RA characteristics.
Based on genetic differences between the seroconversion and constant RF+ groups, it would be interesting to interpret these 2 subsets in RF+ RA in the clinical settings. Further studies with expanded RA subjects with detailed clinical information are needed to elucidate clinical difference including responsiveness to treatment and RA progression between these subsets. It would also be interesting to analyze data in white populations to confirm the findings.
In our study, we chose maximal RF titer as the variable that represents RF level to avoid misclassification as RF−, because RF fluctuates over the disease course. Especially, effective treatment often lowers RF levels. We focused only on RF+ RA for the analyses of RF level because we would like to exclude genetic effects on RF positivity. We showed that HLA-DRB1*09:01 was not associated with maximal RF levels. This result is completely different from the association of HLA-DRB1*09:01 with ACPA titer; HLA-DRB1*09:01 is the strongest allele associated with titer of ACPA30,31. Even though SE is associated with positivity of RF, we found that SE was negatively associated with maximal RF titer. This finding is also different from ACPA titer. Further, the omnibus test did not reveal an association between RF levels and amino acid position 74, which showed the strongest signal with ACPA levels. Taken together, genetic architecture of RF levels is quite different from that of ACPA.
Our previous study showed at least a partial overlap of genetic components between ACPA positivity and ACPA levels26. Because positivity of RF displayed similar genetic associations to ACPA, genetic components contributing to positivity and levels of RF might be different and genetic components are not very strongly associated with RF levels in RF+ RA. This idea might explain the lack of association of HLA-DRB1 with finger joint destruction conditioned on non–finger joint destruction in our previous study, in spite of the strong association between RF levels and finger joint destruction in RF+ RA19.
The majority of patients with RA are double-positive for RF and ACPA. These 2 autoantibodies are hallmarks of RA and are included in the classification criteria23,24. Both RF and ACPA are associated with severity of RA and specific HLA-DRB1 alleles or amino acid positions. Although it has been assumed that the genetic backgrounds for RF and ACPA are similar, our current study suggests different genetic architectures in production of RF and ACPA. Our results show that the genetic basis for developing RF and ACPA is more complex than expected. More detailed analysis for genetic and environmental factors regarding ACPA and RF production would reveal similarity and difference in production mechanisms of these autoantibodies and clinical associations.
Our study revealed that the seroconversion group has distinct genetic characteristics among RA and that the genetic architecture of RF levels is different from that of ACPA. Further studies focusing on clinical characteristics of the seroconversion group are warranted to elucidate that this group has distinct characteristics in RA.
ONLINE SUPPLEMENT
Supplementary material accompanies the online version of this article.
Acknowledgment
We thank all of the doctors and staff of Kyoto University and Tokyo Women’s Medical University.
Footnotes
Supported by JSPS KAKENHI grant number JP16H06251.
- Accepted for publication October 25, 2017.


