

Abstract
Objective. The aim was to identify plasma (i.e., cell-free) microRNA (miRNA) predicting antitumor necrosis and/or methotrexate (MTX) treatment response in patients enrolled in an investigator-initiated, prospective, double-blinded, placebo-controlled trial (The OPERA study, NCT00660647).
Methods. We included 180 disease-modifying antirheumatic drug–naive patients with early rheumatoid arthritis (RA) randomized to adalimumab (ADA; n = 89) or placebo (n = 91) in combination with MTX. Plasma samples before and 3 months after treatment initiation were analyzed for 91 specific miRNA by quantitative reverse transcriptase-polymerase chain reaction on microfluidic dynamic arrays. A linear mixed-effects model was used to test for associations between pretreatment miRNA and changes in miRNA expression and American College of Rheumatology/European League Against Rheumatism (ACR/EULAR) Boolean (28 joints) remission at 3 and 12 months, applying false discovery rate correction for multiple testing. Using leave-one-out cross validation, we built predictive multivariate miRNA models and estimated classification performances using receiver-operating characteristics (ROC) curves.
Results. In the ADA group, a higher pretreatment level of miR-27a-3p was significantly associated with remission at 12 months. The level decreased in remitting patients between pretreatment and 3 months, and increased in nonremitting patients. No associations were found in the placebo group receiving only MTX. Two multivariate miRNA models were able to predict response to ADA treatment after 3 and 12 months, with 63% and 82% area under the ROC curves, respectively.
Conclusion. We identified miR-27a-3p as a potential predictive biomarker of ACR/EULAR remission in patients with early RA treated with ADA in combination with MTX. We conclude that pretreatment plasma-miRNA profiles may be of predictive value, but the results need confirmation in independent cohorts.
The treatment of patients with rheumatoid arthritis (RA) has improved in the last 2 decades, partly because of the use of tumor necrosis factor inhibitors (anti-TNF). However, one-third of patients with RA do not respond to the expensive anti-TNF drugs1. The discovery of new predictors of treatment response could enable a more individualized treatment strategy. Therefore, RNA and protein expression profiling, as well as genetic, epigenetic, paraclinical, and clinical markers as predictors of treatment response to anti-TNF have been studied intensively over the last few years2,3,4. Unfortunately, none have been useful in clinical practice.
MicroRNA (miRNA) are short, single-stranded, noncoding RNA involved in the posttranscriptional regulation of gene expression5. They repress protein expression by inhibiting mRNA translation. Aberrant miRNA levels in RA have been found in plasma, whole blood, peripheral blood mononuclear cells, synovial fluid, and cells lining the joint capsule, and in particular involve miR-146, -155, -16, and -2236,7,8,9. MiRNA found altered in RA may potentially predict treatment response. Many experimentally validated miRNA-target interactions are known and described in mirTarBase10.
We recently validated the association between an altered response to anti-TNF treatment and a polymorphism in the gene encoding interleukin 1 (IL-1) receptor–associated kinase 3 (IRAK-3), a negative regulator of Toll-like receptor signaling11. Molecules influencing TNF-inhibitor response may represent targets for fine-tuning by miRNA.
Previously, Castro-Villegas, et al reported a plasma miRNA-profile consisting of miR-23-3p and miR-223-3p as predictive of European League Against Rheumatism (EULAR) good/moderate response in patients with established RA12. Krintel, et al investigated whole blood miRNA in 180 patients with early RA enrolled in a double-blind, placebo-controlled trial comparing adalimumab (ADA) or placebo–ADA (the OPERA study), and found that the combination of low miR-22 and high miR-886-3p was associated with EULAR good response13.
High levels of blood cell miRNA might conceal specific patterns in whole blood miRNA analysis14. Thus in our present study, we aimed to identify plasma [i.e., cell-free, miRNA predicting anti-TNF and/or methotrexate (MTX)] treatment response in the patients of the OPERA study. We also examined changes in miRNA profiles occurring during 3 months of anti-TNF treatment. We did this by analyzing plasma samples prior to and after 3 months of therapy. The 91 miRNA specificities were chosen based on their associations with autoimmune disease or on their validated miRNA-target interactions in pattern recognition signaling pathways.
MATERIALS AND METHODS
Patients
A total of 180 patients with early RA were included in the Danish OPERA study, which is an investigator-initiated, randomized, double-blind, placebo-controlled study15 (Figure 1). The patients were randomized 1:1 to ADA 40 mg or placebo (saline) subcutaneously every other week in combination with MTX. Swollen joints were injected with triamcinolone hexacetonide. Oral glucocorticoids were not allowed. During the first year, among patients treated with ADA having available response data, 1 patient changed to open-label ADA, 1 changed to infliximab (IFX), 2 changed to etanercept (ETN), and 2 patients discontinued biologic treatment. In the placebo + MTX group, 2 patients discontinued placebo + MTX and continued on disease-modifying antirheumatic drugs (DMARD), and 1 patient started ETN treatment. The treatment target was 28-joint Disease Activity Score (DAS)28–C-reactive protein (CRP) < 3.2 and no swollen joints.
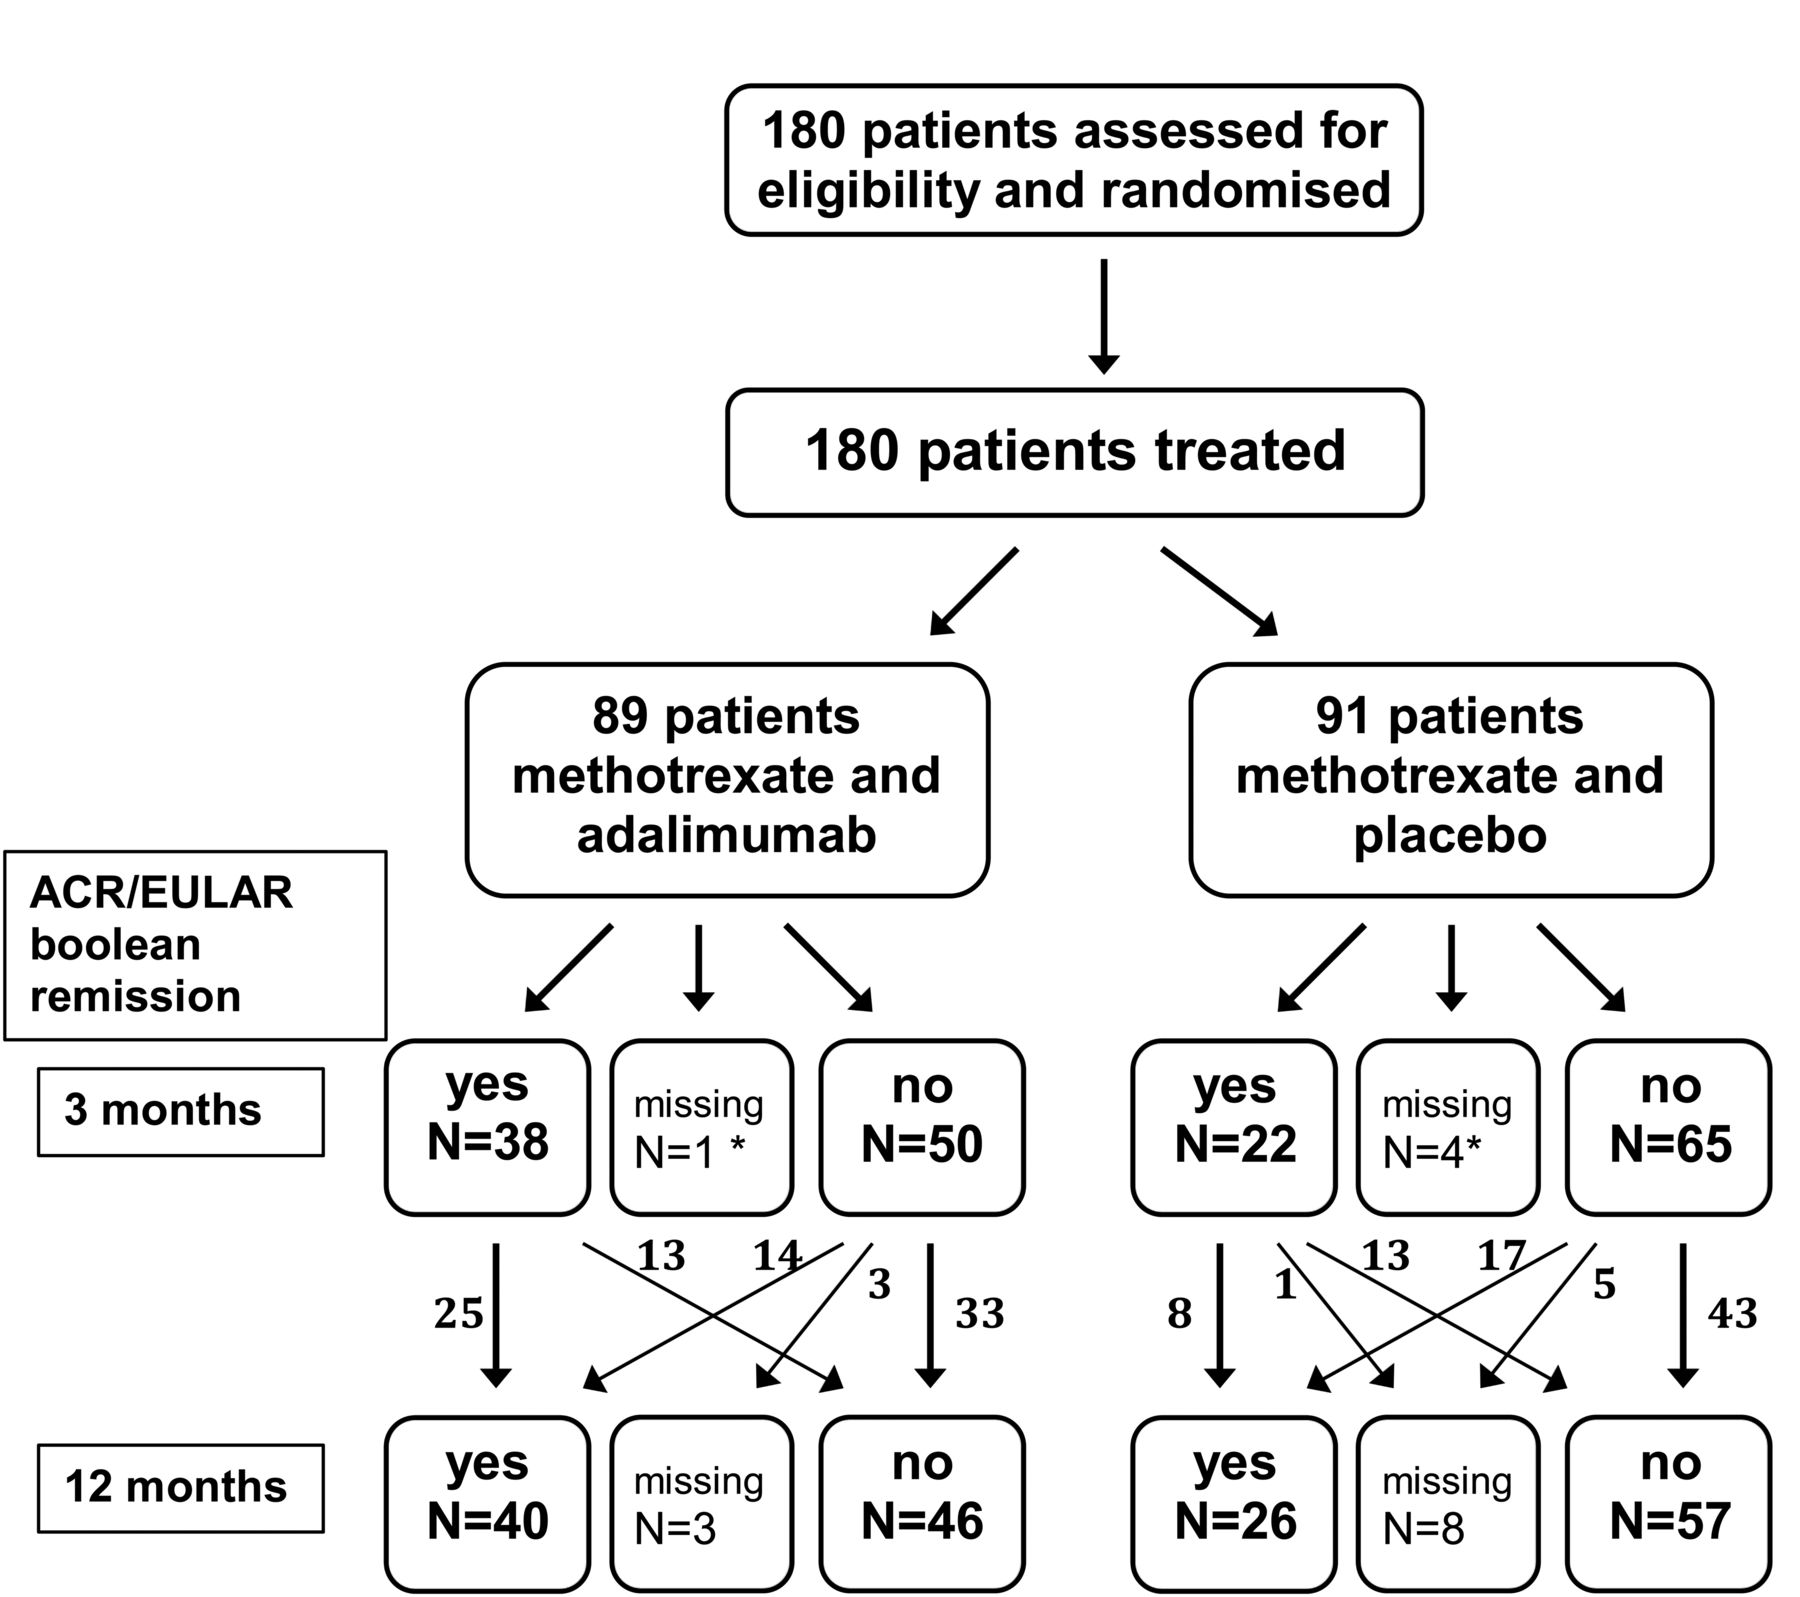
Randomization and remission. Flow diagram of randomization to treatment groups and ACR/EULAR Boolean remission at 3 and 12 months. Patient blood samples were taken at baseline and 3 months. Data are number of patients with response data. *Data on treatment response were missing for 5 patients (2.8%) at 3 months and for 11 patients (6.1%) at 12 months. ACR/EULAR: American College of Rheumatology/European League Against Rheumatism.
Ethics
The National Health Authorities and Ethics Committee approved the trial (20070008), which was performed in accordance with the Declaration of Helsinki. Written informed consent was obtained from all patients prior to enrollment. The trial was registered at www.clinicaltrials.gov (NCT00660647).
Samples
There were 180 pretreatment and 172 three-month posttreatment EDTA plasma samples obtained from 180 patients enrolled at 15 Danish hospitals. Samples were centrifuged at room temperature at 2000 × g for 10 min and plasma stored at −80°C within 2 h of collection.
RNA purification
Total RNA purification kit (Norgen Biotek Corp.) was used to purify RNA from 100 μl plasma samples according to the instructions of the manufacturer, with small modifications: 10 mM dithiothreitol (Sigma-Aldrich Co. LLC) and 1.7 pM synthetic C. elegans miR-54 and -238 (Tag Copenhagen A/S) were added into lysis buffer. One μl of RNAse inhibitor [20 U/μl, Applied Biosystems (ABI)] was added to tubes into which RNA was eluted. Purified RNA samples were kept at −20°C until used.
Reverse transcription
Reverse transcription (RT) was performed by the TaqMan microRNA Reverse Transcription Kit (ABI) according to the instructions of the manufacturer, with modifications. The RT Primer Mix consisted of equal volumes of 93 different 5 × RT miR-specific stem-loop primers (ABI) for the chosen miRNA (Supplementary Table 1, available with the online version of this article). Each RT reaction volume was 10 µl using 1 µl MultiScribe Reverse Transcriptase, 3 µl RT primer mix, 1 µl 10 × buffer, 0.2 µl 100 mM deoxynucleotides, 0.15 µl RNase inhibitor, and 4.65 µl RNA purified from plasma. RT was performed on an ABI 2720 Thermal Cycler (ABI; 16°C, 30 min; 42°C, 30 min; 85°C, 5 min; hold at 4°C). Samples were kept at −20°C until used.
Preamplification
Specific target amplification of the cDNA was accomplished using the TaqMan PreAmp master mix (ABI) and a mix of the TaqMan MicroRNA Assays (ABI) consisting of equal volumes of the 93 different 20 × assays diluted with 1 × Tris-EDTA buffer to a final concentration of 0.2 ×. Preamplification mixtures (5 µl) contained cDNA (diluted 1:3 with nuclease-free H2O) 1.25 µl, mixed with 2.5 µl 2 × TaqMan PreAmp master mix and 1.25 µl of the 0.2 × TaqMan miR-assay mix. Preamplification was performed on an ABI 2720 Thermal Cycler with a program at 95°C for 10 min; 16 cycles of 95°C, 15 s; 60°C, 4 min; hold at 4°C. Samples were kept at −20°C until used.
Quantitative PCR
Preamplified samples (diluted 1:5 with nuclease-free H2O) and TaqMan 20 × assays miRNA were applied to primed 96.96 dynamic array chips using loading and assay reagents according to the manufacturer (Fluidigm Corp.). All miR-assays were performed in duplicate. Eight 96 × 96 chips (Fluidigm) with 93 different miR assays were used (Supplementary Table 2, available with the online version of this article). Samples were loaded randomly in terms of placebo or ADA status, but pretreatment and 3-month samples from the same patients were always loaded on the same chip. After loading the reaction chambers using the integrated fluid circuit HX controller, the real-time PCR including image capture after each cycle was performed in a BioMark real-time PCR system (Fluidigm) using single probe (FAM-MGB, reference: ROX) settings and GE 96 × 96 standard v1 protocol with 40 cycles. Data processing took place using the Fluidigm real-time PCR analysis software (version 4.1.2).
Data handling
In the array data analysis, the auto detector setting was first chosen for data from all the chip runs. User detector setting of hsa-miR-155-5p was applied in Chips 1–4, and these user detector settings were applied in Chips 5–8: hsa-miR-107, -206, -92b-5p, -208a-3p, -218-5p, -224-5p, -147b, -105-5p, -106b-5p, and -346. Average quantification cycle (Cq) values ≥ 35 were excluded from datasets. Consequently, 4 miR were undetectable (hsa-miR-92b-5p, -105-5p, -147b, and -498). Seven miR with uncharacteristic amplification curves (hsa-miR-1-3p, -31-5p, -200b-3p, -346, -369-3p, -409-3p, and -499a-5p) were also excluded. The average Cq value of each of the remaining 80 miRNA was technically normalized with the average Cq of cel-miR-54 and cel-miR-238 for that particular sample, yielding the −ΔCq values [= (average Cq of cel-miR-54 and cel-miR-238) − (average Cq of hsa-miR)]. The −ΔCq values were additionally normalized with the average −ΔCq of all detectable miR to correct for variations in total input RNA. We used the average −ΔCq of 51 miRNA detected in all samples to subtract from all miRNA-ΔCq values in each sample. These final normalized expression values were used for downstream analysis.
Statistical analyses
In our present study, American College of Rheumatology/European League Against Rheumatism (ACR/EULAR) Boolean (28 joints) remission at 3 and 12 months were chosen as primary endpoints, and data were subjected to intention-to-treat analysis16.
The primary outcome used in the original study15 was the proportion of patients with DAS28-CRP < 3.2. In contrast to our present study, data were analyzed using last observation carried forward. Therefore, differences in response rates and significance levels exist between the original study and our present study. Further, the use of different statistical software and minor corrections to the dataset cause slight differences in baseline characteristics between the studies.
To adjust for a potential hospital site-associated confounding effect on miRNA expression differences between “remission” and “non-remission” samples, a linear mixed effects model was applied in which “hospital” was the random effects variable. This model was then used for testing the univariate association between the expression pattern of each individual miRNA and treatment outcome. MiRNA with regression estimate significance levels below 0.10 (p ≤ 0.10) were feature-selected and used for further multivariate analysis. The linear mixed-effects model was performed in the R environment (version 3.2.2), using the lmer function embedded in the lmerTest R-package. Correction for multiple testing was performed using false discovery rate (FDR), and univariate associations with FDR q values < 0.1 were considered significant17.
The feature-selected miRNA were used to build a logistic regression multivariate model. The modeling was performed by stepwise elimination of miRNA with p > 0.10 within the multivariate model. The elimination proceeded until all remaining miRNA in the model remained significant at a p ≤ 0.10 level.
The multivariate logistic regression model was used to build a classifier with the purpose of predicting treatment response. Due to the limited sample size in our study, we used leave-one-out cross validation to provide an unbiased estimate of the generalized classification performance. Briefly, in this procedure, one sample is left out for testing and the remaining samples are used for training and model building. Model performance was assessed by the area under the curve (AUC) of the associated receiver-operating characteristic (ROC) curve, using the pROC R-package. Similarly, model performance was assessed for an “miRNA + clinical variables model,” including baseline values of DAS28, Health Assessment Questionnaire score, current smoking status (dichotomized), anticitrullinated protein antibodies status (positive/negative), sex, and the miRNA selected in the procedure described above.
RESULTS
Clinical characteristics and response to study medication
There were no differences in baseline clinical variables between the ADA + MTX group and the placebo + MTX group (Table 1). Further, no differences in comedication regarding initiation of triple DMARD therapy (20% vs 30%, p = 0.14) and cumulative dose of intraarticular triamcinolone (5 ml vs 7 ml, p = 0.08) during the first 12 months were found between ADA + MTX and placebo + MTX patients, respectively. Remission rate at 12 months, defined by ACR/EULAR Boolean remission, was significantly higher (p = 0.04) in the ADA group (47%) than in the placebo group (31%).
Baseline clinical and demographic characteristics.
Pretreatment miRNA associated with remission in ADA + MTX group
In total, 80 of 91 assayed miRNA were detectable (Cq values < 35) in more than 50% of the samples. Unsupervised hierarchical clustering of the miRNA expression data using Genesis18 revealed batch effects reflecting hospital sites (Supplementary Figure 1, available with the online version of this article). Therefore, we applied a linear mixed-effects model in the analysis of expression pattern of each individual miRNA and treatment outcome. This statistical model accounts for a random effect of the hospital on miRNA expression.
In the ADA + MTX group, pretreatment levels of 11 and 25 miRNA were feature-selected as potential associations with 3- and 12-month remission, respectively. These miRNA were carried forward to the multivariate analyses (Supplementary Table 3, available with the online version of this article). We found that a higher pretreatment level of miR-27a-3p was significantly associated with remission at 12 months in the ADA + MTX group (q = 0.06; Figure 2A, Supplementary Table 3). No pretreatment miRNA was significantly associated with remission at 3 months. However, these were identified in feature selection (p < 0.1) as associated with remission at both timepoints (3 and 12 mos) in this group: miR-27a-3p, -27b-3p, -223-3p, -19b-3p, -19a-3p, -10a-5p, -199-a/b-3p, and -29b-3p.

miR-27a pretreatment levels and change in levels during 3-month treatment predicts 12-month remission in the ADA + MTX group. (A) Pretreatment miR-27a-3p levels (normalized Cq) and (B) change in miR-27a-3p levels (Δ normalized Cq, q value = 0.06) compared for patients in ADA group in ACR/EULAR R versus NR at 12 months. Comparisons between groups were analyzed using a linear mixed-effects model with hospital as the random effect. Horizontal lines mark medians. Negative values of Δ normalized Cq represent a decrease in circulating miRNA levels between pretreatment and 3-month samples. FDR corrected q value = 0.007. ADA: adalimumab; MTX: methotrexate. R: remission; NR: nonremission; Cq: quantification cycle; ACR/EULAR: American College of Rheumatology/European League Against Rheumatism.
Pretreatment miRNA associated with remission in the placebo + MTX group
In the univariate analyses of the placebo + MTX group, 10 miRNA were feature-selected for further multivariate analyses using ACR/EULAR Boolean remission at both 3 and 12 months (Supplementary Table 4, available with the online version of this article). None remained univariately associated after correction for multiple testing.
Three-month miRNA associated with remission at 12 months
We analyzed whether miRNA levels at 3 months were predictive of remission at 12 months (results for analyses of all 80 miRNA are shown in Supplementary Table 5, available with the online version of this article). Data show no associations in either the treatment or the placebo group.
Three-month changes in miRNA associated with remission at 12 months
We analyzed whether a change in miRNA levels from pretreatment to 3 months was predictive of remission at 12 months (results for all 80 miRNA are shown in Supplementary Table 6, available with the online version of this article). In the adalimumab + MTX group, miR-27a-3p decreased in remitting patients between pretreatment and 3 months posttreatment and increased in nonremitting patients (regression coefficient = −0.56, standard error = 0.14, p = 2 × 10⁻⁴, q = 0.02; Figure 2B). We identified no associations in the placebo + MTX group.
Predictive capability of pretreatment multivariate miRNA profile on treatment response
Multivariate logistic regression modeling resulted in profiles composed of 1 miRNA (miR-19b-3p) and 10 miRNA (miR-146b-5p, -19b-3p, -27a-3p, -16-5p, -423-5p, -27b-3p, -23a-3p, -106a-5p, -29b-3p, and -17-5p) in pretreatment samples predicting remission in the ADA + MTX group at 3 and 12 months, respectively (Figure 3). Model performances estimated by ROC curves showed AUC of 63% and 82%, respectively. Adding baseline clinical variables to the multivariate miR-model improved AUC slightly to 67% and 84%, respectively (results not shown). MiR-19b-3p was shared between the 2 profiles.
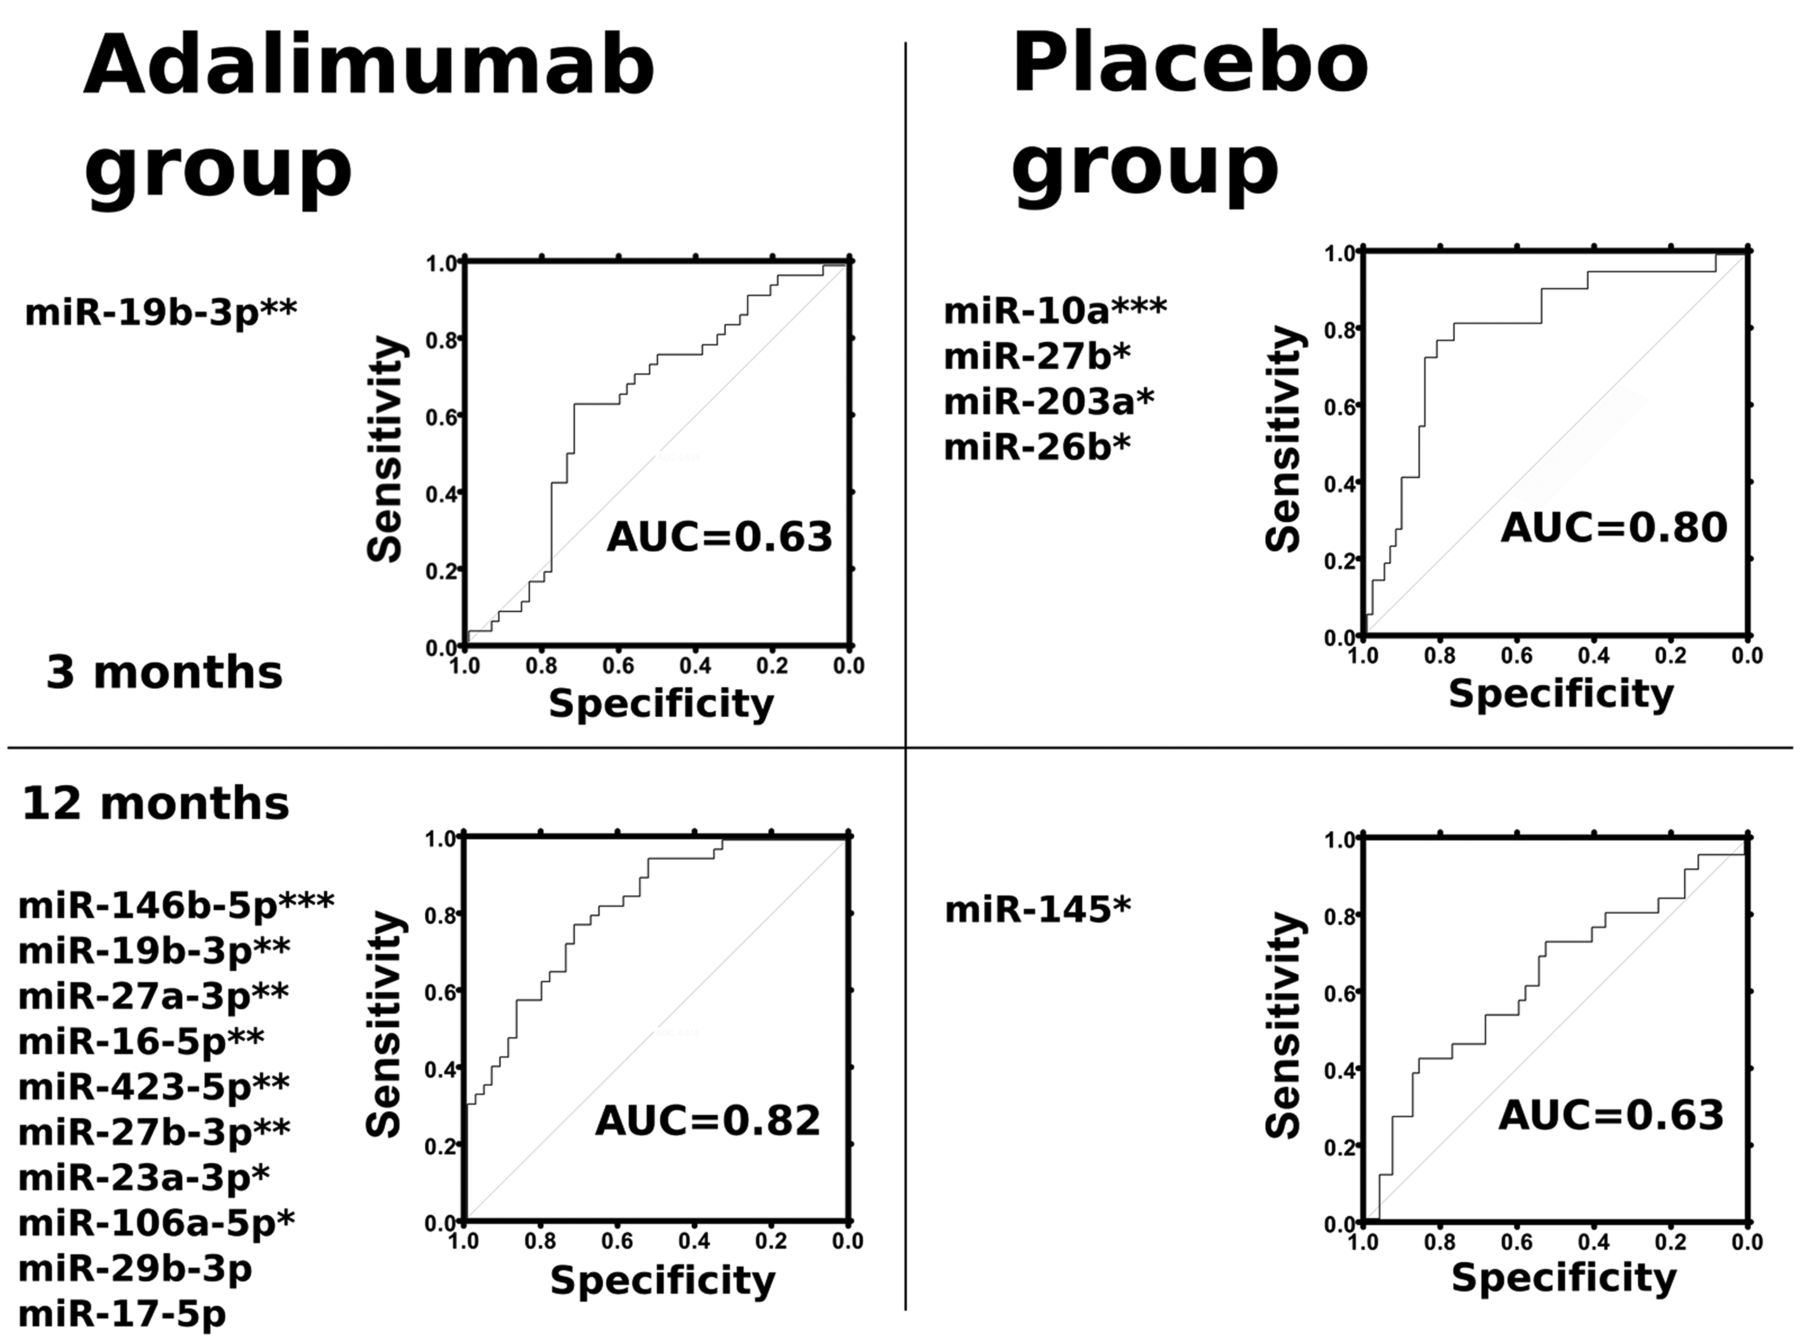
Multivariate miRNA profile predictive of ACR/EULAR remission. ROC curves for predictive performance of 3- and 12-month multivariate models in the ADA + MTX and the placebo + MTX groups. Multivariate p values: * < 0.05, ** < 0.01, *** < 0.001. ROC: receiver-operating characteristics; ADA: adalimumab; MTX: methotrexate; ACR/EULAR: American College of Rheumatology/European League Against Rheumatism; AUC: area under the curve.
In the placebo + MTX group, fitting a multivariate model from the feature-selected miRNA resulted in a 4-miRNA model (miR-10a-5p, -27b-3p, -203a-3p, and -26b-5p) predictive of 3-month remission, and a single-miRNA model (miR-145-5p) predictive of 12-month remission. AUC of the multivariate models were 80% and 63%, respectively (Figure 3).
Pretreatment levels and alterations in miR-16 and miR-22 are correlated with change in DAS28
Previous reports have demonstrated an association between miRNA levels and disease activity (DAS28)7,19. Linear regression analysis of all patients in both treatment groups showed that an increase from pretreatment to 3-month levels of miR-16-5p, -451a, -92a-3p, -10b-5p, and -29a-3p, and a decrease in miR-22-3p and -145-5p correlated with improvement in DAS28 (ΔDAS28) after 3 months (q < 0.1, Supplementary Figure 2 and Supplementary Table 7, available with the online version of this article). For these 7 miRNA, we also examined for correlations between changes in miRNA levels and changes in CRP, swollen and tender joint counts (ΔSJC and ΔTJC), and patient global visual analog scale (VAS, Supplementary Table 7). Changes in both miR-16-5p and miR-22-3p between baseline and 3 months were associated (p < 0.05) with ΔCRP, ΔSJC, ΔTJC, and Δ[patient global VAS], respectively (Supplementary Table 7).
A previous study on treatment-naive patients with early RA after conventional DMARD treatment showed that higher pretreatment levels of miR-16-5p were predictive of a larger decrease in DAS28 between baseline and 3 months, and that an increase in miR-16-5p between baseline and 3 months was followed by a decrease in DAS28 between 3 and 12 months9. In our data, among patients treated with MTX only, these associations were validated (Spearman rank; ρ = 0.41, p = 0.0002 and ρ = −0.23, p = 0.004, respectively). In similar analyses of miR-22-3p, we found inverse correlations compared to miR-16-5p (ρ = −0.26, p = 0.0006, and ρ = 0.20, p = 0.01, respectively), suggesting that patients with lower pretreatment levels of miR-22-3p and a decrease in levels between baseline and 3 months have improved responses to MTX treatment in the following 3 and 9 months, respectively.
DISCUSSION
In a cohort of patients with early RA randomized to aggressive immunosuppressive treatment with ADA, MTX, and intraarticular glucocorticoids in swollen joints, we found that a higher pretreatment level of miR-27a-3p and a decrease in miR-27a-3p level during the first 3 months were associated with ACR/EULAR Boolean remission at 12 months. We chose ACR/EULAR Boolean remission as primary outcome because this is a clinically meaningful outcome for patients with RA16. Two multivariate miRNA models were able to predict remission status at 3 and 12 months with 63% and 82% areas under the ROC curves, respectively. We also found correlations between changes in 7 miRNA (miR-16-5p, miR-22-3p, miR-451a, miR-92a-3p, miR-145-5p, miR-10b-5p, and miR-29a-3p) and change in DAS28. These associations may represent an effect of the initiated treatments on associated pathways and these miRNA may be potential biomarkers of disease activity if validated. Further, we confirmed miR-16-5p and miR-22-3p pretreatment levels and changes in levels between baseline and 3 months as predictive of response to MTX treatment after 3 and 12 months, respectively.
The 80 studied miRNA represent a substantial proportion of the readily quantifiable plasma miRNA that amount to about 250 species20. In the OPERA cohort study, Krintel, et al recently found that low pretreatment miR-22 in whole blood was a predictor of EULAR good versus moderate/none response to ADA13. Here, using plasma from the same patients, miR-22 was neither predictive of ACR/EULAR Boolean remission nor EULAR response (not shown). However, lower pretreatment levels of miR-22 correlated with a larger decrease in DAS28 (inverse correlation) during the first 3 months among patients treated with synthetic DMARD only. It is well known that there are vast differences between miRNA profiles in whole blood and in serum and plasma21. The underlying mechanisms of how miRNA are released to plasma from each blood cell compartment are complex and largely unknown22,23,24. Thus, plasma levels of miR-22 may not readily reflect whole blood levels of miR-22.
Castro-Villegas, et al analyzed serum at 0 and 6 months from 95 patients with RA treated with an anti-TNF-α/DMARD combination therapy, and with a previous inadequate response to at least 2 DMARD12. Patients were treated with IFX (n = 55), ETN (n = 25), or ADA (n = 15). The data suggest that low pretreatment levels of miR-23a-3p and miR-223-3p are both biomarkers and predictors of EULAR good or moderate response to treatment. We found no association with ACR/EULAR Boolean remission for these miRNA, except for a trend (p = 0.01) for high pretreatment levels of miR-23a-3p among good responders at 12 months.
The main aim of our study was to identify miRNA predicting treatment response in patients with early RA in ADA and/or MTX treatment. MiR-27a was identified as the most promising candidate among the 91 analyzed miRNA, and in the multivariate analyses, miR-19b-3p remained in both of the final models predicting the treatment response at 3 and 12 months. A recent study of 18 Chinese patients with RA undergoing synovectomy showed decreased miR-27a levels in the serum, synovial tissue, and fibroblast-like synoviocytes, compared with healthy controls25. Low expression of miR-19b-3p is found in RA fibroblast-like synoviocytes (RA FLS)26.
We found that patients in the anti-TNF treatment arm with higher pretreatment level or with a decrease in miR-27a-3p level during the first 3 months had better treatment responses, suggesting that miR-27a levels in plasma may characterize yet unidentified subtypes of RA.
Both miR-27a and miR-19b target several hundred genes and our study does not indicate which of the target interactions might be important for anti-TNF responses (Figure 4). However, in an in vitro study of dendritic cells, it was shown that miR-27a targets transcripts (p38, MAP2K4, MAP2K7, and TAB3) in the mitogen-activated protein kinases (MAPK) signaling pathway, and that miR-27a transfection lowered protein levels of multiple cytokines, including TNF-α, IL-1β, IL-6, IL-12, and IL-2327. It is interesting that an miRNA that targets cytokine expression is associated with ADA treatment response. Changes in plasma levels of miRNA, however, do not necessarily mirror intracellular changes in a simple way. Intracellularly increased miRNA may be more retained in the cell with less release to the circulation but may also be associated with increased plasma concentration24. Differences in miRNA clearance rates from the circulation may also contribute to the differences in measured miRNA abundance. Therefore, the specific pathophysiological mechanisms involved in the miR-27a association with treatment response observed in our study remain to be elucidated.
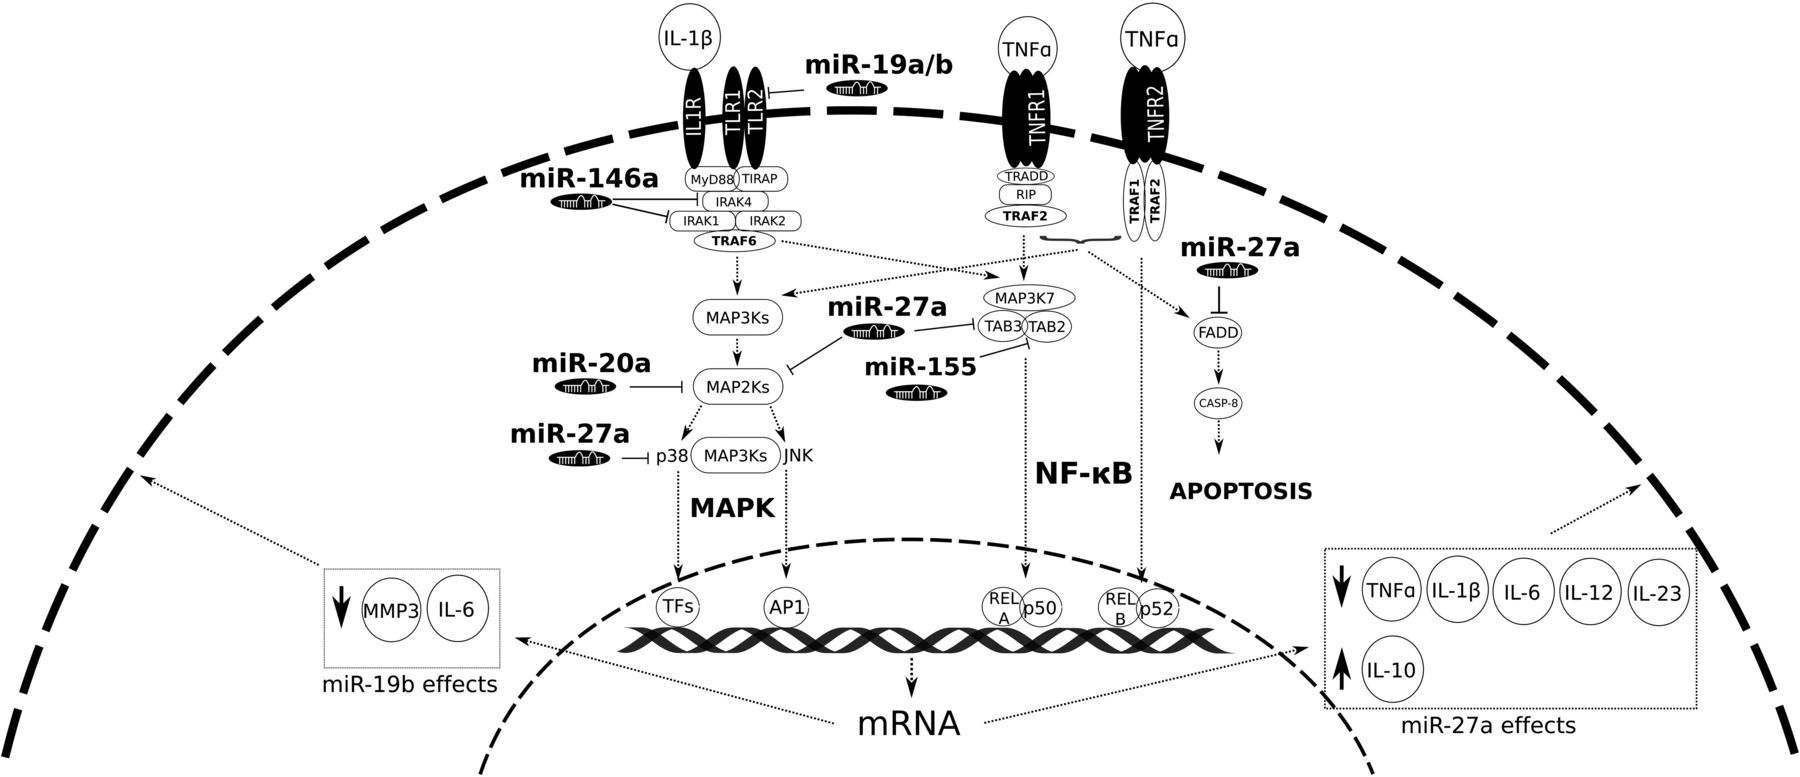
Potentially relevant target interactions of miR-27a and miR-19b. Simplified sketch of signaling molecules in TLR/MAPK signaling pathways. MiR-19a-3p and miR-27a-3p associated with remission in response to ADA + MTX treatment have targets in these pathways. Previously, 3 miRNA with known targets in these pathways have been found upregulated in RA fibroblast-like synoviocytes (miR-146a, miR-155, and miR-20a6,34). TLR: Toll-like receptor; MAPK: mitogen-activated protein kinases; ADA: adalimumab; MTX: methotrexate; RA: rheumatoid arthritis; MMP: matrix metalloprotease; IL: interleukin; TNF-α: tumor necrosis factor-α; NF-κB: nuclear factor-κB.
Efforts are being made to identify distinct RA synovial tissue phenotypes/pathotypes that may explain the heterogeneity in RA treatment response28,29,30. It is possible that the specific miRNA expression is a marker of a specific phenotype responsive to anti-TNF treatment while not being functionally important by itself. Notwithstanding the unclear functional roles of the miRNA, a circulating miRNA anti-TNF treatment-predictive profile would be very valuable. Based on an ROC curve, the multivariate 10-miRNA model was able to predict the outcome at 12 months in the ADA + MTX group (82% AUC).
In patients with RA, increased miR-16 is found in monocytes and synovial fluid, and plasma miR-16 correlates with disease activity (DAS28)7;19. We confirmed the correlation between miR-16 and DAS28. Also, miR-16 levels correlated with CRP, TJC, SJC, and patient global VAS. Filková, et al reported that miR-16-5p predicts MTX treatment response in patients with early RA9. We did not find miR-16-5p predictive of ACR/EULAR Boolean remission. However, we confirmed that patients with higher pretreatment levels of miR-16-5p and an increase in levels between baseline and 3 months have improved responses (larger decreases in DAS28) to MTX after 3 and 9 months.
Generally, there has been a lack of consistency between miRNA reported as biomarkers of disease, prognosis, or treatment response31. This is likely due to the lack of consistently performed methodology and a lack of well-characterized, uniformly treated patients with comparable disease duration in standardized settings. Patients included in our study all had early RA and were originally included as part of a multicenter, double-blind, randomized controlled trial. We used a sensitive PCR platform for quantification of miRNA levels and 2 recognized concurrent normalization methods32,33.
We find that miR-27a-3p is a potential predictive biomarker of ACR/EULAR remission in patients with early RA treated with ADA in combination with MTX. High levels of this miRNA are associated with remission after 12 months. Further, we confirmed miR-16-5p and identified miR-22-3p as biomarkers of disease activity and predictors of response to MTX treatment. The data suggest that pretreatment plasma-miRNA profiles hold potential in predicting therapy outcome, but these results need confirmation in independent cohorts.
ONLINE SUPPLEMENT
Supplementary material accompanies the online version of this article.
Acknowledgment
We thank technician Teresa Rozenfeld, Rigshospitalet and Glostrup Hospital, Copenhagen University Hospital, Denmark, for help with handling of the blood samples from the different departments, and Niels Steen Krogh for developing the electronic case report form for the clinical part of the study.
ADDENDUM — IN MEMORIAM
Co-author Niels H.H. Heegaard, MD, DMSc, DNatSc, died unexpectedly on September 26, 2017, at age 57. As director of the Department of Autoimmunology and Biomarkers, Statens Serum Institut, Copenhagen, Dr. Heegaard advanced research in autoimmunology and neurodegenerative disease. He had an extensive international research network and published more than 200 papers in scientific journals, focusing on biomarkers such as autoantibodies, microRNA, and microparticle proteins. He was a patient and unpretentious collaborator who always sought to highlight the work of other collaborators and co-workers. Dr. Heegaard was characterized by humor, kindness, and optimism. He is survived by his wife and 2 children.

Footnotes
Supported by grants from The Danish Rheumatism Association, R95-A1913/R99-A1923 (www.gigtforeningen.dk) and the Region of Southern Denmark’s PhD Fund, 12/7725 (www.regionsyddanmark.dk).
- Accepted for publication August 3, 2017.


