

Abstract
Objective. Rheumatoid arthritis (RA) is associated with muscle loss, osteoporosis, and fracture. We examined associations between skeletal muscle mass, strength, and quality and trabecular and cortical bone deficits in patients with RA and healthy controls.
Methods. Participants, ages 18–75 years, completed whole-body dual-energy x-ray absorptiometry and peripheral quantitative computed tomography (pQCT) of the tibia to quantify appendicular lean mass and fat mass indices (ALMI, FMI), muscle density at the lower leg, trabecular bone density, and cortical bone thickness. Age-, sex-, and race-specific Z scores were calculated based on distributions in controls. Associations between body composition and pQCT bone outcomes were assessed in patients with RA and controls. Linear regression analyses assessed differences in bone outcomes after considering differences in body mass index (BMI) and body composition.
Results. The sample consisted of 112 patients with RA (55 men) and 412 controls (194 men). Compared to controls, patients with RA had greater BMI Z score (p < 0.001), lower ALMI Z score after adjustment for FMI (p = 0.02), lower muscle strength Z score (p = 0.01), and lower muscle density Z score (p < 0.001). Among RA, ALMI Z scores were positively associated with trabecular density [β: 0.29 (0.062–0.52); p = 0.01] and cortical thickness [β: 0.33 (0.13–0.53; p = 0.002]. Associations were similar in controls. Bone outcomes were inferior in patients with RA after adjusting for BMI, but similar to controls when adjusting for body composition. Radiographic damage and higher adiponectin levels were independently associated with inferior bone outcomes.
Conclusion. Patients with RA exhibit deficits in cortical bone structure and trabecular density at the tibia and a preserved functional muscle-bone unit. A loss of mechanical loading may contribute to bone deficits.
Rheumatoid arthritis (RA) is associated with a greater risk of osteoporotic fractures1. Patients with RA have deficits in cortical and trabecular bone related to effects of systemic inflammation on endosteal and trabecular bone resorption2,3,4. In addition to the direct effects of inflammation on bone remodeling, muscle loss and adverse fat distribution may also contribute to adverse bone outcomes5,6,7,8,9,10. However, few studies have evaluated associations between body composition and bone outcomes in RA11,12,13, and only 1 previous study compared these associations to those observed in controls14.
Research in astronauts has suggested that bone adapts to the mechanical forces placed upon it15. The theory is termed the functional muscle-bone unit and explains why cortical geometry, bone density, and fracture load are superior among individuals with larger body size8,9,10. It has been observed that Olympic fencers have greater thickness of cortical bone and greater trabecular bone mineral density (BMD) in the leg that undergoes greater mechanical loading and has greater muscle mass16. Muscle mass and muscle forces are associated with superior bone structure and density, as well as lower fracture risk independent of measures of fat17,18,19,20. In contrast, greater visceral and intramuscular fat are associated with adverse bone structure and an increased risk of fracture in the general population5,6,7.
Cortical bone structure and trabecular volumetric bone mineral density (vBMD) are commonly evaluated using peripheral quantitative computed tomography (pQCT). Using pQCT to measure cortical dimensions can predict failure load in the human radius and femoral neck in cadaveric studies21 and predict incident fractures in cohort studies among older adults22,23. We have previously shown that the dimensions of cortical bone are associated with appendicular lean mass, muscle-specific force (muscle strength relative to muscle mass), and muscle density (a correlate of intramuscular fat accumulation) among healthy participants18. In a study of 50 patients with RA, pQCT measures of vBMD and cortical cross-sectional area were associated with muscle cross-sectional area in women with RA and female controls at the tibia14. However, in addition to low sample size and inclusion of women only, that study did not examine the effect of other important features of body composition and muscle quality such as total or visceral fat mass, muscle density, and muscle strength — factors that have been associated with muscle outcomes in healthy controls5,6,7,18. Previous studies have also been limited in their assessment of other disease characteristics such as physical activity, inflammatory cytokines, radiographic damage, prednisone use, and other phenotypic assessments.
This study aimed to address this knowledge gap by examining bone density and structure and the effect of muscle-bone interactions among patients with RA compared to healthy controls. We hypothesized that deficits in muscle mass, quality, and strength would be associated with cortical bone structure and trabecular vBMD in RA and that these associations would be similar to associations observed in healthy controls. We also assessed whether muscle deficits in patients with RA could explain a portion of their bone deficits compared to controls.
MATERIALS AND METHODS
Study sample
Patients with RA, ages 18–75 years, who met the 2010 American College of Rheumatology classification criteria were recruited from the University of Pennsylvania and Philadelphia VA Medical Center Rheumatology practices. Older patients were excluded to avoid confounding by advanced age. Patients were excluded if they had juvenile idiopathic arthritis (or another inflammatory arthritis), active cancer, a history of chronic diseases known to affect bone health (e.g., chronic kidney disease, liver disease, or malabsorption syndromes), or were pregnant. Muscle outcomes from the pilot study (n = 50) have been previously published24. Patients were excluded if their weight was > 300 pounds because of weight limitations of the equipment.
Adult controls, ages 21–78 years (194 men, 218 women), were enrolled as healthy reference participants for multiple bone studies at the University of Pennsylvania, USA, as previously described18. These participants were recruited from internal medicine clinics and the surrounding community using flyers and newspaper advertisements. Exclusion criteria included a history of chronic diseases or medications known to affect nutrition or bone health, such as a reported history of diabetes, malabsorption syndromes, chronic kidney disease, liver disease, thyroid disease, or malignancy. The bone and body composition results in the controls have been described18. All study participants (RA and controls) underwent scans in the same laboratory using identical equipment and methods. For each subject, all measurements were performed at the same study visit. The protocol was approved by the institutional review boards at the University of Pennsylvania (study no. 813724) and at the Corporal Michael J. Crescenz VA Medical Center (study no. 01427). Informed consent was obtained from all participants.
Assessment of anthropometrics and race
Weight and height were measured using a digital scale (Scaltronix) and stadiometer (Holtain Ltd.), respectively. BMI was calculated by dividing weight in kilograms by height in meters-squared. Participants self-identified race according to US National Institutes of Health categories.
Leg pQCT measures
Muscle, fat, and bone measures in the left lower leg were obtained by pQCT (Stratec XCT2000 12-detector unit, Orthometrix Inc.) with a voxel size of 0.4 mm, slice thickness of 2.3 mm, and scan speed of 25 mm/sec. A scout view was obtained to place the reference line at the proximal border of the distal endplate. The bone measurements were obtained at 3% and 38% of tibia length proximal to the reference line. At the 3% metaphyseal site, scans were analyzed for trabecular vBMD (mg/cm3) with contour mode 3 threshold 169 mg/cm3, and peel mode 4 threshold 650 mg/cm3 with an additional 10% concentric peel. At the 38% diaphyseal site, scans were analyzed for cortical vBMD (mg/cm3) using a threshold of 710 mg/cm3 to separate bone from soft tissue. For bone outcomes, we used analysis modes based on the study by Ashe, et al25. We considered cortical thickness as the primary cortical structure outcome of interest because the study by Ashe, et al demonstrated that cortical thickness was the cortical geometry measure with the greatest correlation with fracture load (R2 = 0.81; p < 0.001) and previous studies identified associations with risk of fracture26. Trabecular vBMD also correlates highly with fracture load (R2 = 0.72; p < 0.001)27,28.
Calf muscle and subcutaneous fat cross-sectional area (myocellular; mm2) were assessed 66% proximal to the distal physis (where muscle is prominent) using a threshold of 40 mg/cm3 for fat/lean separation and 711 mg/cm3 for lean/bone separation20,29. The pQCT measure of muscle density (mg/cm3) was used as a composite index of intra- and extra-myocellular fat content, as previously described20,29. Edge-detection and threshold techniques were used to separate tissues (skin, fat, muscle, marrow, and bone) based on attenuation characteristics that are directly related to tissue composition and density30,31. Images were filtered prior to being analyzed using contour mode 3 (−101 mg/cm3) to find skin, and peel mode 2 (40 mg/cm3) to separate adipose and muscle/bone, respectively. Images were filtered subsequently with a combination 3 × 3, and double 5 × 5 kernel image filter that clearly defined the edge of the muscle using contour mode 31 (40 mg/cm3). All bone was identified using a threshold of 150 mg/cm3 and mathematically removed to generate results for muscle density. In our laboratory, the coefficient of variation (CV) for short-term precision has ranged from 0.5% to 1.6% for pQCT outcomes.
Whole-body assessment
Subjects underwent whole-body dual-energy x-ray absorptiometry (DEXA) assessment using a Hologic densitometer (Delphi Systems, Hologic Inc.) to measure appendicular lean mass, as well as total and regional fat mass. The in vitro CV for measurement of lean mass was < 0.6% and the in vivo CV in adults was < 1%32. We used a previously validated method to quantify visceral adipose tissue (VAT) area33. The CV for VAT was 5.3%.
Dynamometric measurement of muscle strength
Muscle strength was assessed using Biodex Multi-Joint System 3 Pro Dynamometer (Biodex Medical Systems Inc.). High intrarater (0.97–0.99) and interrater (0.93–0.96) intraclass correlation coefficients have been reported34. We described strength as peak isokinetic torque (ft-lbs) in dorsiflexion (with the foot placed in 20° of plantarflexion) as previously described35.
Physical activity questionnaire
Physical activity was assessed using a detailed questionnaire developed for the Multi-Ethnic Study of Atherosclerosis36. We used a definition of intentional exercise (the sum of walking for exercise, sports/dancing, and conditioning metabolic equivalent of a task in hours/week) that has been previously defined18. The total number of reported sedentary hours per week was also recorded.
Disease measures and inflammatory markers
Clinical laboratory assays [erythrocyte sedimentation rate (ESR) and C-reactive protein (CRP)] were performed using standard methods. ESR was performed using the Westergren method. CRP levels were measured using a Fixed Point Immuno Rate Assay. Medication use was determined by self-report and confirmed in the medical record. Individuals taking corticosteroids were not excluded, allowing study of its potential effect on bone outcomes. Disease activity and disability were measured in a standard fashion using the 28-joint Disease Activity Score (DAS28) with CRP and the Health Assessment Questionnaire37. Cytokine assays were performed using a V-Plex Plus Proinflammatory Panel 1 Kit from Meso Scale Discovery. Liquid chromatography-tandem mass spectrometry was used to measure 25-hydroxy vitamin D [25(OH)D]. Adiponectin was measured by an ELISA kit from R&D Systems and leptin was measured with a kit from Meso Scale Discovery. Sclerostin was measured with an ELISA kit from ALPCO Diagnostics. Radiographic joint damage was measured in the hands and feet using the Sharp/van der Heijde (SvdH) scoring system. Seventeen subjects failed to return to complete radiographs at baseline.
Statistical analysis
Multiple imputation for pQCT outcomes and SvdH scores was performed to account for missing data. The pQCT values were imputed for 9 subjects who were not able to complete the scan owing to discomfort or excess calf size. The imputed analysis was considered more conservative, but results were similar with exclusion of patients with missing data. The pQCT outcomes and BMI values were converted to age-, sex-, and race-specific SD scores (Z score) based on distributions among the control population using LMS (Lambda, Mu, Sigma) curves as described previously24. The use of Z scores helps to account for the effects of age, sex, and race, as well as the non-linearity, heteroskedasticity, and skew noted in these outcomes24,38,39,40. A Z score below zero suggests a below-average value for that outcome. Appendicular lean mass index (ALMI) Z scores were assessed between patients with RA and controls before and after adjustment for fat mass index (FMI) Z scores. As previously shown, ALMI and FMI Z scores are correlated and greater adiposity can, therefore, obscure a relative loss of muscle mass38,41.
Differences in the primary bone structural outcomes of trabecular vBMD and cortical thickness Z scores between RA and controls were evaluated before and after adjustment for BMI Z scores (to determine whether bone outcomes are adapted to BMI) using multivariable linear regression. Differences in bone outcomes between RA and controls were subsequently assessed before and after adjustment for ALMI Z score, FMI Z score, and muscle density Z score in sequential models. Disease characteristics independently associated with pQCT bone outcomes were assessed in multivariable models. The study was designed to have about 80% power to detect small to moderate effect sizes between groups (d = 0.32) and to detect a coefficient of determination (R2) of 0.078 or greater among participants with RA. Analyses were performed with STATA 14.1 (StataCorp LP).
RESULTS
The characteristics of the study population are summarized in Table 1. Briefly, a total of 112 eligible participants with RA and 412 controls completed study procedures and were included in the analysis. Participants with RA were generally older, but were otherwise similar demographically. Participants with RA had a median disease duration of 7.6 years and low disease activity on average. Most patients previously received methotrexate, and about half previously received biologics. Forty-five percent of patients were currently receiving prednisone.
Characteristics of study participants.
Participants with RA had greater BMI than the reference population and were more likely to be obese. Patients with RA were observed to have greater FMI Z scores and greater VAT area (Table 2). Despite higher FMI Z scores, patients with RA had similar ALMI Z scores, and significantly lower ALMI Z scores when adjusting for the greater FMI Z score [β: −0.21 (−0.39 to −0.035); p = 0.02]. Patients with RA had significantly lower muscle CSA on pQCT (Table 2). Patients with RA had lower muscle density Z scores compared to controls. Muscle strength Z scores were also lower in RA and this difference persisted with adjustment for ALMI and FMI Z score [β: −0.21 (−0.41 to −0.011); p = 0.04], suggesting low muscle-specific force.
Unadjusted comparison of body composition, bone, and physical activity between patients with RA and controls.
Trabecular vBMD Z scores and cortical thickness Z scores were not lower than in controls in unadjusted analyses (Table 2). In regression models adjusting for the greater BMI Z score observed in RA, there were significant, albeit modest, deficits among participants with RA compared to controls for cortical thickness [β: −0.35 (−0.61 to −0.097); p = 0.03; Figure 1]. Patients with RA also tended to have lower trabecular vBMD Z scores with adjustment for BMI Z score [β: −0.26 (−0.52 to 0.004); p = 0.054].

Associations between appendicular lean mass index Z scores and (a) cortical thickness Z scores, and (b) trabecular vBMD Z scores among patients with RA and controls. vBMD: volumetric bone mineral density; RA: rheumatoid arthritis.
Assessment of the functional muscle-bone unit in RA and controls
Among RA and controls, greater ALMI Z score was strongly correlated with greater trabecular vBMD (R = 0.32; p < 0.001) and cortical thickness Z scores (R = 0.36; p < 0.001). Independent associations between ALMI Z score, FMI Z score, and muscle density Z score and bone outcomes were similar in patients with RA compared to controls in multivariable models (Figure 1, Table 3; no significant interaction; all p > 0.28). Adjustment for differences in ALMI, FMI, and muscle density Z scores attenuated bone deficits observed for patients with RA (Figure 2).
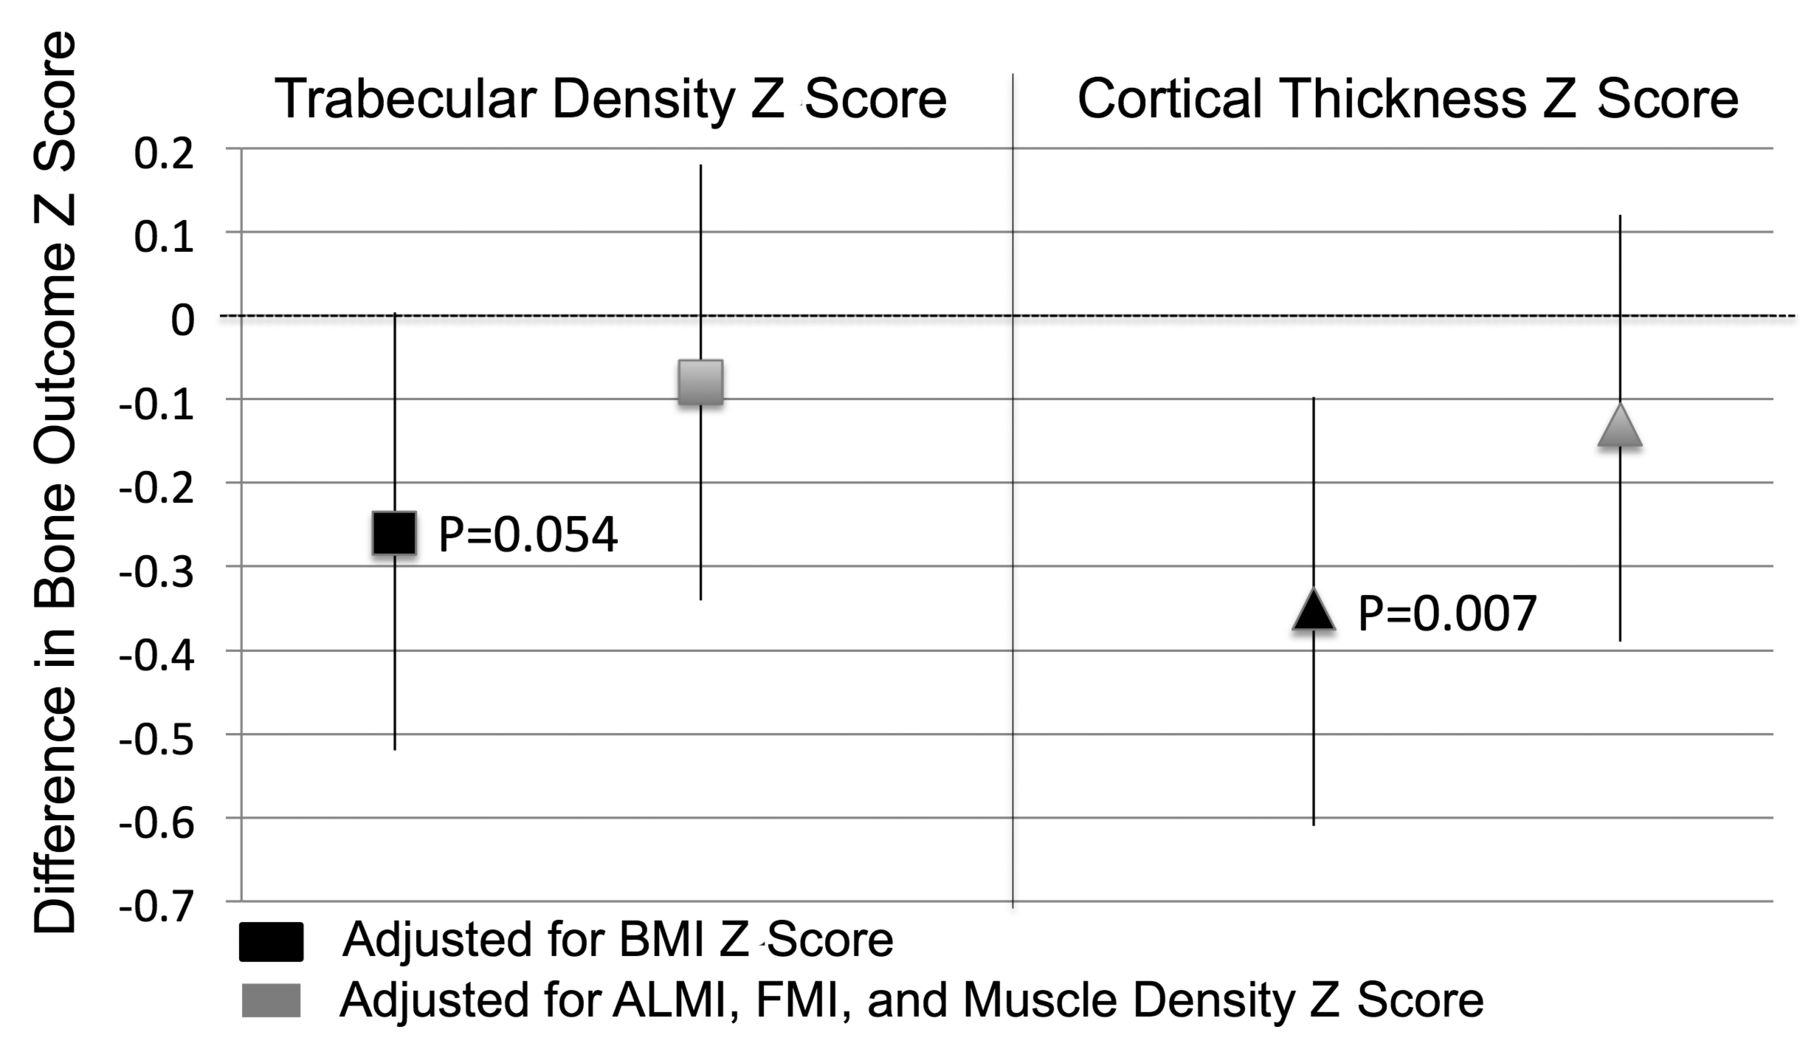
Differences in trabecular vBMD and cortical thickness between patients with RA and controls (presented as a regression coefficient and 95% CI) with adjustment for BMI and after subsequent adjustment for differences in body composition. vBMD: volumetric bone mineral density; RA: rheumatoid arthritis; BMI: body mass index; ALMI: appendicular lean mass index; FMI: fat mass index.
Multivariable linear regression models demonstrating independent relationships between body composition and bone Z scores among patients with RA and controls.
Among patients with RA, ALMI Z score was positively associated with trabecular vBMD Z scores and cortical thickness Z scores (Table 3). In addition, patients with RA who had a low lean mass for their age (ALMI Z score ≤ −1; 15.9th percentile) had substantially lower cortical thickness Z scores [β: −0.58 (−1.02 to −0.14); p = 0.01] and trabecular vBMD Z scores [β: −0.79 (−1.28 to −0.29); p = 0.002]. Greater ALMI Z scores were associated with greater periosteal circumference Z scores [β: 0.32 (0.091–0.56); p = 0.007], but were not associated with endosteal circumference Z scores [β: −0.041 (−0.20 to 0.28); p = 0.73]. Muscle density and muscle strength Z scores were not independently associated with bone outcomes independent of ALMI Z score among RA (Table 3). In similar models, greater muscle density Z score was associated with smaller endosteal circumference [β: −0.23 (−0.41 to 0.051); p = 0.01] but was not associated with periosteal circumference [β: −0.14 (−0.32 to 0.040); p = 0.12]. Associations were similar in sensitivity analyses excluding patients who ever used bisphosphonates.
Effect of RA disease characteristics
In regression models, factors associated with lower trabecular vBMD Z scores included disease duration, ever and current prednisone use, greater joint damage, greater adiponectin levels, and lower leptin levels. Factors associated with lower cortical thickness Z scores included greater joint damage, greater disease duration, and greater adiponectin levels.
In multivariable models including age, black race, ALMI, FMI, and muscle density Z scores, men had significantly lower trabecular vBMD Z scores compared to women [β: −0.42 (−0.81 to −0.034); p = 0.03]. In multivariable models, higher log-transformed (SvdH) scores were associated with lower trabecular vBMD Z score [β: −0.23 (−0.35 to −0.11); p < 0.001] independent of body composition. Higher adiponectin levels were also associated independently with lower trabecular vBMD [β: −0.039 (−0.075 to −0.003); p = 0.04] and cortical thickness [β: −0.033 (−0.066 to 0.000); p = 0.05].
Other disease characteristics were not significantly associated with bone outcomes independent of body composition including disease activity [DAS28(CRP)], inflammatory cytokines (interleukin 6, tumor necrosis factor-α), prednisone use (ever, current, or total yrs of use), other medication use, physical activity, smoking, 25(OH)D levels, sclerostin levels, and RA disease duration in these models (all p > 0.05; Table 4).
Age-, sex-, and black race–adjusted associations between individual RA factors and bone outcomes among patients with RA. Each variable represents a separate multivariable regression model.
DISCUSSION
Our study demonstrated that patients with RA have deficits in muscle mass, quality, and strength as well as modest deficits in trabecular vBMD and cortical structure as measured by pQCT compared to what would be expected for their BMI. In our study, the associations between body composition and bone outcomes were similar in patients with RA and controls, suggesting that the functional muscle-bone unit is preserved in this group. Overall, these observations support the hypothesis that deficits in cortical bone structure and trabecular vBMD in this group may be explained in part by a loss of skeletal muscle mass, muscle quality, and reduced mechanical loading to bone.
The bone deficits observed among participants with RA in our study using pQCT were modest, on average, with a “small” effect size between groups (0.26 and 0.35 for trabecular vBMD and cortical thickness, respectively). In comparison, a study of 50 women with RA from Switzerland reported moderate effect sizes between RA and controls at the tibia (0.65 and 0.52 for trabecular vBMD and cortical thickness, respectively)14. More modest deficits observed in our study might suggest an effect of longterm trends in disease management. For example, this cohort had a high frequency of biologic use and low disease activity. Alternatively, these differences may reflect differences in disease populations, selection of participants, or methods used to quantify deficits.
There is interest in the effect of muscle loss on bone loss among patients with RA12,13. We are aware of only 1 previous study characterizing associations between muscle area and cortical dimensions in women with RA using pQCT14. Our study is the largest study to evaluate the functional muscle-bone unit in RA compared to a large sample of well-characterized controls and the first to include men. Further, our study incorporated independent assessment of the effect of total adiposity, intramuscular fat accumulation and resulting low muscle density, as well as muscle strength. These factors have been described as important mediators of adverse bone outcomes in the general population. In our study, appendicular lean mass was the most important predictor of cortical bone structure and trabecular vBMD in the tibia among patients with RA. Greater lean mass was associated with larger periosteal circumference, supporting the hypothesis that greater lean mass promotes larger bone size through periosteal apposition42,43.
Greater muscle mass and muscle forces are likely to play an important role in promoting superior cortical bone structure and trabecular vBMD. Though the primary mediators of the muscle-bone interaction remain poorly understood, several potential mechanisms have been described. Mechanical loading to bone has been shown to inhibit osteoclast differentiation and activity to promote bone formation44. Mechanical stimulation of bone may inhibit osteoclasts through alterations in canalicular fluid flow within the bone and resulting stimulation of mechanoreceptors on osteocytes45. This stimulation of osteocytes may downregulate important mediators, such as sclerostin, to promote new bone formation.
Our study observed strong and comparable associations between skeletal muscle mass and bone outcomes in both patients with RA and controls. Fat mass was not associated with bone outcomes in either patients with RA or controls, confirming previous literature suggesting that the beneficial effect of greater weight on bone structure is mediated through greater lean mass and not greater adiposity8,9,10,18. Thus, weight gain in the fat compartment would be ill-advised in attempts to promote superior bone in patients with RA. While measures of disease activity and systemic inflammation were not associated with bone outcomes in our study, the study demonstrated associations between radiographic joint damage and trabecular vBMD independent of muscle mass. This observation confirms that the chronic systemic inflammatory disease independently contributes to bone loss4.
We previously demonstrated associations between adiponectin and evidence of cachexia in RA39. The novel associations between adiponectin and bone outcomes observed in this RA cohort were independent of body composition. Because adiponectin has been described as a marker of cachexia and frailty in RA and other populations, high adiponectin levels may be associated with bone outcomes by identifying those with weight loss and frailty. Indeed, associations between adiponectin and bone outcomes were partially attenuated with adjustment for skeletal muscle mass in our study. Studies in other populations have demonstrated associations between adiponectin and bone and fracture outcomes46,47.
Our study observed deficits in muscle mass, muscle density, and muscle-specific force among individuals with RA compared to a healthy control population and confirms previous studies demonstrating altered body composition among patients with RA. To our knowledge, it is the largest study to describe low muscle density and low muscle-specific force among patients with RA compared to a control population, suggesting poor muscle quality in addition to deficits in muscle mass24,48,49.
Limitations of our study include the cross-sectional design, which does not allow for a clear description of the temporal changes because of the disease. However, the observation of similar cross-sectional associations in RA and controls is the critical observation here that argues against reverse causality. Longitudinal studies may help clarify these questions and are a logical next step. The relatively modest bone deficits observed in this cohort may not be generalizable to cohorts or individuals severely affected by the disease. However, the modest deficits observed here are informative and may reflect meaningful improvements in the management of the disease in recent years. Missing pQCT data as a result of the patient’s inability to perform the test could have resulted in selection bias. However, missing data were uncommon and use of multiple imputation limited this potential bias. Strengths of our study include the comparison of patients with RA to a large control population across a wide age range using robust methods to quantify deficits in muscle and bone.
Our study shows that patients with RA have poorly adapted cortical bone structure and trabecular vBMD for their BMI. Deficits in muscle mass, muscle density, and muscle-specific force are observed in RA and may contribute to bone deficits through a loss of mechanical loading. Altered body composition and frailty are underrecognized risk factors for maladapted bone in RA and may affect the risk of fracture.
Footnotes
Dr. Baker is supported by a Veterans Affairs Clinical Science Research and Development Career Development Award (IK2 CX000955). This work was also supported by the University of Pennsylvania Clinical and Translational Research Center (UL1 RR024134). Dr. Denburg is supported by grant K23DK093556. Dr. Ibrahim is supported by grant K24AR055259 from the US National Institute of Arthritis and Musculoskeletal and Skin Diseases. The contents of this work do not represent the views of the US Department of Veterans Affairs or the US government.
- Accepted for publication June 23, 2017.


