

Abstract
Objective. Early and accurate risk prediction of walking limitations after total knee arthroplasty (TKA) is important for clinical and economic reasons. However, to our knowledge, no studies have systematically integrated multiple predictors into a single, clinically practical model. Our study aimed to develop a prediction model to estimate the risk of post-TKA walking limitations.
Methods. We performed a prospective cohort study of 1096 patients who underwent elective, primary TKA between July 2013 and September 2014. Candidate predictors included patient demographics, surgical factors, and pre- and early (1-mo) post-TKA functional measures. The outcome of interest was self-reported walking limitations at 6 months of post-TKA. We used multivariable proportional odds regression with bootstrap internal validation to develop the model.
Results. In all, 12% of patients reported walking limitations (maximum walk time ≤ 15 min) at 6 months postsurgery. The main predictors of increasing levels of walking limitations were preoperative walking limitations (overall p < 0.001), higher levels of body mass index [interquartile range (IQR)-OR 1.3, 95% CI 1.2–1.5], lower values of 1-month post-TKA gait speed (IQR-OR 1.9, 95% CI 1.3–2.6), the presence of contralateral knee pain (OR 1.9, 95% CI 1.2–3.0), and the use of a quadstick preoperatively (OR 3.5, 95% CI 1.7–7.3). The prediction model had an optimism-corrected concordance index of 0.71.
Conclusion. A small but sizable proportion of patients with TKA had persistent mobility limitations. Our prediction model may help to risk-stratify patients, and external validation is required before the model can be used in clinical practice.
In patients with advanced stages of symptomatic knee osteoarthritis, although a total knee arthroplasty (TKA) can effectively relieve knee pain and restore function, about 24% to 30% of the patients who were assessed at around 2 years1,2 postsurgery had moderate to severe walking limitations. Accordingly, early and accurate identification of at-risk patients would better direct resources toward preventive care for them. While previous cohort studies have improved our understanding of the risk factors for post-TKA functional limitations1,2,3,4,5,6,7,8,9, in reviewing the literature we saw that no studies, to our knowledge, have systematically integrated multiple predictors into a single, clinically practical model. Thus, to facilitate clinical and shared decision making10, our study aimed to develop the first multivariable prediction model to estimate the risk of post-TKA walking limitations.
MATERIALS AND METHODS
Settings and participants
We conducted a prospective cohort study and identified 1352 patients aged 50 years or older who underwent a primary, unilateral TKA and postoperative outpatient physiotherapy at Singapore General Hospital, Singapore, from July 2013 to September 2014. We excluded patients who had a history of rheumatoid arthritis (n = 18), patients with stroke or Parkinson disease (n = 26), and patients who had revision TKA (n = 10). For patients with consecutive admissions for TKA (n = 57), only data from the first admission were analyzed to meet the statistical assumption of independence. Of the remaining 1241 patients who were evaluated preoperatively and were scheduled for 1-month and 6-month postoperative assessments, we selected a cohort of 1096 patients who had 6-month postoperative outcome data. All data were collected by physiotherapists and data technicians and entered into an electronic registry database per routine practice policies of our institution. The institutional review board approved the study.
Candidate predictor variables
We considered candidate predictors a priori based on subject matter expertise and literature support for their association with self-report or performance-based physical function11,12. To improve the practicality of the prediction model, we considered variables that were less equipment-dependent and were routinely and easily measured in the clinical setting. For example, although patients with a recent TKA have joint effusion, limited knee range of motion, quadriceps weakness, and impaired balance control, we did not consider these variables because their quantification methods are often equipment-dependent and may vary across clinical settings. Instead, we chose to measure gait speed (described below), a simple but multidimensional measure that is related to the aforementioned knee impairments13,14. Finally, several variables were closely related — for example, the type of walking aids used preoperatively, at hospital discharge, and postoperatively — and we included 1 variable from each group of related variables in the model.
Altogether, we identified 11 predictors that included demographic and operative characteristics1,2,3,4,6,8,9,15, and measures of preoperative and early (1-mo) postoperative functional status2,3,4,5,7 (Table 1). Specifically, the presence of contralateral knee pain was measured by the “Patient Category” item (response choice B) from the Knee Society Clinical Rating System16. The presence of hypertension (HTN) was determined by patient self-report and it was chosen given its association with gait decline in older adults15. For falls history, the number of falls in the 1 year prior to TKA was collected through retrospective recall and we defined a fall as “an event which results in a person coming to rest inadvertently on the ground or other lower level and other than as a consequence of the following: sustaining a violent blow, loss of consciousness, sudden onset of paralysis as in a stroke, or an epileptic seizure”17. We classified patients into 1 of 3 groups: no fall, single fall (1 fall), and recurrent falls (2 or more falls). For the type of walking aids used preoperatively, we coded the responses into 4 categories: (1) none, (2) walking stick or umbrella, (3) quadstick, and (4) walking frame or 2-canes or crutches. For type of surgeons (specialist or general orthopedic surgeon), our patients were cared for by 42 orthopedic surgeons, 7 of whom were adult reconstruction specialists.
Demographic and clinical characteristics of patients with and without walking limitations (defined as a maximum walk time ≤ 15 min). Values appearing as “A, B, C” represent (A) the lower quartile, (B) the median, and (C) the upper quartile for continuous variables. Values appearing as D ± E are mean ± 1 SD.
For the fast gait test, which was done 4 weeks post-TKA, patients stood directly behind the start line and were clocked from the time the first foot crossed the start line until the lead foot crossed the 10-m finish line. Patients were instructed to “walk as quickly as you can, but safely” and to finish at least 2 m past the finish line to eliminate the deceleration effects from stopping the walk. Each patient performed a familiarization trial (at a comfortable pace) before the actual trial. Notably, although we measured habitual and fast gait speeds in our study, we selected fast gait speed because it has been shown to correlate closely with physical frailty18, functional decline19, and onset of disability20 in older adults. Immediately after the fast gait test, participants were asked to rate their (ipsilateral) knee pain intensity using an 11-point numeric pain scale, with 0 indicating “no pain” and 10 indicating “worst pain ever experienced”.
Outcome measure
The outcome of interest was the postoperative walking limitations. Notably, we chose an intermediate (6-mo) postoperative timepoint because it is a timepoint at which self-report physical function was reportedly nearing its peak21. In our study, patients were asked, both pre- and 6 months post-TKA, to estimate the time they were able to walk (without a rest) before they had severe difficulty with the operated knee. This variable had 4 categories: (1) > 30 min, (2) 16 to 30 min, (3) 5 to 15 min, and (4) around the house only.
Statistical analysis
Continuous variables were presented as means with SD and medians with interquartile range (IQR) while categorical variables were presented as percentages with frequencies. We used a transition plot to show the crossover between the 4 ordinal categories of walking limitations from the preoperative to 6 months postoperative timepoints.
To develop the prediction model, we used a proportional odds regression model which examined the multivariable association of the predictors listed in Table 1 with postoperative walking limitations. To optimize statistical power, we analyzed our outcome as a 4-level ordinal variable and quantified the model’s accuracy in predicting the risk of walking limitations (defined as a maximum walk time ≤ 15 min). Of interest, proportional odds regression (1) better preserves the information content of ordinal outcomes compared with binary logistic regression, (2) estimates common OR over all possible cutpoints of the outcome variable, and (3) allows exceedance probabilities to be estimated11. We used a full-model approach and included all predictors in the model11; however, variables were excluded when the sign of their regression coefficients was not considered biologically plausible (the “sign-OK” method22). We evaluated the relative explanatory value of the predictors by their partial Wald chi-square statistic minus the predictors’ degrees of freedom11. To avoid assuming linearity, we modeled all continuous predictors as restricted cubic splines11,23, unless there was insufficient evidence against the linearity assumption (p > 0.20). To reduce selection bias from missing predictor values, we performed multiple imputation using the aregImpute function from the rms package11,24,25, and the imputation models included the outcome, predictors, and auxiliary variables (for example, gait data from other postoperative timepoints). To account for overfitting of the prediction model, we shrank the OR in the final model using penalized maximum likelihood methods26. To account for the clustering of patients within surgeons, which may bias the CI toward being too narrow, we calculated Huber-White robust estimates of standard errors and CI27.
We assessed model performance in 2 ways. First, we measured model discrimination by the generalized concordance index (C-index), where a value of 1.0 represents perfect discrimination and 0.5 represents no discrimination (“coin flip”)11. Because a prediction model is expected to perform better (optimistically) in the development sample than in new (but similar) samples, bootstrap internal validation with cluster sampling28 was performed to shrink the C-index for “optimism”11. Second, we assessed model calibration using a locally weighted scatterplot smoothing calibration plot. We tested and confirmed the validity of the proportional odds assumption graphically and we used the rms24, ggplot229, and Gmisc30 R packages for all analyses and graphing (www.r-project.org).
RESULTS
Table 1 shows the demographics and pre- and postoperative characteristics of the patients. Women accounted for three-quarters of the sample [mean age 67 yrs (SD 7.6)]; mean body mass index (BMI) for all patients was 27.5 kg/m2 (SD 4.5). Among the predictor variables, Week 4 fast gait speed and knee pain (during the gait test) had the highest proportion of missing data (29.7%) while other predictors had very few (< 5%) or no missing values (Table 1). Preoperatively, half of the patients (52%, 95% CI 49–55) reported an inability to walk for more than 15 min (outcome levels 3 or 4); at 6 months postsurgery, around 1 of every 10 patients (12%, 95% CI 10–14%; Figure 1). Details on the number of patients in each outcome category are given in Appendix 1.

Crossover between 4 ordinal levels of self-report walking limitations in 1096 patients with TKA who were assessed preoperatively (left panel) and 6 months postoperatively (right panel). Box height and arrow size are proportional to the number of patients. TKA: total knee arthroplasty.
Table 2 shows the results of the proportional odds model while Figure 2 shows the partial effects of the top 5 predictors on the probability of walking ≤ 15 min at 6 months post-TKA. Based on the Wald chi-square minus df statistics, preoperative walking limitations was the strongest predictor. Also, patients with higher BMI (IQR-OR 1.3, 95% CI 1.2–1.5), slower Week 4 gait speed (IQR-OR 1.9, 95% CI 1.3–2.6), and contralateral knee pain (OR 1.9, 95% CI 1.2–3.0), and patients who walked with a quadstick preoperatively (quadstick vs none, OR 3.5, 95% CI 1.7–7.3) were more likely to report greater postoperative walking limitations. Figure 3 is a nomogram that allows probabilities of postoperative walking limitations of individual patients to be estimated by drawing a straight line from the “sum of total points” axis to the “predicted risk” axes. The total number of points is obtained by summing the points of individual predictors. To facilitate results interpretation, we created a Web-based calculator (sgh-physio.shinyapps.io/walkPredict).

Partial effect of each of the top 5 predictors on the probability of walking ≤ 15 mins at 6 months post-TKA after adjusting for other predictors. Predictors were ranked using the Wald chi-square in the proportional odds model. The p value is calculated using the Wald test. Shaded regions and error bars represent 95% CI for the regression estimates. For fast gait speed and BMI, the observed values are indicated by the short vertical lines above the X-axes. To further describe the spread of these continuous predictors, the tick labels indicate the 10th, 25th, 50th, 75th, and 90th percentile values. TKA: total knee arthroplasty; BMI: body mass index.
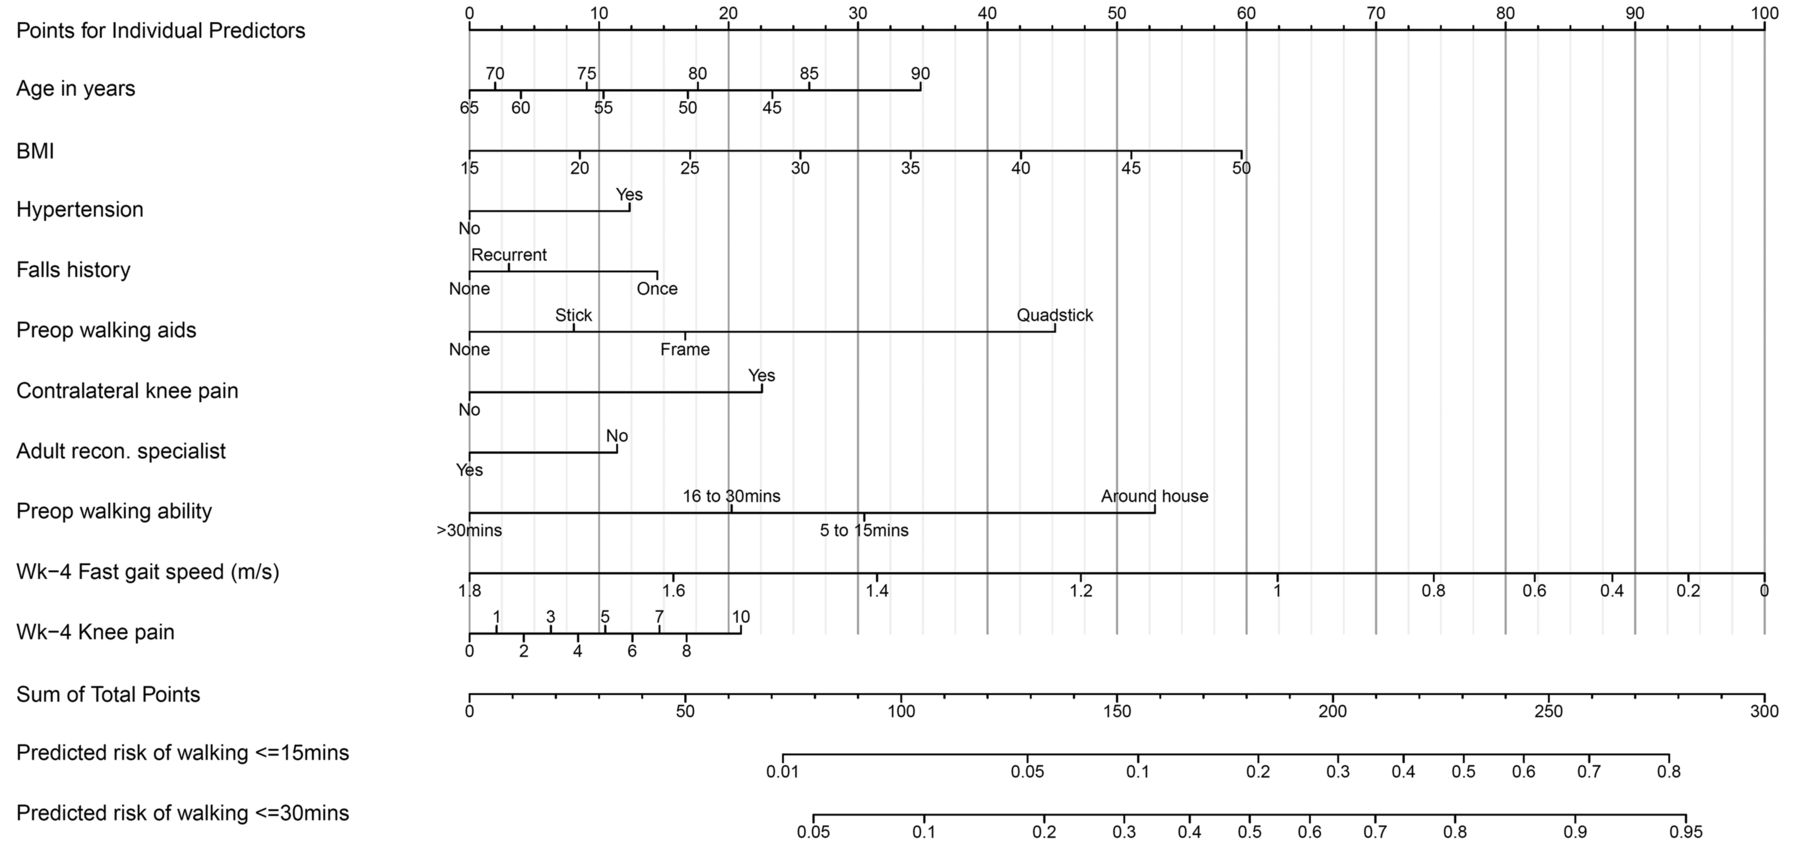
Nomogram for predicting risk of walking limitations 6 months post TKA. Instructions: Draw a vertical line from each predictor to the top line, labeled “Points for Individual Predictors”, to calculate points associated with each predictor. The sum of these points is then marked on the line labeled “Sum of Total Points”. Drop vertical lines from there to determine the predicted exceedance probabilities of walking ≤ 15 mins or ≤ 30 mins. TKA: total knee arthroplasty; BMI: body mass index; Wk: week.
Multivariable association between predictors and walking limitations at 6 months postsurgery. OR (95% CI) from proportional odds regression estimate the odds of greater walking limitations at the 75th vs the 25th percentile for continuous predictors. For example, other variables being equal, a patient with a fast gait speed of 1.06 m/s (75th percentile) had, on average, 0.54 times (95% CI 0.38–0.77 times) the odds of reporting greater walking limitations at 6 months post-TKA than did a patient who walked at 0.68 m/s (25th percentile).
The C-index of the prediction model was 0.72, and after correction for optimism it was 0.71, indicating moderately good discrimination with minimal model optimism (< 2%). Figure 4 shows the calibration plot, with the light dotted and solid lines representing the calibration accuracy of the original and (optimism-corrected) bootstrap models, respectively. The 2 lines were relatively close to the dashed line of unity (which represents perfect agreement between the observed and predicted values), indicating moderately good calibration.
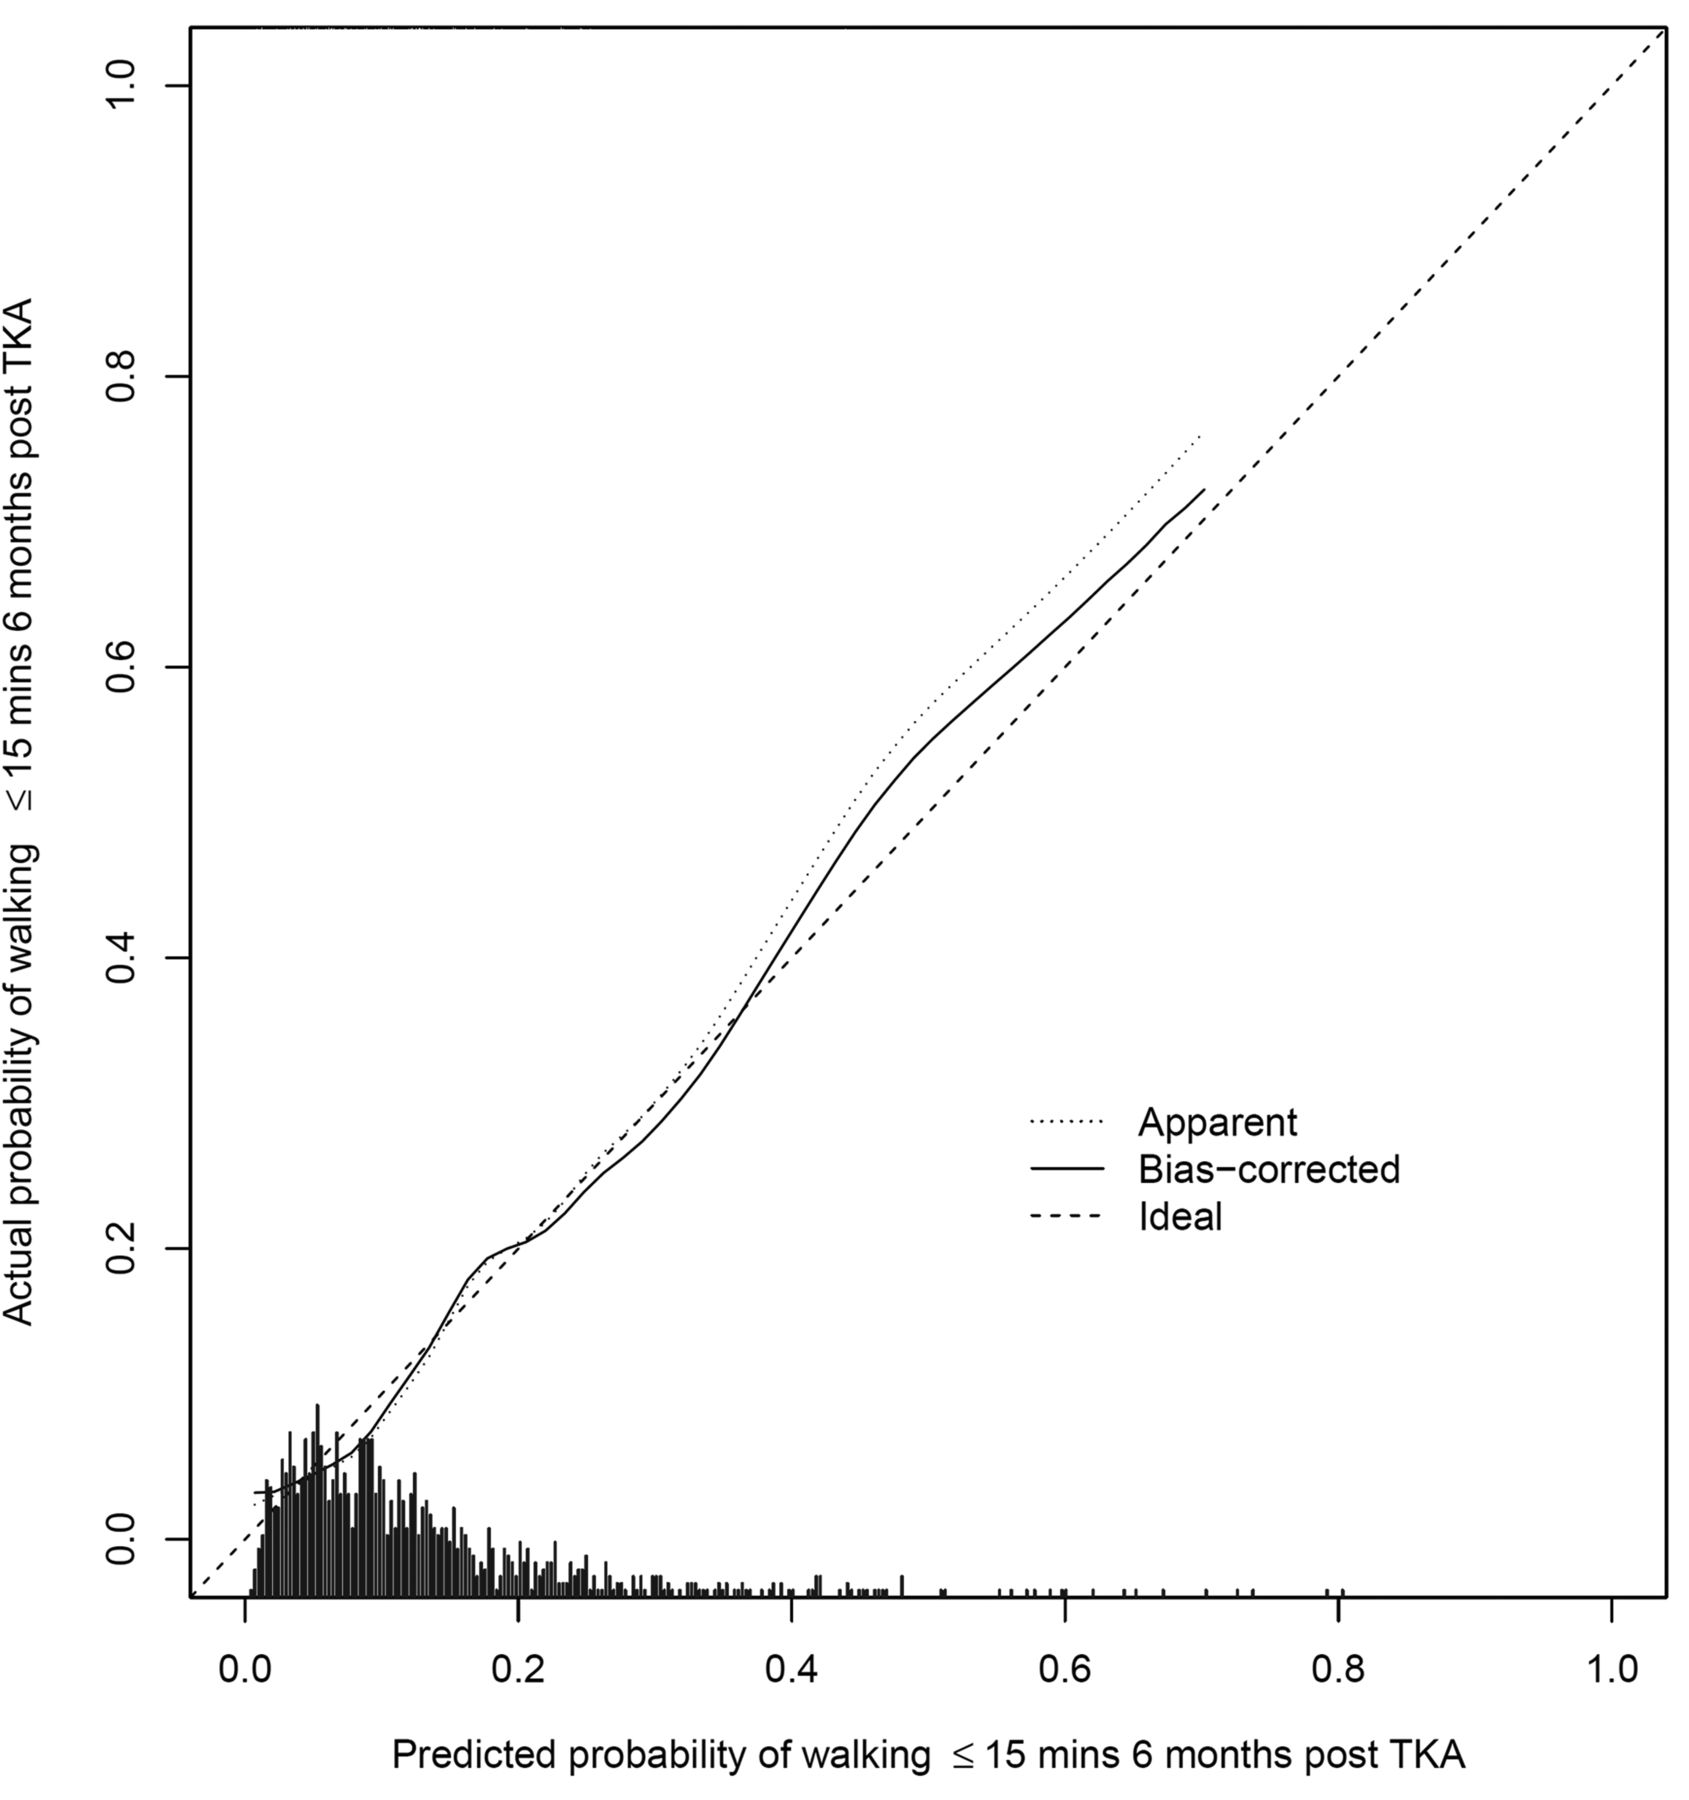
Calibration plot that illustrates the accuracy of the original prediction model (“Apparent”) and the bootstrap model (“Bias-corrected”) in predicting the probability of walking ≤ 15 mins at 6 months post-TKA. Locally weighted scatterplot smoothing is used to model the relationship between observed and predicted probabilities. Spike histogram above the X-axis shows the distribution of the predicted probabilities. TKA: total knee arthroplasty.
DISCUSSION
In a sample of 1096 patients with TKA, 12% had walking limitations (maximum walk time ≤ 15 min) at 6 months postsurgery. Although this estimate is lower than the 52% of the same cohort assessed preoperatively (Figure 1), the percentage of patients with persistent mobility limitations is worrisome, and early identification of these patients is thus of great clinical relevance.
In our study, we sought to develop a prediction model for post-TKA walking limitations and found that the strongest predictor was the preoperative level of walking limitations (Figure 2). This finding is unsurprising and consistent with data from several studies2,3,4,5,7, demonstrating that post-TKA functional limitations were strongly influenced by the same functional measure obtained preoperatively. Nonetheless, preoperative levels of walking limitations alone cannot fully predict the risk of postoperative walking limitations (Figure 1); hence, to further improve the predictive accuracy of the model, we included 2 complementary measures of functional ability — the preoperative use of a walking aid (Wald chi-square = 14.9, p < 0.01) and 1-month postoperative fast gait speed (Wald chi-square = 12.5, p < 0.01), which added independent prognostic information (Figure 2 and Table 2).
Of interest, we found that the presence of contralateral knee pain was an independent predictor. This finding agrees with data from the Osteoarthritis Initiative study showing a statistically significant association between contralateral knee pain severity and Western Ontario and McMaster Universities Osteoarthritis Index (WOMAC) scores of the operated knee obtained at 6 months post-TKA1,6. Further, our finding is generally consistent with data from Hawker, et al5 demonstrating a negative association between the number of painful hips or knees and WOMAC functional scores obtained at least 6 months after surgery. Given that bilateral knee pain is prevalent in our sample (57%; Table 1), our results support previous findings of a high prevalence of bilateral symptomatic knee OA in Asian Chinese31 patients. More importantly, the results suggest that to optimize functional outcomes, the contralateral knee should not be overlooked in the rehabilitation process.
It is also noteworthy that a high BMI was an influential predictor of greater post-TKA limitations in our model (Table 2) and these findings agree with those of several2,3,4,8,9, but not all5,7, previous studies. The reasons for these discrepant findings are unclear; however, a major strength of our study is that it encompassed a large sample of patients with a wide range of BMI values (16.6 to 46.6 kg/m2). Further, we modeled BMI flexibly and avoided arbitrary BMI categorization32. Thus, we believe that our results are robust, and if confirmed, they suggest that pre- and postoperative weight management may be indicated for at-risk patients with higher BMI.
Our study has limitations. First, our single-institution study raises uncertainty about the generalizability of our prediction model. However, our sample is nationally representative because our institution performed more than half (60%) of all knee arthroplasty in Singapore33. Nevertheless, we acknowledge the need to externally validate and update our model in new patient cohorts from our and (preferably) other institutions. Second, our study consisted of a preponderance of Asian women; hence, we cannot necessarily extend these results to non-Asian samples. Third, although many of our results support prior work, we acknowledge that more detailed predictors should be used. For example, future studies should consider contralateral knee pain on an ordinal rather than binary scale. Similarly, although we did not find the presence of self-report HTN to be an independent predictor (Table 2), we cannot conclude that more informative measures of HTN — such as systolic blood pressure measurements15 and the number of antihypertensive medications34 — are not uniquely related to walking limitations. Fourth, our analysis focused on self-report walking duration and did not identify the full breadth of the walking limitation construct; hence, future studies should consider complementary, objective measures such as walking speed, walking endurance, and oxygen consumption during walking. Finally, for practical reasons, our predictors consisted primarily of self-report measures, and to the extent that performance-based measures such as muscle strength and postural balance may provide incremental predictive value, we acknowledge that the performance of our prediction model was adequate but certainly not optimal.
A small but sizeable proportion (12%) of patients with TKA had walking limitations (maximum walk time ≤ 15 min) at 6 months postsurgery. Our prediction model can potentially complement clinical and shared decision making by providing personalized risk estimates of future walking ability. External validation, however, is required before the model can be used in clinical practice.
Acknowledgment
We acknowledge the support from Bee-Yee Tan, the head of the Department of Physiotherapy, Singapore General Hospital. We also thank William Yeo from the Orthopaedic Diagnostic Centre, Singapore General Hospital, for his assistance. Finally, we thank Jasper Quek, Felicia Seet, Jennifer Suet-Ching Liaw, Jo Ann Sebarrotin, and Nai-Hong Chan for their assistance.
APPENDIX 1.
Number of patients in each outcome category at preoperative and postoperative levels.
Footnotes
Funded by the Singapore General Hospital Centre Grant (Bioengineering Core) from the National Medical Research Council, Singapore (ref: NMRC/CG/016/2013).
- Accepted for publication September 25, 2015.


