

Abstract
Objective. To evaluate the association of a sandwich assay for cartilage collagenase-mediated degradation, the C2C human urine sandwich assay (IB-C2C-HUSA), with early and late knee cartilage pathology and with progression of cartilage damage.
Methods. A population-based cohort with knee pain, age 40–79 years, was evaluated at baseline (n = 253) and after mean 3.3 years (n = 161). We evaluated the IB-C2C-HUSA and a related competitive inhibition assay (C2C). The C2C assay was applied to serum (sC2C) and urine (uC2C). Based on knee radiographs and magnetic resonance imaging (MRI), 3 subgroups [no cartilage pathology, preradiographic cartilage pathology, and radiographic osteoarthritis (ROA)] were evaluated cross-sectionally for association with biomarker levels. Longitudinally, we evaluated whether baseline assays predict subsequent progression of cartilage degeneration, defined by MRI cartilage loss.
Results. Cross-sectionally, statistically significant differences were seen in the 3 subgroups for IB-C2C-HUSA (p < 0.001), with the highest levels seen in ROA, and for sC2C (p = 0.023), while no differences were seen for uC2C (p = 0.501). Baseline IB-C2C-HUSA levels were higher in progressors vs nonprogressors (p = 0.003). In logistic regression analysis, only baseline IB-C2C-HUSA was associated with an increased risk of progression of cartilage damage (OR 1.78, 95% CI 1.03–3.09).
Conclusion. The IB-C2C-HUSA degradation assay detects the generation of a pathology-related cartilage collagen peptide(s) that increase(s) with onset of degeneration of knee articular cartilage. The baseline values are associated with progression of cartilage degeneration over 3 subsequent years. This assay may have value in clinical OA trials. Further, it points to collagenase activity as a therapeutic target for controlling degeneration of articular cartilage.
Cartilage matrix has an extensive fibrillar type II collagen network that confers tensile strength to hyaline cartilage. In early degeneration of articular cartilages and in osteoarthritis (OA), the extracellular matrix is degraded, involving often irreversible cleavage of the triple helical domains of the fibrillar type II collagen. This involves collagenases, such as matrix metalloprotease 13 and cathepsin K1,2,3,4,5,6,7,8,9.
A monoclonal antibody (C2C)–based competitive inhibition immunoassay specific for the cleavage of type II collagen by collagenases8 had limited value in detecting early onset of OA and its progression10,11. Analyses of type II collagen fragments revealed that a 45-mer peptide was increased in the urine of patients with OA compared to healthy donors12: this contained the C2C neoepitope. A sandwich assay was created (IB-C2C-HUSA; IBEX Pharmaceuticals, where HUSA represents human urine sandwich assay) to quantitate this 45-mer fragment in human urine in health and pathology. We describe this new urine assay and its application and compare it to the original C2C assay in a population-based longitudinal cohort study.
MATERIALS AND METHODS
The population was recruited between 2002 and 2005 and described previously11,13. Briefly, subjects 40–79 years old with knee pain were recruited as a random population sample in Vancouver, British Columbia, Canada, using stratified sampling to achieve equal representation within age decades and between men and women. Subjects were excluded at baseline if they had inflammatory arthritis, fibromyalgia, knee arthroplasty, knee injury or surgery within the previous 6 months, referred pain, or magnetic resonance imaging (MRI) contraindications. Exclusion criteria at followup were knee arthroplasty, inflammatory arthritis, MRI contraindications, comorbidity, or inability to attend the study center14.
Subjects provided written informed consent. The study was conducted in accordance with the Declaration of Helsinki and was approved by the Clinical Research Ethics Board, University of British Columbia.
Clinical and radiological evaluations
Subjects were evaluated at baseline11,13 and followup14 after a mean of 3.3 years for symptoms, OA risk factors, and with Western Ontario and McMaster Universities (WOMAC) OA Index, visual analog scale 3.115. The more symptomatic knee was the study knee.
Baseline and followup knee radiographs were obtained within a month of clinical assessment, using a fixed-flexion technique with the SynaFlexer positioning frame16 and supine skyline view11,13,14. Radiographs were scored blinded to clinical and MRI information by 2 independent readers using the Kellgren-Lawrence (KL) 0–4 grading17, which evaluates the tibiofemoral compartments. The interrater reliability was excellent, with an intraclass correlation coefficient of 0.7911. Differences in readings were adjudicated by consensus readings of the 2 readers.
Baseline and followup MRI were obtained on a GE Healthcare 1.5T magnet within a month of the clinical assessments. Four MRI sequences were obtained, as described11,13,14: (1) fat-suppressed T1-weighted 3-D spoiled gradient echo in the sagittal plane with axial and coronal reformat images; (2) fat-suppressed T2-weighted fast spin echo (FSE) in coronal plane; (3) T1-weighted FSE in oblique sagittal plane; and (4) T2-weighted FSE in oblique sagittal plane.
Six joint regions were assessed: medial and lateral tibia, medial and lateral femur, patella, and trochlear groove. Cartilage was graded on a 0–4 semiquantitative scale, based on the following definitions, described by Disler, et al18: 0 = normal; 1 = abnormal signal without cartilage contour defect; 2 = cartilage thickness defect of < 50%; 3 = cartilage thickness defect of 50%–99%; 4 = 100% cartilage thickness defect with subjacent bone signal abnormality11,13,14. Baseline and followup images were read side by side, blinded to time sequence, by a single reader (AG) who was blinded to radiographic and clinical information. Intrarater reliability of cartilage readings ranged from 0.84 to 1.0 for different regions11.
Based on radiographic and MR cartilage (MRC) scores (using the worst cartilage lesion of any of the 6 regions), subjects were classified into 3 subgroups, defined as follows: (1) no cartilage pathology (NCP): MRC = 0 and KL < 2; (2) preradiographic cartilage pathology (PRCP): MRC ≥ 1 and KL < 2; (3) radiographic OA (ROA): MRC ≥ 1 and KL ≥ 211,13,14. Progression of cartilage damage was defined as worsening of cartilage score of ≥ 2 grades in at least 1 region or worsening of cartilage score of ≥ 1 grade in at least 2 regions from baseline to followup, as described14.
Biomarker evaluations
Serum (s) and urine (u) samples were collected at baseline study visit with details of specimen collection and storage described11. Samples were collected between 10 AM and 3 PM. Sera were assayed with the serum C2C (sC2C) assay, expressed as pg/ml. Urine samples were assayed using both C2C assays: uC2C (sC2C assay applied to urine) and IB-C2C-HUSA. All assays were performed in duplicate. Urine creatinine was assayed as described11. Assay results were expressed as ng/mmole creatinine. Picomole concentrations of type II collagen fragments were determined from ng values using molecular weights of assay standards. This permitted comparison of pmole concentrations of molecular fragments in urine that bears the C2C neoepitope, determined by the assays IB-C2C-HUSA and uC2C.
Biomarker immunoassays
The commercial IB-C2C-HUSA (IBEX) is designed primarily to detect a type II collagen 45-mer collagenase-generated cleavage fragment most commonly found in human urine12. This C-terminal cleavage neoepitope is recognized by the C2C monoclonal antibody8 and its presence on type II collagen fragments is detected in a sandwich assay in combination with capture antibodies. Capture antibodies were all specific for the intrachain epitope with sequence GEP GDD GPS. This sequence is separated from the downstream C2C neoepitope EGP PGP QG, recognized by antibody C2C by the sequence GA. The capture antibody preparation contains a mix of γ globulin derived from a chicken antiintrachain epitope antiserum and γ globulin of a murine monoclonal antibody 510912,19 (American Type Culture Collection Accession Number ATCC-HB-12435). The chicken γ globulin was affinity purified from polyclonal antisera commercially prepared in chickens against keyhole limpet hemocyanin–conjugated peptide intrachain epitope GEP GDD GPS (all by Gallus Immunotech Inc.). Both monoclonal antibodies (5109 and C2C) were protein A purified and monoclonal antibody C2C was labeled with horseradish peroxidase (HRP; labeling is proprietary). Capture immunoglobulin concentrations are also proprietary. The standard curve uses a 21-mer peptide according to the human sequence12, EK GEP(OH)GDDGPS GA EGPP(OH)GPQG (prepared by American Peptide) incorporating the 2 epitopes shown in italics, where OH signifies hydroxylation.
The IB-C2C-HUSA assay is conducted at room temperature. Precoated 96-well high-binding immunoassay plates (Biomat) containing capture antibodies to the intrachain epitope (120 μl/well) are prepared by binding antibodies overnight at 5°C in 0.5 M sodium carbonate buffer, pH 9.6. Plates are then washed 5 times with 350 μl/well of 0.10 mM potassium phosphate, pH 7.4 washing buffer, to remove unbound antibody. Here and elsewhere an automated microplate washer was used (Bio-Tek Instruments Inc.). To separate Corning 96-well microplates are added 30 μl of standard or controls (proprietary solvent) or sample to 30 μl proprietary matrix buffer. Then, 60 µl of dilution buffer [phosphate buffered saline (PBS) + 0.5% w/v bovine serum albumin; diagnostic grade, Millipore] is added to each well. After gentle mixing, 100 μl of the premixed solutions are transferred to the precoated plates that are incubated for 60 min. After incubation, the plates are washed 5 times with 350 µl/well washing buffer (PBS−0.05% v/v Tween). Then, 100 μl/well of HRP-labeled C2C antibody (proprietary information) is added and plates are incubated for another 30 min. After incubation, the plates are washed 5 times with washing buffer. Then 100 μl of 3,3′,5,5′-tetramethyl-benzidine peroxidase substrate in acidic buffer containing 0.1% H2O2 (KPL Inc.) is added to each well. After 30 min, 100 μl of 0.2M H2SO4 is added to each well to stop the reaction. Absorbance at 450–650 nm is measured with an ELISA plate reader (Molecular Devices) and the concentration of unknown samples determined by reference to the standard curve.
The sC2C assay for detecting specific type II collagen cleavage by collagenases has been described in detail8. In this study, this assay, when applied to urine, is referred to as uC2C. The standard used in this C2C assay is CGGEGP (Hyp)GPQG. These 2 assay standards for C2C and IB-C2C-HUSA were used to calculate pmole concentrations detected by each of these assays when examining urine.
Although both assays involve detection of the same neoepitope (C2C), the IB-C2C-HUSA assay also detects an intrachain epitope that is specific to type II collagen. Thus, this sandwich assay can detect only fragments of type II collagen that contain both these epitopes. In contrast, the sC2C and uC2C competitive inhibition assays (which are identical, but the letter preceding C2C indicates whether it is applied to either serum or urine) will detect any fragments containing the C2C neoepitope, including those that lack the intrachain epitope, which by definition will be smaller than any detected by the IB-C2C-HUSA. The IB-C2C-HUSA is designed to detect the dominant 45-mer fragment in urine (demonstrated previously by very sensitive mass spectrometry) and any larger fragments (not detected to date by any available technology).
Statistical analysis
Data were summarized as means and SD according to the above defined NCP, PRCP, and ROA subgroups for the cross-sectional analysis and by progression group for the longitudinal analysis. Medians and 25th and 75th percentiles are presented in Supplementary Table 1 (available online at jrheum.org). Biomarker means for each of the subgroups were compared using ANOVA. For the purpose of regression analyses, biomarker data were log-transformed, which resulted in normally distributed data based on quantile-quantile plots. To evaluate the association of the biomarker and its relationship to specific subgroups, multinomial logistic regression analysis was performed to determine the OR and 95% CI of the variable’s association with subgroup status for each of the following comparisons: (1) ROA versus NCP, (2) PRCP versus NCP, and (3) ROA versus PRCP. For the longitudinal analysis, logistic regression analysis was performed to evaluate the association of the biomarker with progression of cartilage pathology. All analyses were adjusted for age, sex, and body mass index (BMI). Additional sensitivity analysis was performed adjusting for baseline ROA in the longitudinal analysis. Reported OR reflect an increment of 1 SD of the log-transformed biomarker. Standardization was done to introduce comparability among effects of biomarkers, which are measured on different scales. Expressing effects in terms of “per SD” allows a comparison of the OR across biomarkers. Log transformation was done to improve the normality of the biomarker variables, and thus improve the interpretability of an effect expressed as “per SD.” Receiver-operating characteristic (ROC) curves were generated for each of the comparisons cross-sectionally and longitudinally for each biomarker. Area under the curve (AUC) statistic was calculated. To obtain population-based estimates, analyses were performed using age decade–sex stratum sampling weights. Analyses were performed using SAS v9.4.
RESULTS
Performance of IB-C2C-HUSA
The assay standard curve is shown in Figure 1. Sensitivity ranged from 156–5000 pg/ml. Interassay coefficient of variation (CV) was determined as the mean concentration and SD with each sample measured in quadruplicate on 3 plates, from 3 different pilot batches, by 3 different operators, for a total of 108 replicates on 27 plates (n = 27). For the intraassay CV, assays were also done in quadruplicate for each sample. The percent CV for each sample (set SD divided by the set mean concentration) were thus derived from 27 sets of quadruplicate data. Intraassay percent CV also denoted the mean of the 27 individual CV where n = 4 for each sample. Reproducibility was ≤ 4.8% for intraassays and ≤ 6.7% for interassays (Table 1).

Typical standard curve of C2C human urine sandwich assay.
IB-C2C-HUSA assay: intraassay and interassay variation.
Dilution linearity of samples was measured as undiluted, 1/2, 1/4, and 1/8 in dilution buffer for each of 4 different urine samples of known C2C concentration. Correlation coefficients were of r2 > 0.99 across assay range with average dilution recovery of 103% (88%–124%). Spike recovery (recovery of added standard) was evaluated by addition of 3 different amounts of the standard peptide to 4 different urine samples of known concentrations. A mean analyte recovery of 97% (88%–112%) was observed across the assay range.
Cross-sectional clinical results
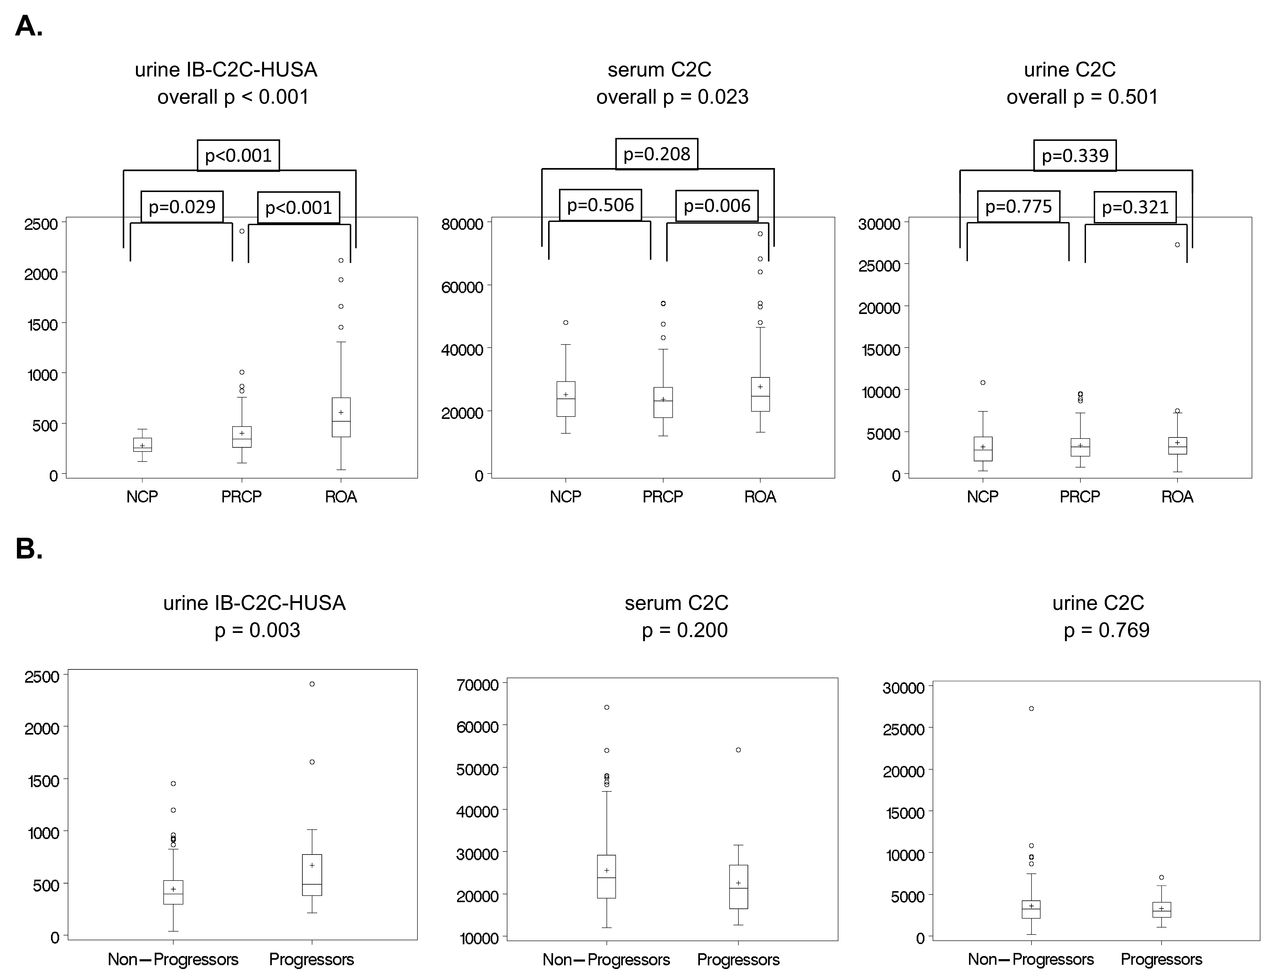
Of 255 subjects evaluated at baseline, 2 did not have specimens collected and were excluded. Of 253 subjects, 56.3% were female, mean age was 56.8 years, mean BMI was 26.5, and mean WOMAC pain was 20.5 (Table 2). NCP was seen in 13.6%, while 47.6% had PRCP and 38.8% had ROA. Age and BMI were different in the 3 subgroups, with p < 0.001 and p = 0.017, respectively. Mean (nontransformed) biomarker levels were statistically significantly different in these 3 subgroups for IB-C2C-HUSA (p < 0.001) and for sC2C (p = 0.023), but not for uC2C (p = 0.501; Figure 2A). There was a progressive increase in IB-C2C-HUSA with increasing cartilage degeneration.

A. Box plots of raw (nontransformed) biomarker baseline data by 3-level cartilage status, showing medians (horizontal line within boxes), interquartile range (boxes), and means (+ within boxes). Units are pg/ml for serum C2C and ng/mmol creatinine for urine C2C and urine IB-C2C-HUSA. P values based on ANOVA. B. Box plots of raw (nontransformed) biomarker baseline data by progression subgroups, showing medians (horizontal line within boxes), interquartile range (boxes), and means (+ within boxes). Units are pg/ml for serum C2C and ng/mmol creatinine for urine C2C and urine IB-C2C-HUSA. P values based on unadjusted logistic regression analysis. IB-C2C-HUSA: C2C human urine sandwich assay; NCP: no cartilage pathology; PRCP: preradiographic cartilage pathology; ROA: radiographic osteoarthritis.
Baseline sample characteristics by osteoarthritis (OA) status and by progression status. All data are mean (SD), unless otherwise indicated.
Based on data shown in Figure 2A and Figure 2B, we can calculate the relative pmole concentrations of the fragments detected in urine with the IB-C2C-HUSA and uC2C, by using the molecular weights of the standards used in these 2 assays. The results demonstrate that the pmole concentration of the fragments measured by the IB-C2C-HUSA is about 14-fold less than that measured by the uC2C.
In the multinomial logistic regression analysis, urine IB-C2C-HUSA was associated with an increased risk of ROA vs NCP (OR 2.90, 95% CI 1.64–5.13; p < 0.001) and ROA vs PRCP (OR 1.88, 95% CI 1.27–2.77; p = 0.002), while PRCP vs NCP (OR 1.55, 95% CI 0.95–2.50; p = 0.077) was not statistically significant, with overall p < 0.001 (Table 3). sC2C was associated with ROA compared to PRCP (OR 1.44, 95% CI 1.06–1.97; p = 0.022), but was not associated with ROA vs NCP (p = 0.809) or PRCP vs NCP (p = 0.16; overall p = 0.052). Similarly, no statistically significant associations were found for uC2C for any of the 3 comparisons (overall p = 0.293; Table 3). ROC curves are shown in Supplementary Figure 1 (available online at jrheum.org). For the prediction of ROA compared to NCP, AUC was 0.889 for urine IB-C2C-HUSA, 0.827 for sC2C, and 0.825 for uC2C. AUC ranged from 0.676 to 0.723 for prediction of PRCP vs NCP and from 0.707 to 0.754 for ROA vs PRCP. For all comparisons, AUC were largest for urine IB-C2C-HUSA, compared to sC2C and uC2C.
Cross-sectional association of log-transformed biomarkers with subgroups using multinomial logistic regression analysis, adjusted for age, sex, and body mass index.
Longitudinal clinical results
Compared to the baseline study population (n = 253), subjects in the longitudinal study (n = 161) had similar baseline demographic characteristics (Table 2). Progression of cartilage damage was seen in 15.2% of subjects overall. In those with ROA, 25.2% progressed compared to 10.4% and 0% in the PRCP and NCP groups, respectively. Baseline urine IB-C2C-HUSA (non–log-transformed) levels were significantly higher in progressors compared to nonprogressors [mean (SD) 659.8 (446.8) vs 430.9 (215.5), p = 0.003], whereas no statistically significant differences were seen for sC2C and uC2C in progressors compared to nonprogressors (Figure 2B).
In logistic regression analysis (Table 4), the risk of progression was significantly increased with higher levels of urine IB-C2C-HUSA (OR 1.97, 95% CI 1.14–3.43), while neither sC2C (OR 0.70, 95% CI 0.44–1.12) nor uC2C (OR 0.91, 95% CI 0.59–1.41) were significantly associated with progression of cartilage damage. Sensitivity analysis with further adjustment for baseline ROA showed similar results (Table 4). ROC curves and AUC for prediction of progression are shown in Supplementary Figure 1 (available online at jrheum.org).
Association of baseline log-transformed biomarkers with cartilage loss over 3 years using logistic regression analysis.
Correlations of biomarkers are shown in the Supplementary Table 2 (available online at jrheum.org). Only sC2C and uC2C were significantly correlated and only in progressors.
DISCUSSION
By using a combination of IB-C2C-HUSA, measuring cartilage specific collagenase-generated fragments, and both MRI and radiographic analyses, we were able to observe differences between subjects with no cartilage pathology and those with both early and advanced lesions in knee articular cartilage. Further, the risk of disease progression on MRI was increased in subjects with higher levels of this urine biomarker.
The IB-C2C-HUSA assay, described in detail for the first time to our knowledge, is designed to primarily detect a specific dominant 45-mer collagenase-generated type II collagen peptide, previously detected by mass spectroscopy and the type II collagen neoepitope (TIINE) assay, in increased amounts in the urine of patients with OA12. The new IB-C2C-HUSA assay differs from the TIINE assay12,19 by use of the type II collagen-specific C2C antibody rather than monoclonal 9A4. The latter has similar properties, but unlike monoclonal C2C, recognizes both type I and II collagenase-generated primary carboxy-terminal cleavage neoepitope–containing fragments. Thus, although both assays involve detection of the same neoepitope (C2C), the IB-C2C-HUSA sandwich assay in addition detects an intrachain epitope that is also specific to type II collagen. Hence this sandwich assay can detect only fragments of type II collagen that bear both these epitopes. In contrast, the C2C competitive inhibition assay will detect any fragments, including those with or without the intrachain epitope. Those without the intrachain epitope will, by definition, be smaller than any detected by IB-C2C-HUSA assay. Thus, IB-C2C-HUSA will detect the dominant 45-mer fragment in urine and any larger fragments bearing both the intrachain epitope and the neoepitope. Such larger fragments have not been detected by any technology, including mass spectrometry.
Our observations reveal that by using this sandwich assay, it was possible to identify production in urine of collagenase-generated type II collagen fragment(s) bearing the C2C neoepitope, but only at greatly reduced pmole concentrations (about 14-fold lower) compared with those measured by the uC2C competitive inhibition assay. The results show that the more specific urine IB-C2C-HUSA assay detects a subpopulation of fragments in urine that are associated with pathological changes. It is only the IB-C2C-HUSA assay that can discriminate between fragments bearing only the C2C neoepitope and those bearing both the C2C neoepitope and the intrachain epitope, such as would be present on the 45-mer fragment or any other of larger size bearing these 2 epitopes.
The IB-C2C-HUSA assay detected only very low or no concentrations in serum (data not shown). Urine detection by this assay may thus result from glomerular filtration resulting in the concentration from serum of collagenase-generated fragments.
Using the IB-C2C-HUSA urine assay, we found a statistically significant association of the elevated concentration of cartilage collagen fragments with advanced radiographic changes, the latter characterized as OA, as well as an increased risk with early preradiographic cartilage degeneration, although the latter was not statistically significant. Further, in those already exhibiting cartilage pathology, analysis of baseline urine with this assay was predictive of subsequent cartilage loss over 3 years, with progressors exhibiting increased levels compared to nonprogressors. Additional sensitivity analyses with adjustment for baseline radiographic OA did not change these conclusions. Such clear differences between groups and relationships to disease progression were not observed for the C2C assay when applied to baseline serum and urine samples. These observations indicate that with progressive onset of knee cartilage pathology, there is evidence for the increased involvement of the degradative activity of collagenases degrading cartilage type II collagen as revealed by the increase in the IB-C2C-HUSA assay data with progressive damage to knee articular cartilage. Such elevations of collagenase activity within early focal9 and late1,5,6,7 lesions in articular cartilage have been previously observed in ex vivo analyses.
OA is a condition in which the progressive loss of articular cartilage is now viewed as a discontinuous phasic process20,21. Therefore the ability to use molecular biomarkers to identify the “progressive status” of a patient at any 1 time requiring treatment, or for recruiting patients into a clinical trial, is of great value and importance. Previously, a combination of biomarkers such as CTX-II in combination with a biomarker of type IIA collagen biosynthesis pointed to the ability to identify groups of patients that exhibited subsequent OA progression22. This evidence of an imbalance in collagen turnover in those who progress was also noted by Cahue, et al10 using the ratio of the sC2C and serum c-propeptide of type II collagen assays, although the differences were not significant. The observation that this new urine assay alone is predictive of progression, in those with existing cartilage pathology, is thus of significant value in therapy and clinical trial recruitment, because it has the capacity to enrich study populations with progressors and potentially to identify whether a treatment is preventing disease progression. Even more discriminatory results may be found in the future from a combination of IB-C2C-HUSA with other biomarkers.
This study has several limitations. We did not include an asymptomatic control group. Our definition of cartilage worsening took into account only change in lesion depth, not lesion area extent, which may lead to underestimation of cartilage worsening. Serum and urine specimens were obtained at various times of day, potentially resulting in greater variability. Despite this, we found significant associations with disease status and progression. The strengths of our study include the evaluation of a population-based cohort, which allows for generalizability of results to the symptomatic population at large, and the inclusion of the full spectrum of knee OA severity, which enhances our understanding of the early preradiographic stage of disease.
We have demonstrated significant associations of the new urine IB-C2C-HUSA immunoassay with cartilage damage cross-sectionally and with cartilage loss longitudinally in a population-based cohort of early preradiographic disease and radiographic OA. Our study confirms the association of collagenase activity with radiographic OA, but also further points to the association of increased collagenase activity in early preradiographic articular cartilage degeneration and highlights its importance as a therapeutic target in cartilage degeneration.
ONLINE SUPPLEMENT
Supplementary data for this article are available online at jrheum.org.
Acknowledgment
We thank Dr. John M. Esdaile for his mentorship in obtaining funding for the original cross-sectional study11.
Footnotes
Full Release Article. For details see Reprints/Permissions at jrheum.org
The cohort study was funded by grants from the Canadian Institutes of Health Research (#89890, #89997), the Canadian Arthritis Network (01-MNO-09N), and The Arthritis Society (TAS04/0063). Dr. Cibere was supported by an Investigator Award from The Arthritis Society (INS-12-027).
- Accepted for publication June 17, 2016.
Free online via JRheum Full Release option


