

Abstract
Objective. The polysymptomatic distress (PSD) scale is derived from variables used in the 2010 American College of Rheumatology (ACR) fibromyalgia (FM) criteria modified for survey and clinical research. The scale is useful in measuring the effect of PSD over the full range of pain-related clinical symptoms, not just in those who are FM criteria-positive. However, no PSD scale categories have been defined to distinguish severity of illness in FM or in those who do not satisfy the FM criteria. We analyzed the scale and multiple covariates to develop clinical categories and to further validate the scale.
Methods. FM was diagnosed according to the research criteria modification of the 2010 ACR FM criteria. We investigated categories in a large database of patients with pain (2732 with rheumatoid arthritis) and developed categories by using germane clinic variables that had been previously studied for severity groupings. By definition, FM cannot be diagnosed unless PSD is at least 12.
Results. Based on population categories, regression analysis, and inspections of curvilinear relationships, we established PSD severity categories of none (0–3), mild (4–7), moderate (8–11), severe (12–19), and very severe (20–31). Categories were statistically distinct, and a generally linear relationship between PSD categories and covariate severity was noted.
Conclusion. PSD categories are clinically relevant and demonstrate FM type symptoms over the full range of clinical illness. Although FM criteria can be clinically useful, there is no clear-cut symptom distinction between FM (+) and FM (−), and PSD categories can aid in more effectively classifying patients.
Diagnosis of fibromyalgia (FM) by criteria has depended on identifying a point on a continuum of symptoms where the symptom burden is sufficient. For the 1990 American College of Rheumatology (ACR) criteria1, that point is ≥ 11 of 18 tender points in patients with widespread pain. The 2010 ACR criteria for FM2 and the subsequent self-report version of the 2010 criteria (modified 2010) are also based on a symptom severity point3. For the 2010 series of criteria, a diagnosis of FM can be made when levels of the Widespread Pain Index (WPI) and Symptom Severity Scale (SSS) are sufficiently high (WPI ≥ 7 and SSS ≥ 5 or WPI 3–6 and SSS ≥ 9). The WPI is a 0–19 count of painful nonarticular body regions and the SSS is a 0–12 measure of symptom severity that includes fatigue, sleep, and cognitive problems.
Subsequently, it was found that the underlying (or latent) spectrum of severity that formed the basis for the 2010 criteria could be visualized by adding together elements of the ACR 2010 or modified 2010 criteria to form the polysymptomatic distress (PSD) scale (Figure 1)4,5. The scale is obtained by summing the 2 components of the 2010 criteria, the WPI and SSS:


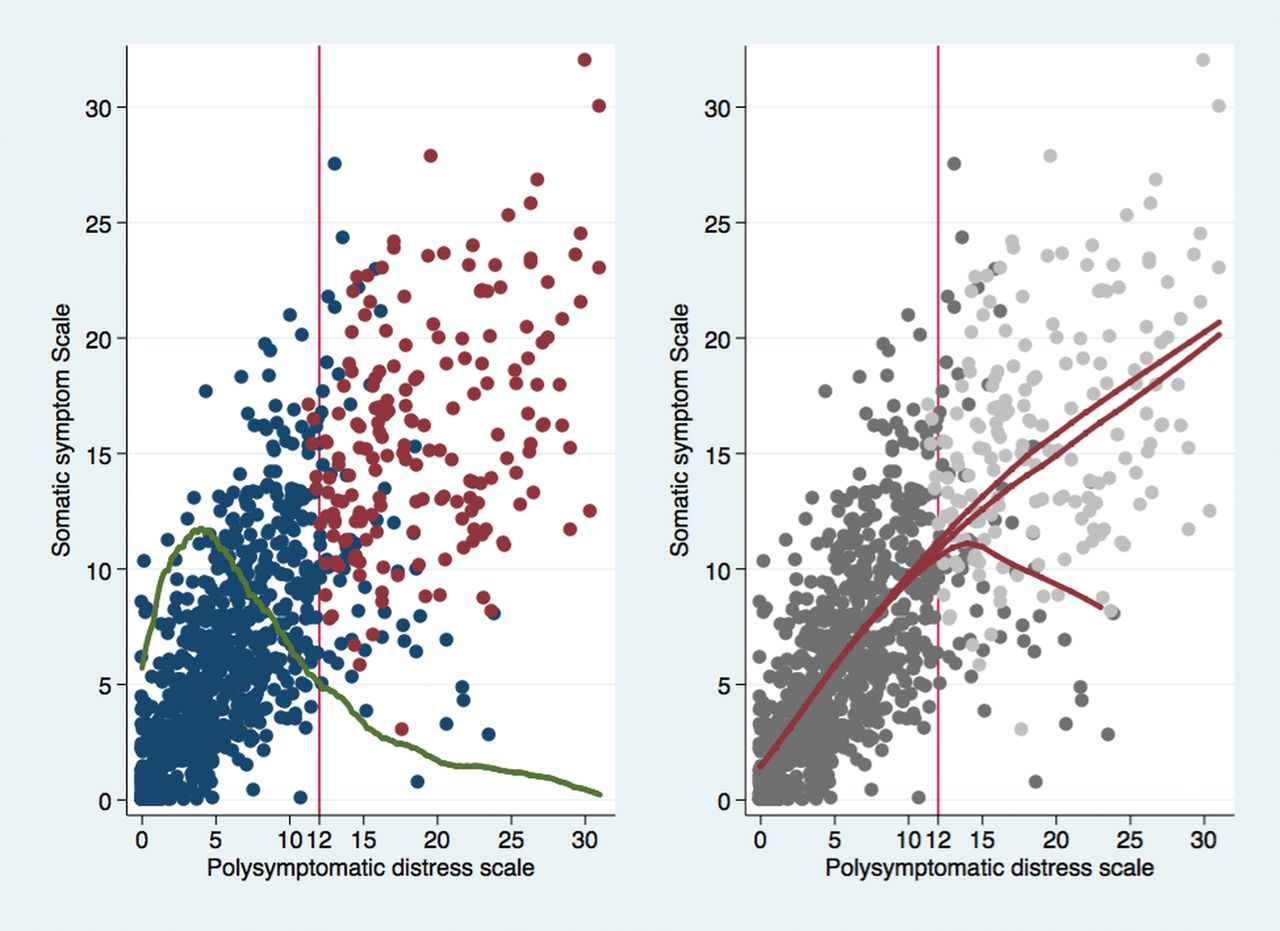
Random sample of 1000 patients with RA. Left panel displays plot of SSS-8 scale against PSD. Green line is overlaid plot of distribution of PSD values. Red dots represent patients satisfying FM criteria. Blue dots represent patients not satisfying criteria. Right panel shows regression lines. Upper red line includes values ≥ 12 that are FM-positive. Middle line includes FM-positive and -negative values, and lower line includes only FM-negative values. The SSS-8 is used for illustration because it expands the Y-axis and allows identification of individual high and low somatic symptom patients among those with scores > 12. RA: rheumatoid arthritis; SSS-8: somatic symptom score; PSD: polysymptomatic distress scale; FM: fibromyalgia.
The PSD scale was important because it showed just where the patient’s FM-associated symptoms were on the distress continuum while still allowing a dichotomous diagnosis. FM diagnosis by PSD location is estimated. Because of the definitional requirements of the FM criteria that were described above, a positive FM diagnosis will always have a PSD score of at least 12, but not all subjects with a score ≥ 12 will satisfy FM criteria because there is a small degree of misclassification (sensitivity 95%, specificity 93%). This can be seen in Figure 1: the blue circles at a PSD ≥ 12 would be misclassified as patients with FM if PSD alone was used for diagnosis. In Figure 1 (right panel), the lower red line indicates the decreased somatic symptom score (SSS-8) on patients with a PSD ≥ 12 who do not also satisfy ACR criteria.
With the development and use of the PSD scale5, the idea that FM was only a discrete disorder was no longer tenable, even though a dichotomous disorder might offer some practical clinical advantages. The PSD scale, however, offers the ability to measure the comparative severity of illness because higher PSD scores mean more severe and extensive symptoms6. For “experts,” each level of the PSD scale can have meaning, but for ordinary use and ordinary users, it can be helpful to describe the scale in a series of categories. In our study, we developed cutpoints for different levels of severity based on a broad sample of patients with rheumatoid arthritis (RA).
MATERIALS AND METHODS
We studied FM and FM severity in 2732 patients with RA. Patients with RA offered the important advantage of being selected for study only because of RA and not because of the presence or absence of FM. In addition, FM can be found with sufficient frequency in RA so that ample sample sizes were obtained7. Finally, patients with RA without FM are a natural comparison group that varies in severity and thereby allows the examination of the full range of PSD. The only other comparable unbiased population is the general population, but that is only available in epidemiological studies. Mean PSD scores were increased in RA compared with non-RA subjects, but the relationship between PSD levels and other clinical variables remained relatively constant, irrespective of diagnosis8,9,10.
In this report, we used participants and data from the National Data Bank for Rheumatic Diseases (NDB) longitudinal study of rheumatic disease outcomes using questionnaires completed in the first half of 2014. Participants were volunteers, recruited from the practices of US rheumatologists and who completed mailed or Internet questionnaires about their health at 6-month intervals. They were not compensated for their participation. The diagnosis of RA was made by the patient’s rheumatologist or confirmed by the patient’s physician in the small number of cases that were self-referred. The NDB used an open cohort design in which patients were enrolled continuously. About 8% of patients discontinued participation per year11. Characteristics of the NDB have been reported previously12.
We diagnosed FM according to the modified preliminary ACR 2010 criteria3. A diagnosis of FM can be made when levels of the WPI and SSS are sufficiently high (WPI ≥ 7 and SSS ≥ 5, or WPI 3–6 and SSS ≥ 9). The WPI is a 0–19 count of painful nonarticular body regions and the SSS is a 0–12 measure of symptom severity that includes fatigue, sleep, and cognitive problems. The PSD score was calculated by summing the WPI and SSS score for each patient. To determine cutpoints for PSD, we first determined the location and range of the lowest or “normal” category by examining published data on the distribution of PSD scores in the general population5. In that study, 68% of persons had PSD scores ≤ 3, and in that group, close to normal scores were found for pain, physical function, psychological status, somatic symptoms score, and other variables as shown in Figure 2 and Figure 3 of the published study. As an example, only 0.24% of the PSD ≤ 3 group reported any pain. We therefore considered persons with PSD scores between 0–3 to be in the “none” category of PSD categories. Because it was our goal to consider non-FM and FM groups separately, we added 2 equally spaced additional categories for the non-FM group (PSD < 12). Based on the linear relation between PSD and clinical variables in Figure 3 of the population study, we labeled the scores from 4 through 11 as “mild” (4–7) and “moderate” (8–11). Among patients with FM (who must have a PSD score of at least 12), we used a single split based on our experience with the PSD scales in general and with variable severity levels for PSD ≥ 125. Two categories for criteria-positive subjects were consistent with the relationship between the 2 highest categories of the patient health questionnaire (PHQ)-15 somatic symptom scale13,14, 10–14 and 15–30, and the PSD. Overall, for the research described in our study, this resulted in dividing PSD scores into 5 severity categories: 0–3 none, 4–7 mild, 8–11 moderate, 12–19 severe, and 20–31 very severe. In the results that followed, we validated these cutpoints by examining the distribution of PSD within categories and the progression of other severity variables as the PSD categories increased.

Levels of the SF-36 PCS score as a function of PSD scores and categories in patients with RA. The main curve is predicted PCS scores and 95% CI. The distribution of PSD scores is shown in the overlaid kernel density plot. SF-36: Medical Outcomes Study Short Form-36; PCS: physical component summary; PSD: polysymptomatic distress scale; RA: rheumatoid arthritis.

The probability of having a VAS pain score ≥ 6 as a function of PSD scores and categories in patients with RA. The main curve is predicted pain ≥ 6 and 95% CI. The distribution of PSD scores is shown in the overlaid kernel density plot. VAS: visual analog scale; PSD: polysymptomatic distress scale; RA: rheumatoid arthritis.
We determined the presence of widespread pain according to the ACR 1990 FM criteria1. Pain and global severity were assessed using 0–10 visual analog scales (VAS). Functional status was measured using the Health Assessment Question-Disability Index (HAQ)15. We also calculated the physical (PCS) and mental component summary scores from the Medical Outcomes Study Short Form-36 (SF-36)16. To evaluate depression and anxiety, we used the PHQ-2 and generalized anxiety disorder-2 (GAD-2) scales. According to Kroenke, et al, “these consist of the first 2 items of the PHQ-9 and GAD-7 respectively, and constitute the 2 core DSM-IV [Diagnostic and Statistical Manual, vol. 4] items for major depressive disorder and generalized anxiety disorder, respectively […] the recommended cutpoints for each when used as screeners is a score of 3 or greater. When used together, they are referred to as the PHQ-4, a 4-item screening measure which ranges from a score of 0 to 12, and serves as a good measure of ‘caseness’ (i.e., the higher the score, the more likely there is an underlying depressive or anxiety disorder).”17 According to Gierk, et al, the SSS-8 “is a reliable and valid self-report measure of somatic symptom burden. Cutoff scores identify individuals with low, medium, high, and very high somatic symptom burden.”18
Statistics
Analyses were performed using Stata 13.119. We calculated the best cutpoint for PSD (PSD ≥ 12) to identify the modified 2010 FM criteria positivity using the Youden index20. The fitted lines on Figure 1 were derived from Lowess regressions19. Predicted lines on Figure 2, Figure 3, and Figure 4 were derived from univariate linear and logistic regression followed by Stata margins and margins plot procedures. We compared groups in Table 1 using univariate linear and logistic regression, as appropriate. To compute p values that account for multiple comparisons within groups of Table 1, we used Scheffe multiple comparisons test. Groups differ for all symptoms at p < 0.5 using Scheffe multiple comparison test, implying that a test for the trend in groups is positive. In Table 2, we compared the 2 subgroups labeled ACR+ and ACR± separately using Student t tests and chi-square tests, as appropriate.

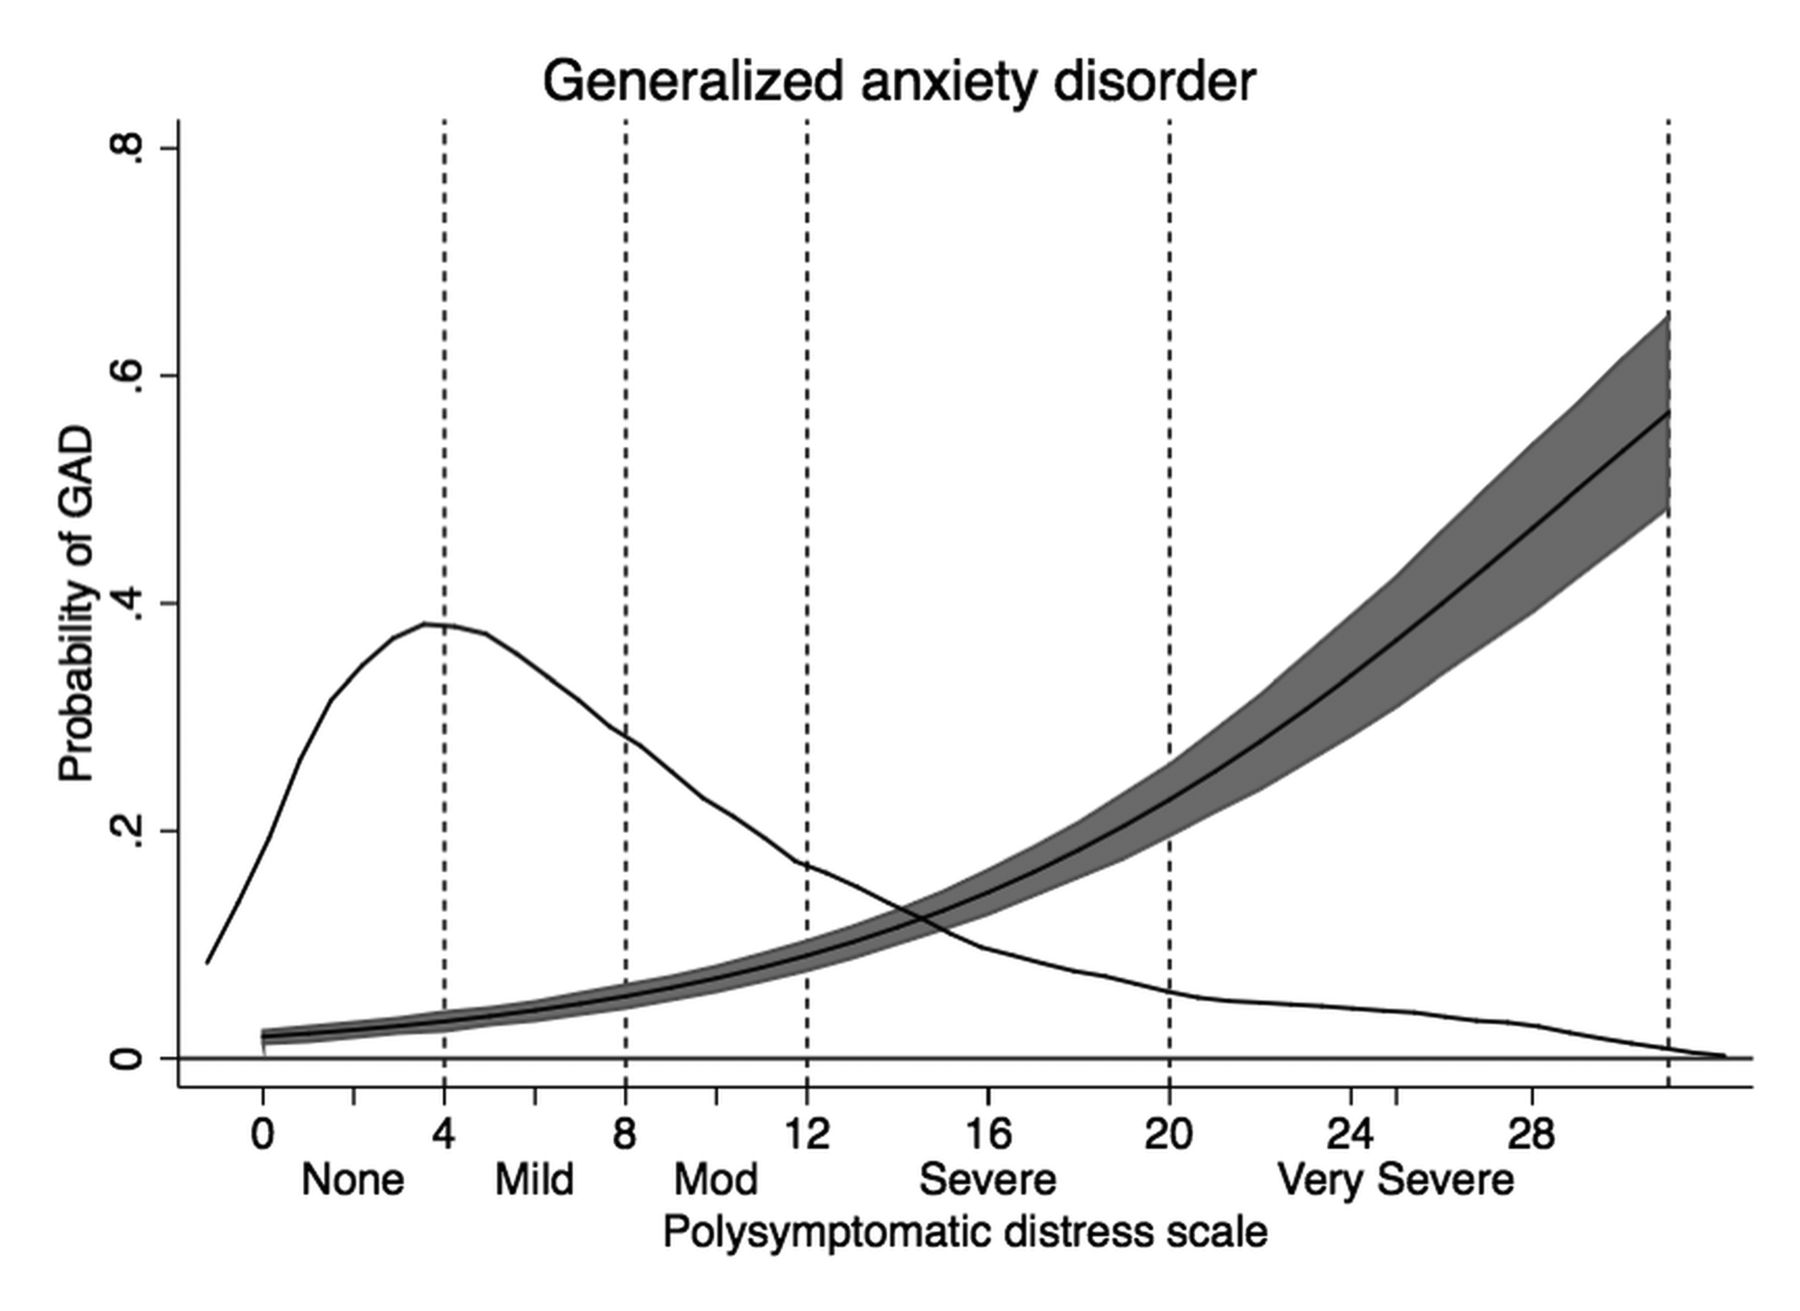
The probability of GAD as a function of PSD scores and categories in patients with RA. The main curve is predicted GAD and 95% CI. The distribution of PSD scores is shown in the overlaid kernel density plot. GAD: generalized anxiety disorder; PSD: polysymptomatic distress; RA: rheumatoid arthritis.
Clinical characteristics of none, mild, and moderate PSD groups of RA subjects who do not satisfy modified ACR research criteria for FM. Groups differ for all symptoms at p < 0.5 using Scheffe multiple comparison test. Values are mean (SD) or % unless otherwise specified.
Clinical characteristics of severe and very severe PSD groups in RA subjects who satisfy modified ACR research criteria for FM. Groups differ for all symptoms at p < 0.5. ACR+ and ACR± groups were analyzed separately. Values are mean (SD) or % unless otherwise specified.
We did not control for either the duration of RA or number of comorbidities in our analyses. First, we found no significant difference in duration among groups. Controlling for comorbidities would also control for symptoms and bias the analyses. However, in sensitivity analyses, the reported difference in comorbidities among groups was slight and the adjusted means were minimally different from those reported in the tables.
Ethical approval
The study was approved by the Via Christi institutional review board (Wichita, Kansas, USA).
RESULTS
We divided patients with RA according to the 5 severity categories: 0–3 none, 4–7 mild, 8–11 moderate, 12–19 severe, and 20–31 very severe, as shown in the density curve of Figure 2 and in Table 1 and Table 2. We made additional alternative categories in severe or very severe PSD according to whether groups contained patients who always satisfied the modified 2010 FM criteria or groups contained some patients who did not satisfy the ACR criteria. As shown in Table 2, the increase in percent of subjects in the ACR severe group (± positive or negative group) who satisfied the criteria was 7.6% (18.1–10.5). However, the increase in the very severe group was 0.8% (8.5 minus 7.7). Severity differences between ACR+ and ACR± groups are also shown in the upper and lower regression lines of Figure 1 (right panel).
Among patients in the none, mild, and moderate groups of Table 1, there was a statistically significant stepwise increase in severity scores for the variables shown in column 1, indicating that the categories adequately separated severity groups. The increases all continued in the severe and very severe groups of Table 2. Of interest, the percent of men decreased from 23.4% in the none group to 11.5 in the very severe modified ACR group of Table 2. Simultaneously, ages were progressively younger across the categories.
Severity changes could also be seen as increases in variables related to FM. For example, the percent with widespread pain increased from 0% to 18%, 57.5%, 87%, and 100%. Concomitant increases were also seen in the WPI, SSS, and PSD.
Functional status as measured by HAQ and the SF-36 PCS score worsened substantially across all categories in the tables. This is shown dramatically in Figure 2 where the PCS began about at expected US population mean (∼47.4) and finished 3 SD below the mean (∼27.5). VAS pain levels also changed dramatically, starting at 1.3 and ending at 6.5. The effect of categories on pain score is shown in Figure 3 where the probability of having a pain score ≥ 6 increased across the categories.
The categorization also identified the increases in somatic symptoms reporting (SSS-8) and psychological variables. High or very high levels of somatic symptoms increased from 0.4% to 78.2%. Probable cases of PHQ-2 depression increased from 1.3% to 31.2%. Probable cases of GAD as measured by GAD anxiety increased from 1.3% to 27.5% (Figure 4). Additional data regarding the variables in Table 1 and Table 2, including correlations with PSD and effect sizes between categories, is shown in Supplementary Table 1 (supplementary content is available from the authors on request).
One potential limitation of simply using PSD as surrogate for FM diagnosis was that all persons who had PSD scores ≥ 12 did not satisfy the FM criteria. It could be seen from Figure 1 (left panel) that most who failed to satisfy the criteria did so because of an insufficiently high somatic symptom severity score. The consequences of the separation between FM and PSD at PSD levels ≥ 12 could be seen in Figure 1 (right panel). The highest red line shows the regression line for those who satisfied the criteria, the lower line for those who did not, and the middle line for all patients considered together. Practically, this meant that using PSD without regard for criteria status resulted in a small error. At a cutpoint of 12, the Youden index was 0.897 and the classification accuracy was 91.6%.
DISCUSSION
All things being equal, continuous scales are more informative than categories21. In the case of FM criteria-positive versus -negative, this is particularly true because both positive and negative groups contain a full range of different severities. For example, persons with PSD scores of 11 and 12 are very similar and those with scores of 1 and 12 are very different, yet both patient scores are subsumed into simple positive and negative categories. Multiple categories overcome some of the difficulties of simple dichotomization. In the current study, we divided the 0–31 PSD score into 5 categories and provided simple names (e.g., moderate, severe) that would make using the scale easier for investigators and clinicians in that they would not have to translate potentially unfamiliar individual scores into severity levels.
The 5 category levels we have suggested for PSD divide severity into increasing severity categories. This is easily seen in Tables 1 and 2, and in Figures 2, 3, and 4. One advantage of the none, mild, and moderate categories is that they easily demonstrate that PSD is operative in those who are FM criteria-negative, and that PSD is a continuum, not just associated with those who satisfy the FM criteria. One should note that all of the variables we evaluated in the tables were affected by the PSD scores.
In the 3 categories of patients without FM who had scores < 12, each category had a range of 4, and commensurate increases in evaluated variables were noted. When we came to scores ≥ 12, the available range was 19 points. We elected to make 2 categories, splitting at 20, because the differences in variable severities between severe and very severe categories was small (Table 2), and it did not appear that meaningful subgroups could be obtained. Those who disagree can make additional categories for use in their work or to simply use the uncategorized PSD value. A number of authors have confirmed the usefulness of the PSD for FM assessment22,23,24,25,26.
By using an RA databank, we were able to obtain sufficient patients to adequately evaluate categories. Because FM is more common in RA than in the general population, the PSD curve is shifted to the right. However, the relationship between severity and PSD categories is not affected by the use of RA subjects8,9,10.
The advantages of the criteria/PSD scale as a measure of severity are several. First, the scale is simple to use and to score, and is increasingly being used in patients with FM6,23,25,27. Second, it provides a useful overall measure of FM severity. Finally, it can be used in all patients, not just those with FM — particularly because what is being measured with PSD is a universal quantity, not a score just used for FM.
One widely used FM assessment questionnaire is the 21-item VAS scale FM Impact Questionnaire-Revised (FIQ-R)28. It includes 3 dimensions of severity: function, effect, and symptoms, and requires weights for proper scoring. This scale taps into major domains of illness and has been used effectively in FM studies. The advantage of the FIQ-R is its comprehensive detail. A disease-neutral version of the FIQ-R that is called the Symptom Impact Questionnaire (SIQR) is also available. The SIQR is identical to the FIQ-R, but does not contain any reference to FM29. The advantages of the PSD compared with the FIQ-R scale are that it is more easily used in patients without FM because it is not an “FM questionnaire,” provides an intelligible scale (now with categories) across the full spectrum of PSD (0–31), and can also be used for approximate diagnosis14. The SIQR has only been used once (as of 2015) by the authors, but could be an effective tool when patients without FM are evaluated in studies.
The Outcome Measures in Rheumatology group has suggested domains that should be evaluated for FM research30. We have suggested that for clinical practice (and probably for research), a common set of simple variables that can be used across all rheumatic diseases and pain illness, rather than disease-specific variables, can be an effective way to evaluate patients31. Boomershine has reviewed comprehensive assessment tools in FM32 and proposed a 7-item VAS scale assessment tool based on an older, shortened version of the FIQ33,34.
In a number of publications and in clinical practice, authors have wanted to use a high PSD score as a surrogate for FM diagnosis. As we have demonstrated here, PSD scores ≥ 12 may occur in persons who do not satisfy the ACR 2010 or modified 2010 criteria. In the current study, we found that 31.6% of the 727 persons with scores ≥ 12 did not satisfy criteria for FM. This occurred primarily in persons with high WPI scores who had SSS scores < 5. Less frequently, it can occur with high symptom SSS, but insufficiently high WPI. In the current study, the study misclassification when using a PSD ≥ 12 was 8.4%. We have previously reported that a score ≥ 13 was the optimum score in the study being reported, and authors have used that estimate in published reports. However, the optimum PSD cutpoint depends on the proportion of persons satisfying the ACR 2010 or modified 2010 criteria and the distribution of PSD scores among study subjects. In the current study, the optimum cutpoint as determined by the Youden Index was 1220. However, there will be little difference in classification when similar levels are used. Best classification is not just simply lowering misclassification rates because different cutpoints have different sensitivities and specificities that might be important to investigators or clinicians. We recommend that the criteria rather than PSD levels be used for individual patient diagnosis, but when evaluating many patients or to understand severity levels and effects, the PSD can be used.
In making categories, certain arbitrary judgments came into play. Although we were guided by external data sources as well as covariates available in this report, other authors might have made different judgments about categories and their break points. It remains to be seen whether our categories will be clinically useful, and future studies will be necessary for external validation.
PSD scores are associated with severity variables. Categorization of PSD into 5 groups maintains the associations with severity variables and provides a simple method to use and understand PSD in subjects with and without FM.
- Accepted for publication April 1, 2015.


