

Abstract
Objective. To identify subgroups of pain trajectories in patients with symptomatic knee osteoarthritis (OA), and to explain these different trajectories by patient characteristics, lifestyle, and coping factors, as well as radiographic features.
Methods. Longitudinal data of pain severity (0–10) from 5 years of followup of the CHECK (Cohort Hip and Cohort Knee) study was used. Latent class growth analysis identified homogeneous subgroups with distinct trajectories of pain. Multinomial regression analysis was used to examine different lifestyle and coping characteristics between the trajectories.
Results. In longitudinal pain data of 5 years of followup in 705 participants, 3 pain trajectories were identified: marginal, mild, and moderate pain trajectories. Compared with the marginal pain trajectory, the mild and moderate pain trajectories can be characterized by the following baseline variables: body mass index (BMI) > 25, additional hip pain, low education level, using the coping strategy “worrying,” and having ≥ 3 comorbidities. Moderate pain trajectory can be supplemented with the Kellgren-Lawrence grading scale grade ≥ 2 radiological change.
Conclusion. Three trajectories of pain were identified. Participants with a BMI > 25, secondary school as highest education level, having at least 3 comorbidities, additional hip pain, and/or whose coping style is worrying are more likely to develop a moderate or mild pain trajectory compared with those without these characteristics. In the management of knee pain in people with early symptomatic OA, attention should also be given to additional factors such as hip pain, other comorbidities, passive coping strategy, and obesity.
Knee pain is often the first sign of knee osteoarthritis (OA) and it is known that its level and course over time can be very different among patients1. It is helpful to study individual development of pain severity over time to subsequently identify subgroups with comparable pain trajectories. The next step is to study determinants that may explain these different trajectories. This may lead to different treatment modalities targeted to the identified trajectories.
Apart from pain, other important symptomatic outcome measures for OA are activity limitations and patient global assessment2. Previously, in the Cohort Hip and Cohort Knee (CHECK) study, homogeneous subgroups in the development of activity limitations over time were identified3. The present report analyzes whether subgroups can also be identified in the development of pain over time and which variables can be associated with the pain trajectories. The individual development of knee pain severity over time might depend on the radiographic OA severity, but also on patient characteristics, such as sex and age4, additional comorbidities5, and pain coping strategies6. Pain coping can be defined as people’s behavioral and cognitive attempts to manage or tolerate pain and its effects7, and can be classified into active and passive coping strategies. Passive strategies are generally negative (maladaptive), but some are probably more negative than others, whereas some active strategies may be more worthwhile than others8. Analyses of pain coping strategies in patients with OA may be important in minimizing the effect of symptoms and establishing appropriate disease management9. Moreover, influencing lifestyle factors may be important in strategies aimed at prevention because they are modifiable by definition. As yet, the role of lifestyle and coping factors in modifying different pain trajectories in early OA is unclear.
Radiographic joint damage has emerged as one of the risk factors for reported joint pain10. OA structural progression over time has been reported to occur in diverse patterns: knees that are progressing in structural deterioration versus knees that are stable11. Rapid radiological deterioration [change of ≥ 2 Kellgren-Lawrence grading scale (KL) in 4 or 5 yrs] is related to worsening of pain and function12. Therefore, to explain differences in pain trajectories, it is important to take not just the presence, but rather the change in radiographic damage into account13.
Several statistical measures can be used to identify different longitudinal patterns of change14. Latent class modeling has been suggested to be the most appropriate group-based technique for examining interindividual differences in intraindividual change15. Other group-based modeling studies used either 2-step cluster analysis on repeated measures of the Western Ontario and McMaster Universities Osteoarthritis Index of pain or they used the proposed latent class growth analysis (LCGA), but included patients with evidence of radiographic OA (≥ KL 2) or used LCGA on repeated measures of disability/activity limitation. For the purpose of this paper, we focused on participants with early symptomatic OA, in which severity of knee pain is the primary outcome.
This study sets out to identify subgroups of pain trajectories in patients with early symptomatic knee OA, and to explain these different trajectories through baseline lifestyle, coping factors, and radiographic features, as well as changes in radiographic features over time.
MATERIALS AND METHODS
Study population
From October 2002 until September 2005, 1002 participants with pain and/or stiffness of the knee and/or hip were included in the CHECK study. Individuals were eligible if they had knee or hip pain or stiffness pain, were aged 45–65 years, and had not yet consulted their physician for these symptoms or the first consultation was within 6 months before entry. Participants were excluded if hip or knee pain was based on any other pathological condition that could explain the symptoms (e.g., other rheumatic disease, previous hip or knee joint replacement, congenital dysplasia, osteochondritis dissecans, intraarticular fractures, septic arthritis, Perthes disease, ligament or meniscus damage, plica syndrome, Bakers cyst)14. The study was approved by the medical ethics committees of all participating centers, and all participants gave their written informed consent before entering the study15,16. For the analyses in our study, longitudinal data from 5 years of followup of CHECK participants with knee pain at baseline were included.
Outcome variables
Pain severity (during the previous week) of the knees was measured annually with the numerical rating scale (NRS 0–10), with a higher score indicating more pain. The participant is instructed to select the number that best reflects the intensity of pain16. The NRS for pain is a 1-dimensional single-item scale that provides an estimate of patients’ pain intensity that is easy to administer and score17. The postsurgery pain severity data of participants who underwent total knee replacement during the 5-year followup period were coded as missing.
Independent variables
At baseline and after 5 years of followup, lifestyle, coping, and radiographic characteristics were measured. The lifestyle factors, body mass index (BMI), smoking, physical activity, and alcohol use, were obtained by self-report. Smoking was categorized as smoker or nonsmoker; the latter included former smokers. Presence of physical activity was defined as a minimum of 3 times a week at least 30 min of moderately intense physical activity. Pain Coping Inventory was used, which analyzes 3 active pain coping strategies (transformation, distraction, reducing demands) and 3 passive pain coping strategies (retreating, worrying, resting)8. All 6 strategies (33 items) are rated according to a 4-point Likert scale ranging from 1 (hardly ever) to 4 (very often) in terms of frequency with which strategies are applied when dealing with pain. Per strategy, the mean of the items was measured and used.
Comorbidity count was assessed with a self-reported health module of the Central Bureau of Statistics in the Netherlands, which encompasses 24 chronic diseases18. To assess radiographic OA features of the knee, posterior-anterior semiflexed weight-bearing radiographs of both tibiofemoral joints were obtained according to the protocol described by Buckland-Wright, et al19,20. All radiographs were scored blinded for pain status, but with knowledge of the chronological sequence, according to the KL21. These radiographs were scored by 5 trained readers. Interobserver variability was tested during the scoring of the entire cohort in a subset of 38 participants scored by all 5 observers yielding moderate to substantial interobserver agreement (average κ 0.58 for presence of KL 0 vs KL 1, 2, and 3 in the knees)22. Both knees were examined, but only 1 knee (index) per participant was used in the analyses. The knee with the most radiographic change from baseline to 5-year followup was used23. If both knees showed no change or equal change, the knee with the greatest osteophyte area at baseline was used.
Radiographs were also analyzed for more detailed quantitative variables by use of Knee Images Digital Analysis (KIDA)24. The KIDA variables, minimum joint space width (JSW; mm) and osteophyte area (mm2), were measured without knowing the sequence of the radiographs; only the index knee was used in the analyses. Also for the index knee, the change from baseline to followup in JSW and osteophyte area was calculated and used in the analyses.
Statistical analyses
To define homogeneous subgroups of trajectories based on the individual development of pain over time, LCGA was used. The goal was to identify the population heterogeneity with a (latent) categorical variable denoting the number of subgroups with similar trajectories. In LCGA, the classification for the individual growth trajectories is performed based on the intercept, which represents the value when time is equal to 0, and slope, which represents the rate of change in the outcome over time. The classification estimates a mean growth curve for each class in which the variance of latent slope and intercept are fixed to 0 within class, and allowed to vary only across classes15.
The decision as to which of the models with x number of subgroups is the best is determined by a combination of factors: fit indices, the research question, parsimony, size of classes, and interpretability. The model fit indices with corresponding criteria used in the analyses: the smallest Bayesian information criteria (BIC) value, high entropy value (near 1.0), a significant Vuong-Lo-Mendell-Rubin likelihood ratio test (LRT), and bootstrap LRT. Both LRT tests provide a p value that indicates whether the minus 1 x model is rejected in favor of the x class model25.
To explain the differences between the identified trajectories, baseline characteristics were described and analyzed with multinomial logistic regression. The identified trajectory with the best outcome was chosen as a reference group. First, univariate multinomial logistic analyses were performed; if p value was ≤ 0.1, and after a check for collinearity, the variable was included into the multivariate multinomial logistic analysis26. In the following multivariate analyses, we used a backward selection method (p removal 0.05). Further, Hosmer-Lemeshow goodness-of-fit test and Nagelkerke pseudo R2 statistics were calculated27. To evaluate whether the changes of radiographic features could explain differences between the trajectories, a univariate and multivariate multinomial logistic regression was performed. This multivariate model was adjusted for baseline variables that were found to be significant in Model A.
Mplus version 6.1 was used for LCGA; all other analyses were performed using SPSS version 20.
RESULTS
Identified outcome trajectories
Longitudinal data from 5-year followup of participants with knee pain at baseline and with available data from at least 3 followup visits were analyzed. Of 705 participants, 81% were women; mean age of 56 years; at baseline, mean pain severity (NRS) was almost 4 on a scale of maximum 10 points; and 52% of participants had hip pain in addition to knee pain (Table 1). The nonlinear model with 3 classes was determined to be the best compared with a model with 4 classes or a linear model with 3 classes, based on the combinations of fit indices, size of classes (smallest classes n = 189 compared with n = 71 in the model with 4 classes), and interpretability. The 3 pain trajectories were designated as marginal, mild, and moderate. There was no substantial worsening or improvement over time in the trajectories (Figure 1). Marginal pain trajectory (n = 222) had a mean intercept of 2.3 and a mean slope of −0.5. Mild pain trajectory (n = 294) had an intercept of 3.7 and a slope of −0.2. The moderate pain trajectory (n = 189) had an intercept of 5.1 and a slope of 0.6. Baseline characteristics of participants in the 3 pain trajectories are given in Table 1. The difference in pain severity between the trajectories almost met the criterion for clinically meaningful (i.e., 15%)28; 14% between mild and marginal, and 15% between mild and moderate.
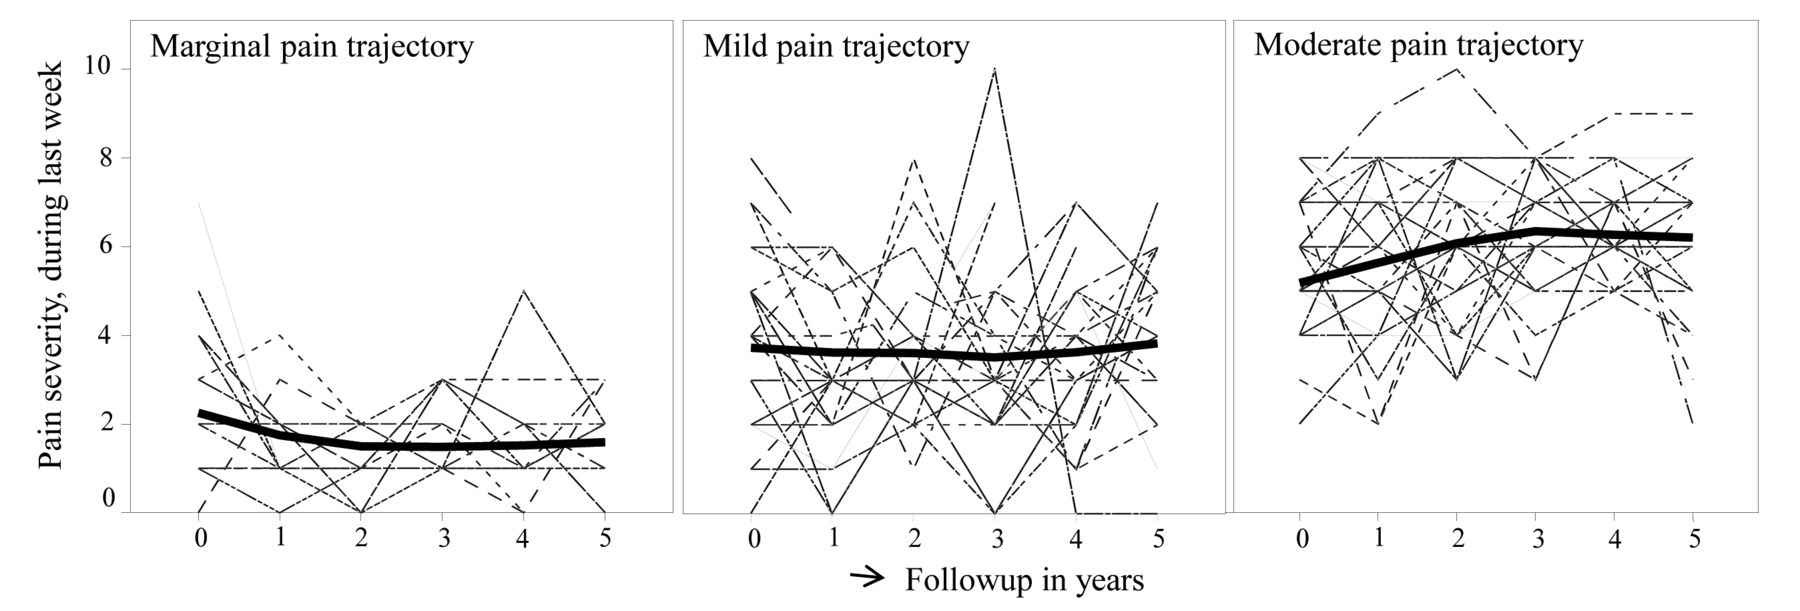
The 3 pain trajectories. For each, a 10% random selection of the observed pain scores during followup of participants is shown. The bold line is the mean of the trajectory of the pain scores during followup.
Characteristics of all subjects and characteristics of the identified trajectories. Values are mean (SD) unless otherwise specified.
Differences between outcome trajectories based on baseline characteristics
In Table 2 are presented univariate OR of the independent baseline variables in the multinomial logistic regression model, as well as the included variables in the final multinomial logistic regression. Presence of hip pain increased the odds for the mild pain trajectory by 1.8 compared to marginal pain trajectory and increased the odds for the moderate pain trajectory by 2.9 compared with marginal pain trajectory. BMI above 25 increased the odds for the mild pain trajectory by 1.6 compared with marginal pain and increased the odds for the moderate pain trajectory by 2.3 compared with a marginal pain trajectory. Being a smoker had univariate significant OR that disappeared when highest education level was included in the multivariate model.
Multinomial logistic regression for univariate and multivariate association of baseline variables with mild and moderate pain trajectory (marginal pain trajectory is used as reference group). Values are OR (95% CI) unless otherwise specified.
Primary or secondary school as highest education level increased the odds for a mild pain by 1.9 and for moderate pain by 2.5 compared with marginal pain trajectory. An increase in the passive coping strategy “worrying” doubled the odds for a mild pain compared with a marginal pain trajectory. A moderate pain trajectory was 2.9 compared with marginal pain trajectory for the worrying strategy. An increase in “resting” strategy increased the odds for a moderate pain by 1.9 compared with marginal pain trajectory. The presence of at least 3 comorbidities at baseline increased the odds for the mild pain by 2.1, and the odds for the moderate pain by 2.5 compared with the marginal pain trajectory. There was no association found between the radiographic features at baseline and the mild and moderate pain trajectories.
Difference between outcome trajectories based on changes of radiographic features
Table 3 suggests that most radiological KL score changes and increase in osteophyte area occur in participants in the moderate pain trajectory. After 5 years of followup, there were more joint replacements in the moderate pain (12 total knee and 5 total hip replacements) and the mild pain trajectory (4 total knee and 9 total hip replacements) compared with marginal pain trajectory (1 total knee and 1 total hip replacement), with chi-square p values 0.02 and 0.03, respectively.
Radiographic changes from baseline to 5-year followup in the marginal, mild, and moderate pain trajectories. Values are mean (SD) unless otherwise specified.
In Table 4, the univariate OR of the changes of radiographic features from baseline to 5-year followup are presented. In the multivariate KL Model B, KL changes were included, as well as the baseline KL grades and all the baseline variables of multivariate Model A (Table 2). In Model B, a KL change of at least 2 grades after 5 years increased the odds of the mild pain by 2.0 compared with the marginal pain trajectory, and odds of the moderate pain by 2.9 compared with the marginal pain trajectory. In Model C, the KL change and osteophyte change are included in the multivariate model, which is also corrected for the baseline variables of multivariate regression Model A (Table 2). A KL change of at least 2 points in Model C increased the odds of the moderate pain by 2.8 compared with the marginal pain trajectory.
Multinomial logistic regression for univariate and multivariate association of changes of radiographic features from baseline to followup with mild and moderate pain trajectory (marginal pain trajectory is used as reference group). Values are OR (95% CI) unless otherwise specified.
DISCUSSION
Our present study is one of the first to use LCGA to identify different trajectories of pain severity in participants with early symptomatic OA. We identified marginal, mild, and moderate pain trajectories with different baseline characteristics. Participants at baseline with a BMI above 25 who had lower education, at least 3 comorbidities, additional hip pain, and applied the coping strategies “worrying” and “resting” were more likely to have a moderate pain compared with a marginal pain trajectory. Besides these baseline variables, the moderate pain trajectory can be explained by a radiographic KL change of at least 2 points at 5-year followup.
The results in this report are consistent with the heterogeneity of the evolution of pain over time; however, most work in this area has focused on pain at the cohort level. In a previous study, pain, on average, worsened over 7 years, but 35% and 27% of those who initially reported hip and knee pain, respectively, had improved29. There are a few studies that have used a group-based modeling approach to identify trajectories in OA and identified a different pattern of trajectories. Two studies showed that some subjects remained stable over time and others fluctuated or progressed14,30. A study using data from the Osteoarthritis Initiative (OAI) showed trajectories without these fluctuations over time31. The difference in the pattern of trajectories can be explained by the differences of included subjects. The pattern of trajectories in our study most closely resembles the identified trajectories of the OAI, although those trajectories were identified in a cohort of subjects with radiographic knee OA (KL ≥ 2). They identified 5 trajectories: 2 with mild pain, 2 with moderate pain, and 1 with severe pain31. Also, none of those trajectories demonstrated marked improvement or worsening over time, with the exception of a slight improvement after baseline for all trajectories12.
The effect of high BMI is consistent with the literature32. With regard to smoking, the results vary in the literature from a moderate protective effect in case-control studies to no effect on OA when restricting the analysis to cohort studies32. One other study examined the effect of smoking on pain trajectories and concluded that current smokers had overall more knee pain33. A metaanalysis of OA progression showed no association between smoking and OA progression. Smoking may be seen as a wider proxy marker of a person’s social demographics, lifestyle, and weight that may be involved in the different pathways of OA progression34. Besides, several OA studies reported that lower education was associated with more self-reported pain35,36, which is in accordance with our results. In our study, it seemed that smoking is a confounder in the relationship between the trajectories and highest education level. Education is one measure of socioeconomic status (SES), and it is often used in studies investigating the effectors of SES34,37.
The results regarding the coping strategies we studied differ from other studies that found no relation between active and passive coping strategies and pain intensity38, or demonstrated that active coping strategies predicted a high level of pain intensity39. Because the strategies “worrying” and “resting” increase the odds of a moderate pain trajectory 2.9 and 2 times, respectively, it is likely that these coping strategies are maladaptive. However, we did not find a prognostic influence of active coping strategies on pain trajectories. These findings recommend a holistic approach to the management of OA; advice on coping strategies should already be incorporated at the early stages of the disease.
Our findings support other findings on trajectories; obesity, comorbidities, and lower education were associated with trajectories characterized by greater pain31.
The effort to identify trajectories in the presence of activity limitations led to the conclusion that the population was best described by a linear model with 3 trajectories: good, moderate, and poor outcomes3. In our analyses, the course of pain trajectories was best described by a nonlinear model with 3 classes. Therefore, the results of both models cannot be compared directly. Nevertheless, it is striking that comparable variables were found that characterized the worst trajectories: higher BMI, hip pain, ≥ 3 comorbidities, and resting. Different factors were also identified in both studies attributable to varying fields of interest and perhaps because of a difference in models. In our study on pain trajectories, other coping strategies, education, and lifestyle factors were examined as well. Participants who had lower education and applied the coping strategy “worrying” were more likely to have a mild or moderate pain trajectory.
Conflicting results have been reported regarding the association between pain and damage visible on radiographs10,40,41. Worsening of disease, or OA progression, can occur at different rates. It has been suggested that individuals with slow progression may have more opportunity to adapt to the changes in physiology, and therefore experience less pain13. This is confirmed in the CHECK and OAI cohorts, where worsening of pain and function after 5 years of followup is related to rapid radiological progression (radiological change of KL grade ≥ 2)12. The progression of KL in our study is one of the variables that explains the moderate pain trajectory.
Our study has several strengths, but also some limitations. The CHECK study is a prospective, observational cohort study with 10-year followup. The study is centrally coordinated to guarantee high-quality data (e.g., dropout after 8 yrs of followup is < 10%). There are also notable limitations. Because hip pain was more present in the moderate pain trajectory, it could be that this pain trajectory represents individuals with more generalized OA. In the model, the association of the presence of ≥ 3 comorbidities was analyzed, but not the presence of specific comorbidities. It is known that additional problems in the musculoskeletal system (such as back disorders) or depressive mood may worsen pain5. Moreover, it would be interesting to know whether individuals of the moderate pain trajectory have characteristics of neuropathic pain. Unfortunately, this information on generalized OA and neuropathic pain was not measured. Although LCGA seems to be preferable to the simpler methods for identifying homogeneous subgroups, there is still an ongoing discussion about model fit variables for choosing the optimal number of classes15. The BIC is the most-used model fit variable and was used in this analysis42. We made an association model based on baseline variables and progression variables to explain the difference between the trajectories. Very likely, other variables that we did not include, such as generalized OA, neuropathic pain, and specific comorbidities, also played a role. The next step is to develop a prediction model in which other clinical variables measured by the general practitioner (e.g., range of motion, palpable warmth, crepitus) are also included. Additionally, our findings need to be validated in another early OA population.
Different trajectories of pain exist that can be explained by different clinical features, coping strategies, and lifestyle factors. The pain evolution of participants in the moderate pain trajectory can be explained by an increase in damage revealed on imaging (change of KL grade ≥ 2). Participants with a BMI > 25, secondary school as the highest education level, at least 3 comorbidities, additional hip pain, and who worry and avoid activity to cope with their pain are more likely to develop a moderate pain trajectory. Distinguishing these baseline characteristics and different pain trajectories during followup may have implications for treatment. Treating symptomatic OA should also be based on modifiable factors, comorbidities, and behavior.
Footnotes
Financial support from the Dutch Arthritis Association.
- Accepted for publication April 30, 2015.


