

Abstract
Objective. The functional disability experienced in juvenile idiopathic arthritis (JIA) is primarily caused by joint effusion, synovial membrane hypertrophy, and periarticular soft tissue edema, leading to the degeneration of the osteocartilaginous structures because of the inflammatory process in the synovium. The ability to visualize the inflammatory changes and hence the ensuing osteocartilaginous degeneration is, therefore, of great importance in pediatric rheumatology. Ultrasonography (US) has been validated as a tool for measuring cartilage thickness in healthy children and, previously, we have found good agreement with the measures obtained by magnetic resonance imaging (MRI). Our aim is to validate and compare US with MRI measurements of distal femoral cartilage thickness in the knee joint at the medial condyle, lateral condyle, and intercondylar spots in children with JIA, and to locate the best spot for imaging comparisons.
Methods. One knee from each of 23 children with oligoarticular JIA were investigated by both MRI and US. Outcome measures of imaging procedures were distal femoral cartilage thickness.
Results. We found a high level of agreement between MRI and US measurements of mean cartilage thickness, and Rho values between modalities were high (between 0.70 and 0.86, p < 0.05 for all). We found a thinner cartilage thickness at the medial condyle in comparison to the other investigated points. Evaluation of anatomical landmarks for optimal measurement of cartilage thickness was found to be the intercondylar spot, which was easier to locate in addition to a smaller variance around the mean for that anatomical measuring point.
Conclusion. US measurements of distal femoral cartilage thickness are highly correlated to MRI measurements. The intercondylar notch of the distal femoral cartilage may be the best anatomical point for cartilage thickness measurements of the knee. US is a reliant and nonexpensive, non-invasive modality for visualization of childhood femoral cartilage.
Juvenile idiopathic arthritis (JIA) is the most common rheumatic disease in childhood, resulting in musculoskeletal pain, joint stiffness, and joint swelling. JIA will lead to disability if left untreated. The longterm functional disability experienced in JIA is primarily caused by the degeneration of the osteocartilaginous structures in the affected joints because of the inflammatory process in the synovium1. The ability to visualize the inflammatory process and the following osteocartilaginous degeneration is, therefore, of great importance in pediatric rheumatology. The imaging modalities most frequently used are conventional radiography, magnetic resonance imaging (MRI), and within the last decade, ultrasonography (US)2. MRI may currently be regarded as the gold standard imaging modality in rheumatic diseases because it can visualize all tissues with excellent precision. The ability to weigh sequences for specialized tissue imaging and the use of contrast agents make it superior to conventional radiography and US. MRI is especially effective in visualizing hyperemia and synovitis, and in predicting erosive changes by visualizing bone marrow edema3,4,5,6,7,8. However, MRI without contrast enhancement seems to be less sensitive in visualizing hyperemia and synovitis than US using the Doppler technique9,10. But in the pediatric setting, an established scanning methodology for the description of synovitis has not yet been validated11. MRI usually allows the examination of only a few joints in each session, and small children often need administration of sedatives or even general anesthesia to complete the scan12.
With the use of high frequency US, joint cartilage is visualized as an anechoic structure. We have established age-related and sex-related normal reference intervals for cartilage thickness in different joints in 7- to 16-year-old healthy children13. In a previous study, we found a good level of agreement in cartilage thickness measurements between MRI and US14. Compared to the normal reference intervals, we found reduced articular cartilage thickness in children with JIA using the US modality15. The aim of our study was to validate US measurements of hyaline cartilage thickness in the knee of children with JIA, comparing them with MRI findings, and to locate a preferred anatomical landmark for cartilage assessment at the distal femur.
MATERIALS AND METHODS
Forty-one children diagnosed with JIA according to the 2001 revised International League of Associations for Rheumatology (ILAR) classification16, aged 7–15 years and followed at our pediatric rheumatology clinic, were invited to participate in the study when the availability of the MRI scanner for research purposes was known. The invitation was sent at least 1 month prior to the examination date. Patients who were booked for a clinical examination within 14 days of the MRI examination date, and who met the inclusion criteria, were selected for the study. Patients were examined between November 2008 and October 2011.
Inclusion criteria were persistent or extended oligoarticular JIA according to the ILAR classification16, with at least a 6-month disease duration, and age 7–15 years. Exclusion criteria were intraarticular corticosteroid injections (IACI) within 1 month prior to examination, a history of joint surgery, inability to participate without sedation for the MRI, or presenting other contraindications to MRI. All patients and parents gave written informed consent and the trial was approved by the local ethics committee.
Clinical examination
Joint activity was assessed by a pediatric rheumatologist and was defined as swelling within the knee joint or limitation in the range of joint movement with joint pain or tenderness16. In each patient, we established a Juvenile Arthritis Disease Activity Score consisting of the active joint count of 10 (bilateral knee, ankle, wrist, second metacarpophalangeal, and second proximal interphalangeal joints), erythrocyte sedimentation rate, parent global assessment, and physician global assessment as previously described17.
Medical records
Medical records were reviewed for the history of previous joint activity in the knees, number of IACI in the knee joints, and disease duration (defined as first sign of arthritic activity confirmed by a physician).
US examination
A Hitachi EUB 7500 scanner with a 6–14 MHz linear transducer (EUP-L65; Hitachi Medical Systems) was used for the examinations. The same US observer, with at least 3 years of musculoskeletal US experience, performed all examinations. Pressure of the probe was adjusted to a level just below visible deformation of the anatomical structure. US settings were uniform in all examinations, using B-mode US. The child was placed in a supine position with the knee joint maximally flexed according to the European League Against Rheumatism guidelines17 and with the transducer in a cross-sectional position as described13. US measurements were performed in both knees.
Cartilage measurements were performed at the medial and lateral condyles and in the midline of the intercondylar notch. The angle of the US insonation was orthogonally to the cartilage surface, which secured a sharp demarcation of the cartilage surface, yielding a white line, which was included when measuring thickness of the cartilage. Regarding medial and lateral condyles, the cartilage thickness was measured at the point at which a horizontal line hit the cartilage tangentially.
When comparing MRI and US measurements of cartilage thickness, it is important to correct the US measures according to the speed of sound in the cartilage18. US machines most frequently assume an average sound speed in soft tissues of 1540 m/s, but several studies have pointed out that the speed of sound in joint cartilage is actually higher, i.e., about 1696 m/s (1626–1892 m/s)18,19,20. This results in a false interpretation of the distance calculated based on the time it takes for the ultrasonic wave to pass through the tissue, and thereby the cartilage thickness is displayed wrongly on the US screen. Based on the knowledge of the sound speed in soft tissue, we registered both the observed US measures and the corrected measures, which were calculated using the formula:

MRI examination
The investigators evaluating the MRI images were blinded to the US data. Further, the US examiners were blinded about which knee (right or left) was scanned by MRI.
MRI scans were randomly performed of 1 knee only because of the limited availability of the MRI scanner, and thus limited examination time. The radiologic technologist randomly selected which knee was scanned by MRI. The patients were first scanned by US in both knees and afterward sent to MRI. Images were assessed in the same planes as the US measurements. We used a 1.5 Tesla Signa Horizon Twin Speed (GE Healthcare). Sequences: 3-plans localizer, sagittal 3-D spoiled gradient fat saturation, coronal T1, and sagittal short-tau inversion recovery with a designated knee coil (4 ch T/R extremity array by Medrad Inc.). The observer used the 3-D sequence for localizing the most distal part of the femoral bone to locate the planes of US assessments, and then it was used for measuring cartilage thickness. The other sequences were used to analyze the knee joint in general, but not for the specific purpose of our study. Outcome measures for comparing MRI with US were cartilage thickness measured as close to the same spots as the US measurements as possible. The scans were performed by an experienced radiologic technologist with 6 years of experience, and assessments were analyzed by a consultant radiologist with more than 10 years of experience in rheumatologic MRI scans.
Statistics
We used a Stata 11 software package (StataCorp LP). Correlation between cartilage measurements by MRI and US was calculated using the nonparametric Spearman rank test. Comparison of cartilage thickness was done using a paired Student t test. Bland-Altman plots were used to evaluate systematic errors between the modalities. Only data of the 23 corresponding knees were used for statistical purposes.
RESULTS
Of the 41 children with JIA who were invited to participate in our study, 4 declined and 14 never answered our invitation letter. As a result, we included 23 children in our study. The median age was 11.9 years (range 7.2–15.7 yrs), with 17 girls and 6 boys. The patient cohort consisted of 16 children with persistent oligoarticular JIA and 7 children with extended oligoarticular JIA (Table 1). We did not register data on the 18 children not included because this was a comparative study between the 2 imaging modalities. In total, data from 23 MRI scans were correlated with the equivalent knee in 23 of the 46 US scans.
Demographic data of study population.
Sixteen of the 23 children had a history of active arthritis in the knee joint. None of the patients had active arthritis at the time of examination. Of these, 13 had received treatment with IACI up to 4 times. Mean disease duration at time of investigation was 63 months, ranging from 6 to 154 months. Eighteen children were treated with nonsteroidal antiinflammatory drugs, 2 with methotrexate, and 3 received etanercept at the time of the investigation. Four children did not receive any medication.
Cartilage thickness
Knee joint cartilage thickness was measured at 3 locations of the distal femoral base (Figure 1; Table 2). Using US, we found a thinner cartilage at the medial condyle in comparison to the lateral and the intercondylar cartilage thickness (p = 0.005 and p = 0.05, respectively). With MRI, we found the same tendency; however, the difference was not statistically significant.

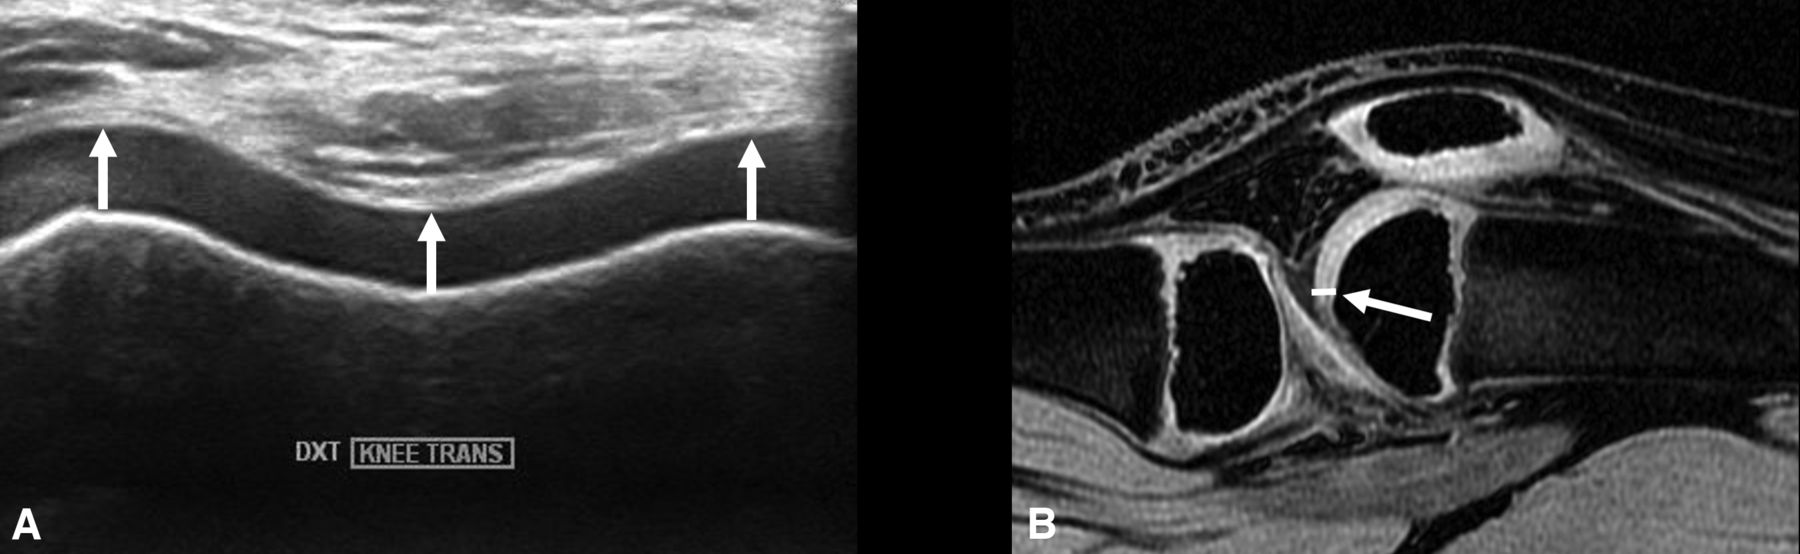
A. US of knee cartilage. B-mode transverse of the distal femoral cartilage. White arrows show assessment landmarks. B. MRI of knee cartilage: sagittal 3-D spoiled gradient echo fat-saturated. White arrow shows intercondylar spot of assessment. US: ultrasonography; MRI: magnetic resonance imaging.
Comparison of cartilage thickness measured by MRI and US. “US Corrected” indicates recalculated measures after correction for the speed of sound in the cartilage tissue. Values are mean ml (± SD) unless otherwise specified.
The mean intercondylar cartilage thickness was 3.2 mm (± 0.7 mm SD) when assessed by US and 3.5 mm (± 0.7 mm SD) when assessed by MRI. Cartilage thickness assessed by US correlated significantly to the MRI measurements (r = 0.70, p < 0.05). However, the mean of cartilage thickness differed significantly between the modalities (p = 0.01), with an estimated difference of 0.3 mm (95% CI 0.1–0.5).
At the medial condyle, the US and MRI cartilage thickness was measured to 3.0 mm (± 0.9) and 3.3 mm (± 1.3), respectively, with an estimated difference of 0.31 mm (95% CI −0.03–0.6; p = 0.07). We found a significant correlation between MRI and US values (r = 0.86, p < 0.001).
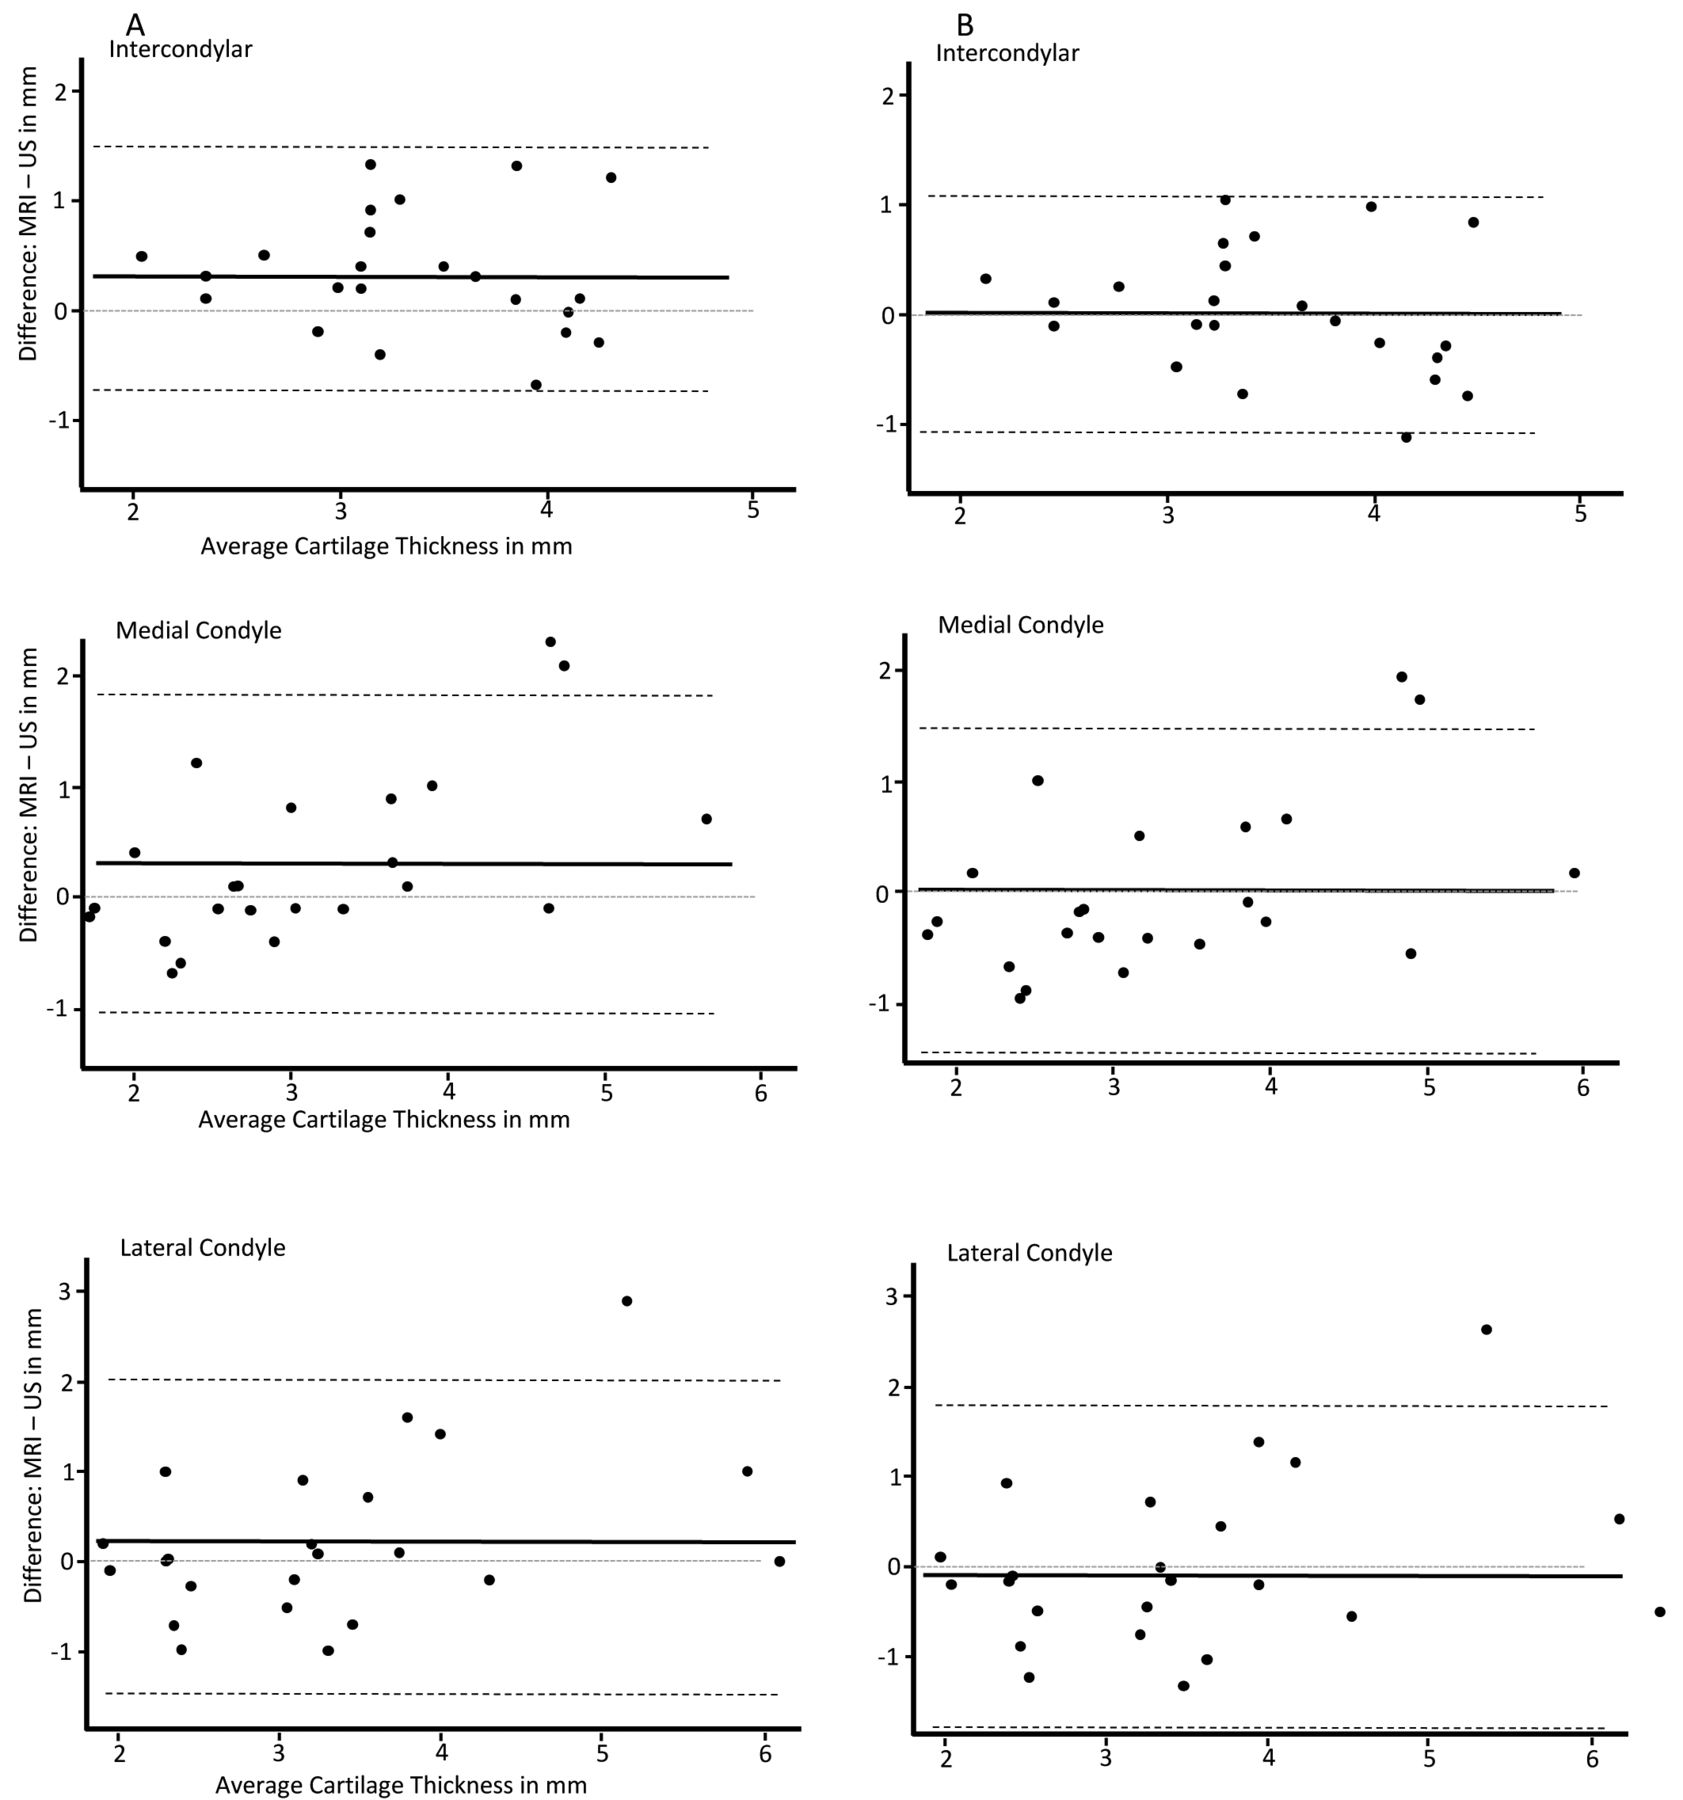
Similarly, the cartilage thickness of the lateral condyle measured by US was closely related to MRI findings (r = 0.71, p < 0.001). With US, we measured a mean thickness of 3.2 mm (± 1.0), while with MRI, we found a mean thickness of 3.5 mm (± 1.4), with an estimated difference of 0.23 mm (± 0.9, p = 0.23). For all 3 spots, the variance around the mean difference is presented in Bland-Altman plots (Figure 2A) showing a systematic error measuring that US values were lower than those of MRI. When correcting for sound velocity within the cartilage tissue, the US measurements of cartilage thickness were in agreement with the cartilage thickness measured by MRI and the systematic error was eliminated (Table 2; Figure 2B).

Bland-Altman plots of the 3 assessed locations. A. Without correction for sound velocity in cartilage. B. Corrected for sound velocity in cartilage. Solid line represents mean difference, dashed line represents ± 2 SD. Numbers are in mm. US: ultrasonography; MRI: magnetic resonance imaging.
Comparing cartilage thickness in joints with a previous history of active arthritis to those without, we found thinner cartilage in the joints previously affected by arthritis. This was significant for the lateral condyle measurements (p = 0.04), but did not reach statistical significance for intercondylar or medial condylar cartilage measurements (p = 0.08 and p = 0.06, respectively; Figure 3). Comparable cartilage thickness was measured by US and MRI in joints previously treated with intraarticular corticoid injections (Figure 4).
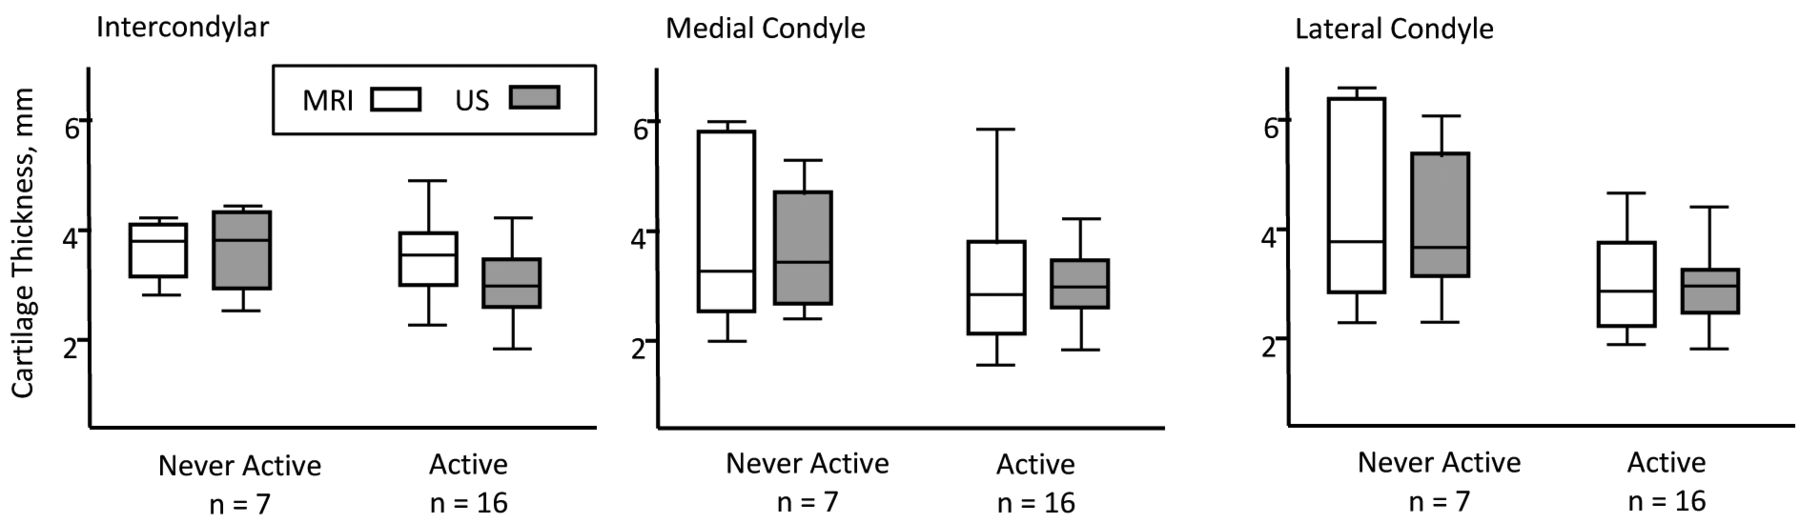
Box plots of cartilage thickness measures in knee joints of a patient with JIA with and without a history of active disease. JIA: juvenile idiopathic arthritis; US: ultrasonography; MRI: magnetic resonance imaging.

Cartilage thickness measurements by US and MRI versus number of IACI. US: ultrasonography; MRI: magnetic resonance imaging; IACI: intraarticular corticosteroid injections.
DISCUSSION
Several comparative validation studies of MRI and US in adult rheumatology have been published21,22,23,24; however, to the best of our knowledge, the 2 imaging modalities have not yet been fully validated in pediatric rheumatology3,12,25,26. A comparison of inflammatory outcome measured by US and MRI has been done23,24. In healthy children, we evaluated measurement of hyaline articular cartilage thickness by US and MRI of small and large joints, and found acceptable agreement also for the knee joint between the 2 modalities14. To our knowledge, our present study is the first to compare cartilage thickness measured by MRI and US in children diagnosed with JIA.
Previous studies have described the advantages of MRI in visualizing bone edema, bone erosions, effusion, and synovitis when using contrast enhancement25,27. However, in the daily routine, pediatric rheumatologists do not fully benefit from MRI because of its limited availability, time consumption, low flexibility in number of joints evaluated per session, and the need for sedation of younger children. Although US cannot visualize intraarticular structures hidden behind bony surfaces, US has the advantage of being readily available, mobile, and well tolerated and accepted by children. Because of its high water content, hyaline cartilage appears as an anechoic structure easily visualized by high-frequency US28.
We found a high level of agreement between MRI and US measurements of mean cartilage thickness at the lateral, medial, and intercondylar femoral cartilage in children with JIA. This was in accordance with the previous results we obtained in healthy children14. Also, in our present study, the MRI observer was blinded to the US data, and vice versa. The US observer measured the cartilage thickness in both knees and was not informed about which knee was investigated by MRI. Before the study, the observers had reached consensus upon which anatomical landmarks were of interest for the measurement of cartilage thickness. The MRI was obtained using a dedicated knee coil having the knee in an extended position, but during the US examinations, the knee was maximally flexed. Because the measurements were made orthogonally to the cartilage surface in both imaging procedures, the different positions of the knee would not influence the measured values. In addition, the MRI and US examinations were performed at the same day aiming for a high level of concordance for the 2 measurements. Although we found a good correlation between MRI and US measurements, the cartilage thickness was still higher when measured by MRI compared to US.
In the Bland-Altman plots (Figure 2A), we discovered a systematic error as the US consistently measured thinner cartilage than MRI, especially with increasing cartilage thickness. The systematic error could be a result of a default setting in the US machines that uses an average sound speed of soft tissues at 1540 m/s to calculate distances. However, some studies have pointed out that the speed of sound in joint cartilage is about 1696 m/s (1626–1892 m/s)18,19,20. Therefore, one needs to multiply US measurement of joint cartilage by a factor of 1.10 to acquire accurate results. When we corrected the US measurements for the speed of sound, we no longer found a difference in the measurements of cartilage thickness between MRI and US, and the systematic error in the Bland-Altman plots disappeared (Figure 2B). Moreover, it is known that the speed of sound in cartilage varies even within the same joint cartilage and within the 4 cartilage layers of the joint, with higher speed in the deepest layers19,20.
Our study only included children above the age of 7 because the ethical committee did not approve the use of general anesthetics necessary for MRI in the young age group. As younger children have irregular ossification centers and a higher amount of epiphyseal cartilage, this may limit the use of our method for younger children and for other joints as well. In JIA, children with advanced ossification, which is seen in some joints, may be a theoretical reason for a false interpretation of thinner cartilage.
A disadvantage of US in comparison to MRI is the fact that US is limited in the range of investigation sides of different joints to those locations that are not concealed by bone shadowing, whereas MRI can assess all locations of a joint. In addition, the position with maximally flexed knee joints may be difficult to reach in cases of active arthritis because effusion and/or synovial hypertrophy may limit the range of motion. Further studies exploring these limitations are needed.
We found no structural changes or signal abnormalities in the cartilage during our study, which one might have expected because of earlier joint activity. Whether this is attributable to self-repair of cartilage structure or early treatment intervention is not known.
Unlike previous investigators, we measured the cartilage thickness both at the medial and lateral femoral condyles, as well as at the intercondylar notch. The intercondylar area is not a weight-bearing part of the cartilage and therefore is not directly affected by compression, as are the lateral and medial parts of the tibiofemoral joint, and it is easy to locate. Nevertheless, the medial and lateral parts of the cartilage may represent areas where the arthritis damage will appear first as the inflamed synovial layer (pannus) protrudes from the edges29. Although the interface between the synovium and the cartilage surface can easily be detected as a white band, it is our experience that the bony surfaces at the medial and lateral condyles may be difficult to distinguish in the youngest children and therefore harder to locate and measure during followup. Based on our findings, we suggest that the intercondylar area is the best spot to assess cartilage thickness because of a smaller variance of the mean difference and the fact that it is easier to locate exactly.
We found a high correlation between measurements of knee joint cartilage thickness assessed by MRI and US in 3 spots at the femoral base. Our study confirms that measurements of cartilage thickness assessed by US must be done in an orthogonal insonation angle to secure a sharp interface between tissues, and to prevent deviation of the beam. Moreover, when comparing exact measurements of cartilage thickness between US and MRI modalities, it is important to multiply the US measurements by a factor of 1.10 because of a higher sound velocity in cartilage than the average speed of sound in soft tissue. When corrected for speed of sound, we found equal measures between the 2 modalities. We found that the intercondylar spot was the best location for our validation study, because it is easier to access and shows less variability in the compared measurements between MRI and US. However, in daily practice the observer must be aware that early signs of arthritis may initialize at more peripheral locations of the joint cartilage.
Acknowledgment
We thank radiologic technologist Margit Haislund for her help and expertise during the MRI examinations, the Danish Rheumatism Association, and Aarhus University Research Foundation.
Footnotes
-
Supported by the Danish Rheumatism Association.
- Accepted for publication October 1, 2014.


